Back to Journals » Clinical and Experimental Gastroenterology » Volume 10
Interdependency between mechanical parameters and afferent nerve discharge in remodeled diabetic Goto-Kakizaki rat intestine
Authors Zhao J ![]() , Yang J, Liao D
, Yang J, Liao D ![]() , Gregersen H
, Gregersen H
Received 28 June 2017
Accepted for publication 27 October 2017
Published 1 December 2017 Volume 2017:10 Pages 303—314
DOI https://doi.org/10.2147/CEG.S145016
Checked for plagiarism Yes
Review by Single anonymous peer review
Peer reviewer comments 2
Editor who approved publication: Professor Anastasios Koulaouzidis
Jingbo Zhao,1 Jian Yang,1 Donghua Liao,1 Hans Gregersen2
1Giome Academia, Department of Clinical Medicine, Aarhus University, Aarhus, Denmark; 2Giome Center, Department of Surgery, Chinese University of Hong Kong and Prince of Wales Hospital, Shatin, Hong Kong
Background: Gastrointestinal disorders are very common in diabetic patients, but the pathogenesis is still not well understood. Peripheral afferent nerves may be involved due to the complex regulation of gastrointestinal function by the enteric nervous system.
Objective: We aimed to characterize the stimulus–response function of afferent fibers innervating the jejunum in the Goto-Kakizaki (GK) type 2 diabetic rat model. A key question is whether changes in afferent firing arise from remodeled tissue or from adaptive afferent processes.
Design: Seven 32-week-old male GK rats and seven age-matched normal Wistar rats were studied. Firing from mesenteric afferent nerves was recorded in excised jejunal segments of seven GK rats and seven normal Wistar rats during ramp test, stress relaxation test, and creep test. The circumferential stress–strain, spike rate increase ratio (SRIR), and single unit firing rates were calculated for evaluation of interdependency of the mechanical stimulations and the afferent nerve discharge.
Results: Elevated sensitivity to mechanical stimuli was found for diabetic nerve bundles and single unit activity (P<0.05). The stress relaxed less in the diabetic intestinal segment (P<0.05). Linear association between SRIR and the thickness of circumferential muscle layer was found at high stress levels as well as for SRIR and the glucose level.
Conclusion: Altered viscoelastic properties and elevated mechanosensitivity were found in the GK rat intestine. The altered nerve signaling is related to muscle layer remodeling and glucose levels and may contribute to gastrointestinal symptoms experienced by diabetic patients.
Keywords: afferents, spike rate, stress–strain, creep, stress relaxation, small intestine, type 2 diabetes
Introduction
Diabetes mellitus is associated with gastrointestinal (GI) symptoms such as nausea, bloating, abdominal pain, diarrhea, and constipation. Up to 75% of diabetic patients have experienced GI symptoms.1 However, neither the pathophysiology nor the pathogenesis of GI symptoms in diabetes patients is well understood. Further studies of the mechanisms of diabetic GI complications are needed in order to better understand the symptoms and improve treatment and life quality of the patients.
GI dysmotility, delayed gastric emptying, delayed intestinal transit,2,3 and bacterial overgrowth4 which may contribute to the symptoms have been observed in diabetic patients. Tissue remodeling with mucosa and muscle proliferation,5 increased wall stiffness,6,7 reduced number of interstitial cells of Cajal (ICC),8 impaired neuronal function, and reduced nerve conduction speed9,10 may contribute to the abnormal motility in diabetics. However, the severity of GI dysfunction is not always associated with the symptoms. This mismatch may relate to changes in the sensory system, that is, normal GI events may be perceived in an abnormal way.8,11
Despite the vast number of motility studies, only few studies focused on the sensory function in the diabetic GI tract. Several publications focused on perception in diabetic patients, but large variation was found between studies.11–14 Most sensory studies focused on the central nervous system.15,16 However, disordered signaling may arise in the peripheral afferent system since various diabetic GI complications seem to relate to the enteric nerve system (ENS) and enteric neuropathy.15,17 This may lead to abnormalities in intestinal motility, sensation, secretion, and absorption.18
The Goto-Kakizaki (GK) rat has been widely used as a reliable animal model for impaired glucose tolerance and mild type 2 diabetes.19 Recent studies have shown that GK rats have characteristic features of neuropathy, such as abnormal nerve conductivity, axonal atrophy, segmental demyelination, and altered nerve growth factor.20 Previously, we demonstrated significant morpho-mechanical remodeling in diabetic GK rats.7 Furthermore, we demonstrated that jejunal contractility was hyperreactive to flow and distension after carbachol application in GK rats.21 Therefore, we hypothesized that afferent signaling will change due to the intestinal wall remodeling-induced hypersensitive responses to the mechanical stimulations. A key question is whether changes in afferent firing arise from remodeled tissue or from adaptive afferent processes.22 In this study, we evaluated the peripheral nerve function by measuring the afferent signal from intestinal mesenteric nerves using an in vitro setup in GK rat jejunum. The association between the mechanosensitivity and tissue remodeling was evaluated.
Materials and methods
Animals
Seven inherited type 2 diabetic GK rats (Diabetes group), 12 weeks old and weighing about 330 g, were purchased from Taconic Europe (Ejby, Denmark). Seven age-matched normal Wistar rats of the same strain as the GK rats served as controls (Control group). During breeding, the body weight was measured every week from 12 weeks. The rats drank tap water and ate food without restrictions. The fasting glucose level of the rats was measured every second week starting from 20 weeks and at the last day of the experiment. The rats survived for 32 weeks and were made to fast overnight before the experiments. Approval of the protocol (2008/561-1530) was obtained from the Danish Committee for Animal Experimentation and the Danish Animal Experiments Inspectorate. The welfare of the experimental animals was ensured following the Guide for the Care and Use of Laboratory Animals from Animal Welfare – Ministry of Environment and Food of Denmark.
Experiment setup and nerve recording
The experimental setup of Yang et al was adopted in this study.22 Briefly, at the last day, the animals were anesthetized with Hypnorm 0.5 mg and Dormicum 0.25 mg per 100 g body weight (Hypnorm:Dormicum:sterile water=1:1:2; subcutaneous injection). A segment of jejunum between 25 and 30 mm in length was obtained and transferred to a tissue bath perfused with 35°C, oxygenated (95% O2+5% CO2) Krebs solution. Both ends of the jejunal segment were cannulated. One cannula could be moved along the longitudinal axis to adjust the length of the intestine to avoid bending during distension. The longitudinal stretch ratio was 1.3.22 The distal cannula was connected to a T-shaped connector for outlet control. The proximal cannula was connected to a syringe pump (AL1000; WPI, Sarasota, FL, USA) through a T-connector for intraluminal inflow control. The intraluminal pressure was recorded at 10 Hz sample rate through a narrow-bore intraluminal catheter connected to a pressure amplifier (NL 108; Digitimer, Welwyn Garden City, UK). For nerve signal recording, the mesenteric bundle was carefully dissected from the blood vessels and drawn into a suction electrode connected to a Neurolog headstage (NL100, Digitimer).23 The nerve signal was amplified (NL104), filtered (NL 125, band pass 150–3000 Hz), and acquired (20 kHz sampling rate) in a computer through a Micro 1401 interface and Spike 2 software version 6 (Cambridge Electronic Design, Cambridge, England). A charge-coupled device camera (CV3200; JAI, Copenhagen, Denmark) connected to the microscope was used to record video images of the preparation simultaneously with the spike signal collection.
Experimental protocols
The afferent responses to three different mechanical distension protocols, that is, ramp distension, mechanical stress relaxation, and creep, were studied according to Yang et al.22 In brief, the protocols were as follows (Figure 1):
- Ramp distension test: Inflations with volume flow of 0.3 mL/min (slow) and 1.0 mL/min (fast) up to a maximum pressure of 60 mmHg were done. Each flow rate was repeated two times to test the reproducibility.23,24 The experiment was designed to determine how the nerve firing reacts to continuous changes of mechanical stress and strain and to altered stimulation speed in the diabetic intestine.
- Stress relaxation test: The lumen pressure was increased to 20 and 40 mmHg using an inflation speed of 1.0 mL/min, after which the volume was kept constant for 5 min. The test was designed to study how the afferent nerve reacts to a fixed volume (strain) but decaying pressure (stress).
- Creep test: The lumen pressure was increased to 20 and 40 mmHg using an inflation speed of 1.0 mL/min and then kept constant using a water column 20 and 40 mmHg for 5 min. The test was designed to study how the nerve reacts to fixed pressure (stress) and slow increase in strain.
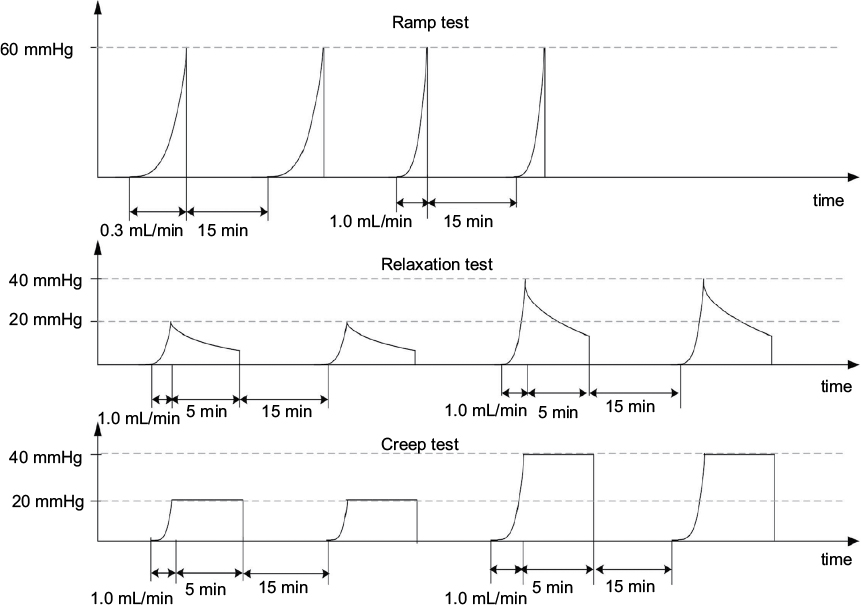 | Figure 1 The experimental protocol includes three distension experiments: 1) ramp distension with two different speeds: 0.3 and 1.0 mL/min; 2) relaxation test: ramp distension with 1.0 mL/min to 20 and 40 mmHg and keeping the volume constant for 5 min; 3) creep test: ramp distension with the fast speed to 20 and 40 mmHg and keeping the pressure constant for 5 min. The interval between mechanical stimulations was 15 min. |
Mechanical data analysis
Dye (indigo carmine, blue color) was infused into the lumen during distensions to increase the color contrast. The intestinal diameter during distension was measured using image processing of the video sequences.22 After the distension tests, two rings of 1–2 mm width were cut from the middle part of the segment, microscopic photos were taken, and morphologic parameters were measured using SigmaScan (Jandel Scientific, Erkrath, Germany) for calculation of stress and strain in the intestinal wall. It is important to compute the mechanical stress and strain because the mechanoreceptors react to these mechanical stimuli rather than directly to the luminal pressure or volume.25 Computations were done knowing the cross-sectional wall area in the no-load state, the outer diameters during the distension, and the length of the specimen, assuming that the intestinal wall was homogenous, cylindrical, thin walled, and incompressible. The inner radius–thickness ratio was <10 at the no-load state. However, even at very low distension pressure, the inner radius–thickness ratio increased to more than 10, which is the prerequisite for using thin-walled stress analysis.25 Hence, the circumferential stress (force/area) and strain (deformation) were computed as
|
|

Analyses of afferent nerve discharge
Afferent nerve discharge was evaluated as the spike rate (the number of spikes per second). The spike rate increase ratio (SRIR) was computed as:
|
|
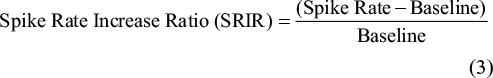
The baseline was the spontaneous nerve firing activity at resting conditions when mechanical stimuli were not applied. All data including SRIR expressed as function of pressure, Cauchy strain, or Cauchy stress, and Cauchy stress expressed as function of Cauchy strain were smoothed using LOWESS method26 and interpolated using a cubic spline function before averaging. The association between the glucose levels and SRIR as function of stress were analyzed by linear regression curve fitting.
In the relaxation and creep tests, the stress, strain, and spike rate were normalized as follows:
|
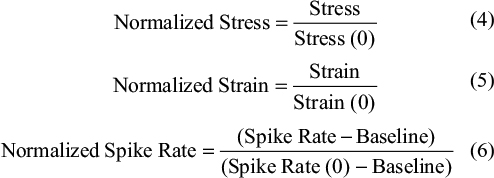
Stress (0), strain (0), and spike rate (0) indicate the initial stress, strain, and spike rate when the relaxation or creep started.
Single unit analysis
Single unit analysis of the recorded nerve signals was done off-line using Spike 2 (version 6.15) spike sorting software. This method is capable of identifying single units within multiunit nerve bundle preparations.23 In short, data with a large signal-to-noise ratio were processed using a standard threshold, which is around six times the standard deviation of the background noise. Spike templates were formed when more than eight spikes of similar waveform were identified. Each spike was assigned to a template. In this study, single unit analysis was only applied to ramp tests of 0.3 mL/min to avoid superimposed spikes that can occur at high firing rates. The single unit activity during the distension was expressed by the spike rate increase over baseline (spike rate − baseline). Single units were classified into high-threshold (HT), wide-dynamic range (WDR), and low-threshold (LT) units based on their response profile during the distensions.24 In brief, the response at 20 mmHg was expressed as the percentage of the response at 50 mmHg. Values <15% were taken as HT afferents and >65% as LT afferents. Values between 15% and 65% were classified as WDR.
Histologic analysis of the small intestine
After the mechanical experiment, the segment was fixed in 10% buffered formalin over 24 h. Five-micron sections were cut and stained with hematoxylin and eosin. Layer thicknesses were measured at 12 circumferential locations in each specimen and averaged. The association between layer thickness of the intestine and SRIR as function of stress and strain was analyzed by linear regression curve fitting.
Statistical analysis
The results are expressed as mean and standard error of the mean unless otherwise indicated. The remaining SRIR after relaxation or creep were compared using Student’s t-test. Two-way analysis of variance followed by Tukey’s post hoc test was used to compare the following parameters: 1) stress level, 2) strain level, 3) SRIR, and 4) firing rate of single units. Values of P<0.05 were considered significant. The software package SigmaStat version 2.0 (Jandel Scientific) was used for the statistical analysis.
Results
Body weight and blood glucose level
From 12 weeks, we measured the body weight weekly. The body weight of diabetic GK and normal rats increased as a function of time (Figure 2A). At each time point, GK rats were about 10% heavier than normal rats (P<0.001). From 20 weeks, we measured the fasting glucose levels once every second week under anesthetization. More variation in glucose level was seen in GK rats. The average glucose level in GK rats at different time points was significantly higher than the level in normal rats (P<0.001; Figure 2B).
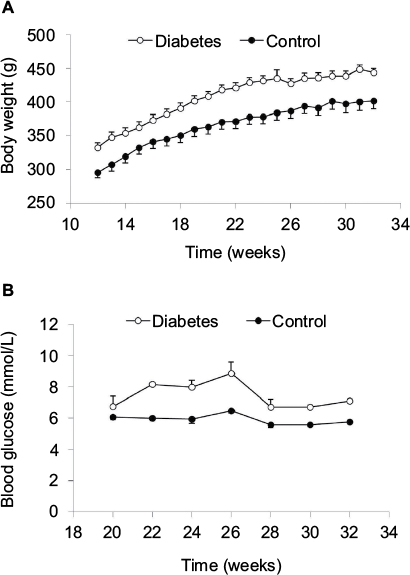 | Figure 2 Body weight (A) and blood glucose level (B). Notes: Both body weight and blood glucose level were significantly higher in Diabetes rats than in Control rats (P<0.001). |
Nerve firing in response to changes of pressure, stress–strain, and inflation speed
The baseline spike activity did not differ between the Diabetes group (70.2±8.2) and the Control group (65.7±5.8; P>0.1). Furthermore, the baseline spike activity did not depend on body weight (coefficient R2=0.0176, P>0.8), indicating that differences in body weight between the two groups cannot explain the differences in afferent firing. Representative tracings showing the distension-induced multiunit afferent response to jejunal distension (inflation speed 0.3 mL/min) in preparations from Control and Diabetes rats are shown in Figure 3. The afferent response to distension was increased in diabetic rats and was most pronounced at high pressure levels. The stress–strain relationship did not differ between the Control and Diabetes groups for the two distension speeds (Figure 4A, B), indicating that the intestinal wall stiffness was the same in the two groups. In the SRIR–pressure (Figure 4C, D), SRIR–stress (Figure 4E, F), and SRIR–strain relationships (Figure 4G, H), the curves showed a biphasic pattern. Furthermore, 1.0 mL/min inflation speed induced higher afferent firing than 0.3 mL/min (P<0.05). The SRIR–pressure and SRIR–stress relationships clearly showed higher afferent firing for the Diabetes group for inflation speed 0.3 mL/min (P<0.05; Figure 4C, E) and 1.0 mL/min (P<0.01; Figure 4D, F). The SRIR–pressure relationship followed a logarithmic function, whereas the SRIR–stress relationship was nonlinear at low stress levels and linear at high stress levels. The SRIR–strain relationship appeared to be exponential in shape. Compared with the Control group, afferent response increased more in the Diabetes group at high strains. Significant difference was found when the strain was bigger than 0.4 with an inflation speed 0.3 mL/min (P<0.05; Figure 4G).
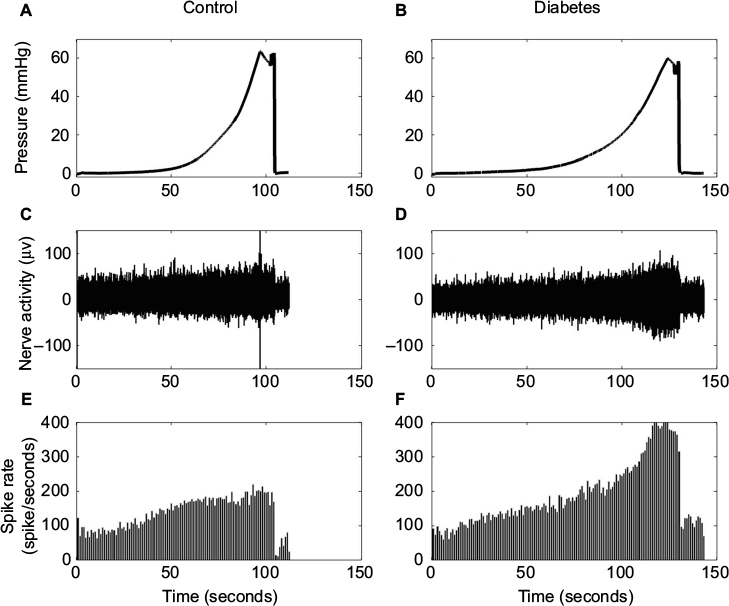 | Figure 3 Representative tracings showing the distension-induced multiunit afferent response to jejunal distension. The inflation speed is 0.3 mL/min. Notes: The tracings show the pressure curves (A and B), nerve activity (C and D), and spike rate (E and F) from Control (left panel) and Diabetes (right panel) rats. The afferent response increases as a function of increase in pressure. Stronger afferent response was found in Diabetes rats and was most pronounced at a high pressure level. |
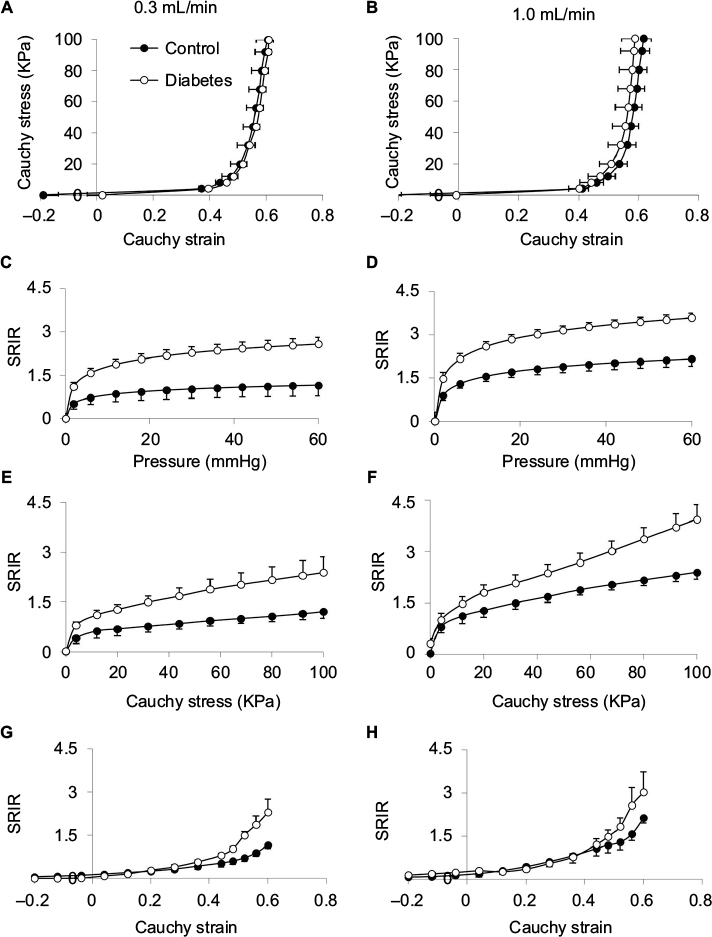 | Figure 4 Stress–strain and SRIR with pressure, stress, and strain relationships: The left panel shows the results at a distension speed of 0.3 mL/min and the right panel shows the results at a distension speed of 1.0 mL/min. Notes: Data represent mean±SE. Stress–strain relationships (A and B) show no significant difference between Control and Diabetes groups (P>0.05). SRIR–pressure relationships (C and D) show that increased response was found in the Diabetes group at high pressure levels (C, P<0.05; D, P<0.01). SRIR–stress relationship (E and F) shows increased response in the Diabetes group at high stress levels (E, P<0.05; F, P<0.01). SRIR–strain relationship (G and H) shows increased afferent response in the Diabetes group compared with the Control group when the strain was bigger than 0.4 at an inflation speed 0.3 mL/min (G, P<0.05). Abbreviations: SE, standard error; SRIR, spike rate increase ratio. |
The average responses of the three different types of single units, that is, LT, WDR, and HT, to stress and strain at distension rate 0.3 mL/min are shown in Figure 5. In general, the single unit responses had the same curve shapes as the whole nerve response to stress and strain, that is, nearly linear shape to stress after an initial nonlinear phase (Figure 5A, C, E) and nonlinear (appeared to be exponential in shape) to strain (Figure 5B, D, F). Increased afferent responses were found in the diabetic group. For the afferent response–stress relationship, significant difference was found for WDR and HT fibers at high stress levels (P<0.05; Figure 5C, E). For the afferent response–strain relationship, significant difference was found for HT fibers at high strain levels (P<0.05; Figure 5F). The summation of the response of all mechanosensitive single units to the stress and strain at distension rate 0.3 mL/min is shown in Figure 5G and H. Again, higher nerve firing response was observed in the diabetic group. A significant difference was found for the afferent response–stress relationship (Figure 5G) at high stress level (P<0.01).
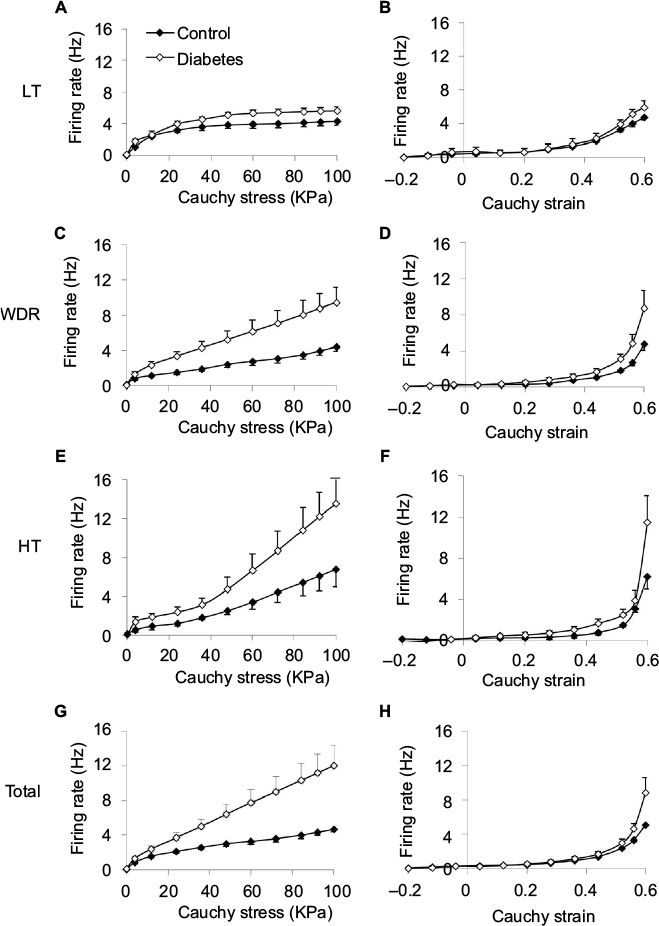 | Figure 5 Stimulus response profiles of the three classes of single units and total single units: LT (A and B), WDR (C and D), HT (E and F), and total (G and H) against stress (left panel) and strain (right panel) during distension at 0.3 mL/min are shown. Notes: Data represent mean±SE. For afferent response–stress relationship, higher nerve firing response was observed in the diabetic group, and a significant difference was found for WDR (C), HT (E), and total single units (G) at high stress levels (P<0.05). For the afferent response–strain relationship, significant difference was found for HT fibers at high strain levels (F, P<0.05). Abbreviations: HT, high threshold; LT, low threshold; SE, standard error; WDR, wide-dynamic range. |
Nerve firing reaction to static stress or strain
The data were similar for the stress relaxation and creep experiments to maximum pressure 20 and 40 mmHg. Hence, only data from 20 mmHg level are shown in Figure 6. In the stress relaxation and creep tests, higher SRIR was found in GK rats at the start of the stress relaxation and creep tests (P<0.05; Figure 6A, C). During the 300 seconds of the stress relaxation test, the Diabetes group maintained a higher SRIR level than the Control group (Figure 6A). In the creep test, the difference in SRIR disappeared soon after the start (Figure 6C). Figure 6 also shows normalized data for stress, strain, and SRIR for the stress relaxation (Figure 6B) and creep tests (Figure 6D). During the 300 seconds, less stress was released during relaxation in the GK rat (P<0.05; Figure 6B), whereas there was no significant difference for the strain in the creep test (P>0.05; Figure 6D). Except for minor initial deviations, no difference was found for the normalized SRIR both in the relaxation test and the creep test (Figure 6B, D).
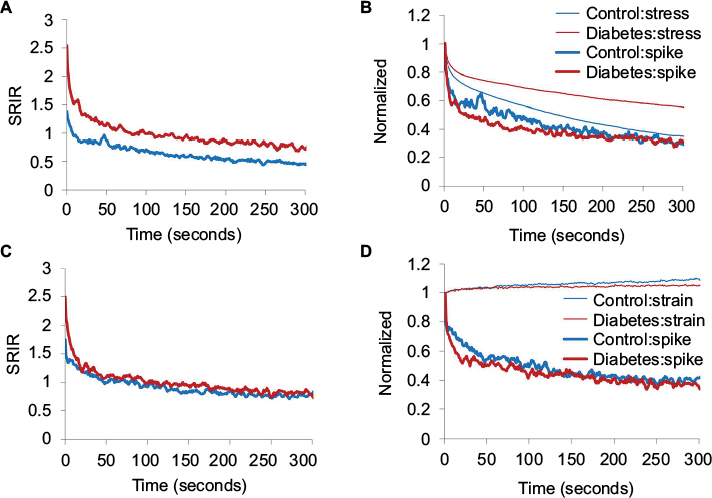 | Figure 6 Multiunit afferent response during stress relaxation test (A, B) and creep test (C, D) starts with distension pressure 20 mmHg. Notes: The averaged SRIR without normalization (A and C). The averaged normalized stress (B) and normalized strain (D) and normalized spike reduction (both B and D). Higher SRIR was found in GK rat at the start point of the stress relaxation and creep test (A and C, P<0.05). During the 300 seconds, less stress was released during the relaxation in the GK rat (B, P<0.05). Abbreviations: GK, Goto-Kakizaki; SRIR, spike rate increase ratio. |
Association between nerve firing reaction, tissue remodeling, and glucose level
The muscle and submucosa layer thicknesses are illustrated in Figure 7A–C. Compared with Control group (Figure 7A), increasing muscle layer thickness is evident in the jejunal segment of the Diabetes group (Figure 7B). The average circumferential muscle layer thickness was significantly more in the Diabetes group than in the Control group (P<0.05; Figure 7C). Thickness difference was not found in the longitudinal muscle layer and the submucosa layer between the two groups (P>0.05).
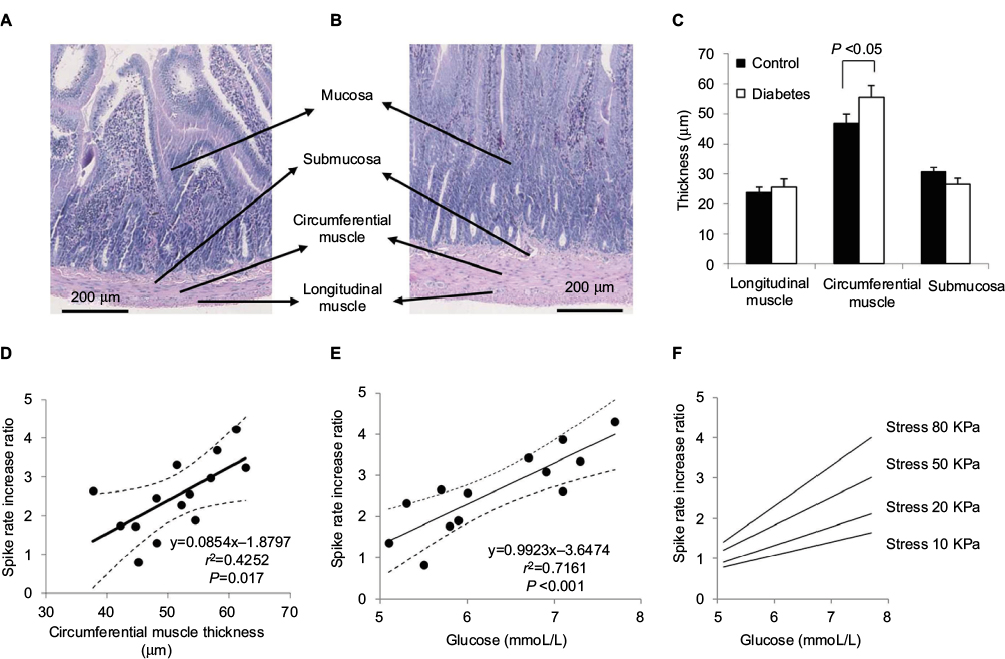 | Figure 7 Layer thickness (A–C) and association of SRIR and circumstantial muscle thickness (D), or with glucose (E and F). Notes: Representative histology images of jejunum are provided for Control (A) and Diabetes (B) groups. The muscle layer, especially the circumferential muscle layer thickness, was bigger in the Diabetes group than in the Control group. The average circumferential muscle layer thickness in GK rats was significantly more than that of normal rats (C, P<0.05). Linear association existed between the circumferential muscle layer thickness and SRIR at a stress level of 80 kPa for an inflation speed of 1.0 mL/min (D, P=0.017). SRIR was also highly associated with the glucose level measured at week 32 at a stress level 80 kPa in the high inflation speed (E, P<0.001). The dot lines (D and E) indicate the 95% CI. SRIR versus glucose level at week 32 in four different stress levels are shown in (F). Abbreviations: GK, Goto-Kakizaki; SRIR, spike rate increase ratio. |
Linear association was found between the circumferential muscle layer thickness and the SRIR as a function of stress at stress levels over 65 kPa for an inflation speed of 0.3 mL/min and at stress levels over 50 kPa for an inflation speed of 1.0 mL/min (coefficient R2 from 0.2533 to 0.4074, P<0.05). No association was found between the SRIR and the thickness of other layers (P>0.05). Figure 7D illustrates the linear association between the circumferential muscle layer thickness and the SRIR at a stress level of 80 kPa for an inflation speed of 1.0 mL/min (coefficient R2=0.4252 and P=0.017). The dot line curves show the values of 95% CI. Associations were not found between the baseline afferent nerve activity and the change in layer thicknesses (coefficient R2=0.0931, P>0.5), or with the glucose level.
SRIR depended on the glucose level. The associations were in general higher for the glucose level at the last measurement at week 32 than for the accumulated glucose levels from 20 to 32 weeks. It was in general also slightly better correlated for the fast inflation speed than for the slow inflation speed. Figure 7E shows SRIR as a function of glucose level at the last measurement at week 32 at a stress level of 80 kPa at the high inflation speed (coefficient R2=0.7161, P<0.001). The dot line curves show the values of 95% CI. The associations showed higher correlation coefficients as well as higher slopes at high stress levels (Figure 7F).
Discussion
The main findings of this study were that the afferent baseline activity and the afferent response pattern to mechanical stimulation were preserved in the intestine of type 2 diabetic GK rats, but with a marked increase in afferent nerve response. The hypersensitivity was most evident at high stress and strain levels. From the receptor subtype data, it appeared that the encoded responses were mainly due to increased sensitivity of the WDR and HT receptors, especially when expressed as a function of stress. Furthermore, the afferent nerve response to mechanical stimulation was highly dependent on the glucose level, whereas the baseline afferent spike level did not depend on glucose level or weight difference.
Hypersensitivity of diabetic intestinal afferents to mechanical stimulation
Despite many studies on the disturbances of GI motility in diabetic animals3,21,27–30 and patients,27,31–36 less information exists on the sensory function of the diabetic GI tract, likely because it is more difficult to study objectively. There is evidence for both heightened and impaired gut sensation in diabetes. For example, Rayner et al demonstrated that type 1 diabetic patients exhibited much greater perception of gastric distension than healthy controls during euglycemia.14 In contrast, type 1 diabetic patients exhibited a reduced perception to various stimuli, including distension in esophagus and duodenum, with increased pain referral areas.11 The divergence between studies is probably multifactorial and due to glycemic control, autonomic neuropathy, pre-existing symptoms, and psychological factors. The altered GI sensation in diabetes may be due to altered mechanoreceptor function and afferent pathways rather than being a central phenomenon. As most studies on GI sensory function in diabetes were performed in human beings, it is difficult to locate the origin in the peripheral organ and nerves. This study recorded intestinal afferent signal directly from the peripheral pathway without influence from the central nervous system and the stimulus was controlled and quantified in mechanical terms. The results showed that the afferents’ activity from diabetic jejunum were hypersensitive, especially at high stress and strain levels. We have demonstrated previously that jejunal contractility was hyperreactive to flow and distension after carbachol application in GK diabetic rats.21 Studies on somatic afferents also demonstrated that diabetes results in enhanced function of cutaneous nociceptors,37 which leads to painful diabetic neuropathy and mechanical allodynia. This indicates increased excitability of diabetic nociceptive afferents.
Numerous physiologic studies have demonstrated that the ENS, ICC, and afferent innervation play critical roles for the intestinal sensory function.38–40 Diabetes is associated with changes in enteric neuronal size, number, and neurodegeneration, such as axonal swelling.41 Degeneration and loss of unmyelinated and small myelinated fiber and decreased nerve conduction velocity were reported in diabetic GK rats.20 Reduction in ICC and associated nerve structures was reported both in diabetic patients42 and diabetic animal models.43 Several studies have demonstrated loss of inhibitory neurons such as neuronal nitric oxide synthase, vasoactive intestinal peptide, and galanin neurons in diabetes43,44 and increase in excitatory neurons with increased density of cholinergic innervation in diabetic jejunum, ileum, and muscularis propria of duodenum from rat and nonobese mice.45 In addition, an increase in serotonin content of the duodenum has been noted in diabetic animals.46 Changes in serotonin receptor expression may mediate the sensory component of GI disturbances observed in diabetes such as nausea and early satiety. Loss of inhibitory neurons and increase in excitatory neurons in ENS may have contributed to the increased sensitivity to mechanical stimulation in this study.
Diabetes-induced remodeling may contribute to hypersensitivity of diabetic intestinal afferent
The pathogenesis of diabetic gastroenteropathy is mainly considered to be neuropathic, but tissue material properties may also play an important role. Increased passive tissue stiffness in the intestinal and esophageal wall was reported in diabetic animals.6,7 Altered tissue stiffness may contribute to the GI symptoms in the diabetic patients.11 In this study, we did not confirm previous findings of increased stiffness in GK diabetic rats as judged from the stress–strain curves. However, we found that significantly less stress was released during the relaxation test and less deformation was obtained from the creep test in the GK rats. The altered viscoelastic properties are a consequence of structural remodeling of smooth muscle, collagen, and elastin and rearrangement of these components within the tissue. Increased collagen components probably play an important role because stress relaxation of collagen is much smaller than the relaxation of smooth muscle.11 It should also be noted that the stress distribution is not uniform in the wall25 and that pronounced thickening of the circumferential muscle layer will shift the stress–strain distribution in the diabetic intestinal wall. There are reports of mechanoreceptors in the submucosal plexus and the myenteric plexus (intraganglionic laminar nerve endings) and in the muscle (intramuscular arrays).47,48 Any change in morphology and stiffness of individual layers will inevitably change the stresses and strains the receptors are exposed to, even if they are located in layers that apparently do not change the morphology. For example, the submucosal mechanoreceptors may be exposed to higher stresses in a diabetic small intestinal wall with increased circumferential muscle layer thickness. It has been demonstrated that vagal afferents were always LT, while the HT and WDR afferents projected to the spinal cord. This indicates that the LT vagal afferents respond to more physiologic stimuli, whereas the splanchnic nerves are generally believed to mediate nociceptive responses.49 Furthermore, the vagal afferents were located in the muscle layers and myenteric plexus.50 We found the most pronounced hypersensitivity in the WDR and HT receptors, indicating that we were studying nociceptive pathways. To the best of our knowledge, information does not exist on where the HT and WDR receptors are located in the wall. The complex interplay between muscle thickening, the anisotropic mechanical environment, and the receptor subtypes and nerve remodeling needs further studies.
High blood glucose level in diabetes is associated with hypersensitivity of diabetic intestinal afferent
Increased blood glucose concentration modulates compliance (stiffness), motility, and sensory feedback from the GI tract.13 Mild (physiologic) elevation of blood glucose concentration may affect GI sensation.41 Sensation arising from proximal gastric distension is greater during marked hyperglycemia,51 and patients with insulin-dependent diabetes experience more frequent GI symptoms than patients with poor glycemic control. The perception of postprandial fullness is related to the blood glucose concentration.19,51 Therefore, even mild hyperglycemia, as observed in diabetic GK rats, may affect sensitivity. This was confirmed in this study, where associations were found between SRIR and glucose level. Hence, the glucose level is an important factor contributing to the intestinal afferent hypersensitivity to mechanical stimuli. The diabetes rats weighed 10% more than the normal rats. However, we find it unlikely that the neural differences found in this study can be explained by weight differences rather than by diabetic disease because the baseline afferent firing was the same in the two groups and no association was found between weight and baseline firing.
Limitations of the study
There are limitations and unknown factors in this study. Our study focused on afferent nerve recordings and we did not confirm neuropathic changes in the jejunal wall by histology. Secondly, we did not compare the mechanosensory responses of jejunal afferents at different stages of diabetes and only studied one intestinal segment. Thirdly, we could not confirm previous findings of increased stiffness in GK diabetic rats as judged from the stress–strain curves. This may be due to differences in distension protocols. Finally, the intestinal segment may release mediators that affect the afferent nerves during distension, which may contribute to the altered mechanosensory responses observed in diabetic intestine. Further research is needed to overcome these limitations. In addition, it will be beneficial to study how the afferent responses encode to localized distribution of mechanosensitive receptor subtypes and the mechanical environment that they are embedded in.
Conclusion
Altered viscoelastic properties and elevated sensitivity to acute mechanical stimulations in the intestine were found in GK rats. The hypersensitivity was primarily attributed to WDR and HT receptors that are believed primarily to be nociceptive. The observed changes, clearly indicative of peripheral nerve changes, are related to chronic mild hyperglycemia and muscle layer remodeling. The study provides a useful model for understanding the basic mechanisms of afferent signaling leading to GI symptoms experienced by diabetic patients.
Acknowledgment
The study was financially supported by Karen Elise Jensen Foundation.
Author contributions
JZ performed the animal experiments and histologic analysis, analyzed data, prepared and revised manuscript and figures. JY prepared manuscript and figures, analyzed data, performed afferent nerve recording and single unit analysis. DL performed mechanical data analysis and imaging analysis and revised the manuscript. HG designed and supervised the study and revised the manuscript. All authors reviewed the manuscript. All authors contributed toward data analysis, drafting and revising the paper and agree to be accountable for all aspects of the work.
Disclosure
All authors report no conflicts of interest in this work.
Reference
Bytzer P, Talley NJ, Leemon M, Young LJ, Jones MP, Horowitz M. Prevalence of gastrointestinal symptoms associated with diabetes mellitus: a population-based survey of 15,000 adults. Arch Intern Med. 2001;161(16):1989–1996. | ||
Samsom M, Smout AJ. Abnormal gastric and small intestinal motor function in diabetes mellitus. Dig Dis. 1997;15 (4–5):263–274. | ||
Yamamoto T, Watabe K, Nakahara M, et al. Disturbed gastrointestinal motility and decreased interstitial cells of Cajal in diabetic db/db mice. J Gastroenterol Hepatol. 2008;23(4):660–667. | ||
Ojetti V, Pitocco D, Scarpellini E, et al. Small bowel bacterial overgrowth and type 1 diabetes. Eur Rev Med Pharmacol Sci. 2009;13(6):419–423. | ||
Nowak TV, Harrington B, Weisbruch JP, Kalbfleisch JH. Structural and functional characteristics of muscle from diabetic rodent small intestine. Am J Physiol. 1990;258 (5 pt 1):G690–G698. | ||
Zhao J, Yang J, Gregersen H. Biomechanical and morphometric intestinal remodelling during experimental diabetes in rats. Diabetologia. 2003;46(12):1688–1697. | ||
Zhao J, Chen P, Gregersen H. Morpho-mechanical intestinal remodeling in type 2 diabetic GK rats-is it related to advanced glycation end product formation? J Biomech. 2013;46(6):1128–1134. | ||
Forrest A, Huizinga JD, Wang XY, Liu LW, Parsons M. Increase in stretch-induced rhythmic motor activity in the diabetic rat colon is associated with loss of ICC of the submuscular plexus. Am J Physiol Gastrointest Liver Physiol. 2008;294(1):G315-G326. | ||
Kishi M, Tanabe J, Schmelzer JD, Low PA. Morphometry of dorsal root ganglion in chronic experimental diabetic neuropathy. Diabetes. 2002;51(3):819–824. | ||
McHugh JM, McHugh WB. Diabetes and peripheral sensory neurons: what we don’t know and how it can hurt us. AACN Clin Issues. 2004;15(1):136–149. | ||
Frokjaer JB, Andersen SD, Ejskaer N, et al. Gut sensations in diabetic autonomic neuropathy. Pain. 2007;131(3):320–329. | ||
Beyak MJ, Bulmer DC, Sellers D, Grundy D. Impairment of rectal afferent mechanosensitivity in experimental diabetes in the rat. Neurogastroenterol Motil. 2009;21(6):678–681. | ||
Rayner CK, Samsom M, Jones KL, Horowitz M. Relationships of upper gastrointestinal motor and sensory function with glycemic control. Diabetes Care. 2001;24(2):371–381. | ||
Rayner CK, Verhagen MA, Hebbard GS, DiMatteo AC, Doran SM, Horowitz M. Proximal gastric compliance and perception of distension in type 1 diabetes mellitus: effects of hyperglycemia. Am J Gastroenterol. 2000;95(5):1175–1183. | ||
Brock C, Graversen C, Frøkjaer JB, Søfteland E, Valeriani M, Drewes AM. Peripheral and central nervous contribution to gastrointestinal symptoms in diabetic patients with autonomic neuropathy. Eur J Pain. 2013;17(6):820–831. | ||
Drewes AM, Søfteland E, Dimcevski G, et al. Brain changes in diabetes mellitus patients with gastrointestinal symptoms. World J Diabetes. 2016;7(2):14–26. | ||
Uranga-Ocio JA, Bastús-Díez S, Delkáder-Palacios D, García-Cristóbal N, Leal-García MÁ, Abalo-Delgado R. Enteric neuropathy associated to diabetes mellitus. Rev Esp Enferm Dig. 2015;107(6):366–373. | ||
Horváth VJ, Putz Z, Izbéki F, et al. Diabetes-related dysfunction of the small intestine and the colon: focus on motility. Curr Diab Rep. 2015;15(11):94. | ||
Ling ZC, Hong-Lie C, Ostenson CG, Efendic S, Khan A. Hyperglycemia contributes to impaired insulin response in GK rat islets. Diabetes. 2001;50(Suppl 1):S108–S112. | ||
Murakawa Y, Zhang W, Pierson CR, et al. Impaired glucose tolerance and insulinopenia in the GK-rat causes peripheral neuropathy. Diabetes Metab Res Rev. 2002;18(6):473–483. | ||
Zhao J, Chen P, Gregersen H. Stress-strain analysis of jejunal contractility in response to flow and ramp distension in type 2 diabetic GK rats: effect of carbachol stimulation. J Biomech. 2013;46(14):2469–2476. | ||
Yang J, Zhao J, Jiang W, et al. Neurogenic adaptation contributes to the afferent response to mechanical stimulation. Am J Physiol Gastrointest Liver Physiol. 2012;302(9):G1025–G1034. | ||
Rong W, Hillsley K, Davis JB, Hicks G, Winchester WJ, Grundy D. Jejunal afferent nerve sensitivity in wild-type and TRPV1 knockout mice. J Physiol. 2004;560(pt 3):867–881. | ||
Booth CE, Shaw J, Hicks GA, Kirkup AJ, Winchester W, Grundy D. Influence of the pattern of jejunal distension on mesenteric afferent sensitivity in the anaesthetized rat. Neurogastroenterol Motil. 2008;20(2):149–158. | ||
Gregersen H. Biomechanics of gastrointestinal tract. London: Springer; 2003. | ||
Cleveland W.S. LOWESS: A program for smoothing scatterplots by robust locally weighted regression. The American Statistician. 1981;35:54. | ||
Horowitz M, Samsom M. Gastrointestinal function in diabetes mellitus. Chichester: John Wiley & Sons, Ltd; 2004. | ||
el Salhy M. Gastrointestinal transit in nonobese diabetic mouse: an animal model of human diabetes type 1. J Diabetes Complications. 2001;15(5):277–284. | ||
el Salhy M. Gastrointestinal transit in an animal model of human diabetes type 2: relationship to gut neuroendocrine peptide contents. Ups J Med Sci. 2002;107(2):101–110. | ||
Kumar MS, Prashanth KV. alpha-Lipoic acid ameliorates altered colonic contractility and intestinal transit in STZ-diabetic rats. Indian J Exp Biol. 2004;42(3):279–282. | ||
Folwaczny C, Hundegger K, Volger C, et al. Measurement of transit disorders in different gastrointestinal segments of patients with diabetes mellitus in relation to duration and severity of the disease by use of the metal-detector test. Z Gastroenterol. 1995;33(9):517–526. | ||
Iida M, Ikeda M, Kishimoto M, et al. Evaluation of gut motility in type II diabetes by the radiopaque marker method. J Gastroenterol Hepatol. 2000;15(4):381–385. | ||
Nguyen HN, Silny J, Wuller S, Marschall HU, Rau G, Matern S. Abnormal postprandial duodenal chyme transport in patients with long standing insulin dependent diabetes mellitus. Gut. 1997;41(5):624–631. | ||
Camilleri M, Malagelada JR. Abnormal intestinal motility in diabetics with the gastroparesis syndrome. Eur J Clin Invest. 1984;14(6):420–427. | ||
Dooley CP, el Newihi HM, Zeidler A, Valenzuela JE. Abnormalities of the migrating motor complex in diabetics with autonomic neuropathy and diarrhea. Scand J Gastroenterol. 1988;23(2):217–223. | ||
Samsom M, Jebbink RJ, Akkermans LM, van Berge-Henegouwen GP, Smout AJ. Abnormalities of antroduodenal motility in type I diabetes. Diabetes Care. 1996;19(1):21–27. | ||
Fuchs D, Birklein F, Reeh PW, Sauer SK. Sensitized peripheral nociception in experimental diabetes of the rat. Pain. 2010;151(2):496–505. | ||
Furness JB, Callaghan BP, Rivera LR, Cho HJ. The enteric nervous system and gastrointestinal innervation: integrated local and central control. Adv Exp Med Biol. 2014;817:39–71. | ||
Mazzuoli G, Schemann M. Mechanosensitive enteric neurons in the myenteric plexus of the mouse intestine. PLoS One. 2012;7(7):e39887. | ||
Zhu YF, Wang XY, Lowie BJ, et al. Enteric sensory neurons communicate with interstitial cells of Cajal to affect pacemaker activity in the small intestine. Pflugers Arch. 2014;466(7):1467–1475. | ||
Andrews JM, Rayner CK, Doran S, Hebbard GS, Horowitz M. Physiological changes in blood glucose affect appetite and pyloric motility during intraduodenal lipid infusion. Am J Physiol. 1998;275(4 pt 1):G797–G804. | ||
Miller SM, Narasimhan RA, Schmalz PF, et al. Distribution of interstitial cells of Cajal and nitrergic neurons in normal and diabetic human appendix. Neurogastroenterol Motil. 2008;20(4):349–357. | ||
Adeghate E, Ponery AS, Sharma AK, El-Sharkawy T, Donáth T. Diabetes mellitus is associated with a decrease in vasoactive intestinal polypeptide content of gastrointestinal tract of rat. Arch Physiol Biochem. 2001;109(3):246–251. | ||
Chandrasekharan B, Anitha M, Blatt R, et al. Colonic motor dysfunction in human diabetes is associated with enteric neuronal loss and increased oxidative stress. Neurogastroenterol Motil. 2011;23(2):131–138, e26. | ||
Chandrasekharan B, Srinivasan S. Diabetes and the enteric nervous system. Neurogastroenterol Motil. 2007;19(12):951–960. | ||
Takahara H, Fujimura M, Taniguchi S, Hayashi N, Nakamura T, Fujimiya M. Changes in serotonin levels and 5-HT receptor activity in duodenum of streptozotocin-diabetic rats. Am J Physiol Gastrointest Liver Physiol. 2001;281(3):G798–G808. | ||
Phillips RJ, Powley TL. Tension and stretch receptors in gastrointestinal smooth muscle: re-evaluating vagal mechanoreceptor electrophysiology. Brain Res Brain Res Rev. 2000;34(1–2):1–26. | ||
Song X, Chen BN, Zagorodnyuk VP, et al. Identification of medium/high-threshold extrinsic mechanosensitive afferent nerves to the gastrointestinal tract. Gastroenterology. 2009;137(1):274–284. | ||
Andrews PL, Grundy D, Scratcherd T. Vagal afferent discharge from mechanoreceptors in different regions of the ferret stomach. J Physiol. 1980;298:513–524. | ||
Grundy D. Mechanoreceptors in the gastrointestinal tract. J Smooth Muscle Res. 1993;29(2):37–46. | ||
Lingenfelser T, Sun W, Hebbard GS, Dent J, Horowitz M. Effects of duodenal distension on antropyloroduodenal pressures and perception are modified by hyperglycemia. Am J Physiol. 1999;276(3 Pt 1):G711–G718. |
 © 2017 The Author(s). This work is published and licensed by Dove Medical Press Limited. The
full terms of this license are available at https://www.dovepress.com/terms
and incorporate the Creative Commons Attribution
- Non Commercial (unported, 3.0) License.
By accessing the work you hereby accept the Terms. Non-commercial uses of the work are permitted
without any further permission from Dove Medical Press Limited, provided the work is properly
attributed. For permission for commercial use of this work, please see paragraphs 4.2 and 5 of our Terms.
© 2017 The Author(s). This work is published and licensed by Dove Medical Press Limited. The
full terms of this license are available at https://www.dovepress.com/terms
and incorporate the Creative Commons Attribution
- Non Commercial (unported, 3.0) License.
By accessing the work you hereby accept the Terms. Non-commercial uses of the work are permitted
without any further permission from Dove Medical Press Limited, provided the work is properly
attributed. For permission for commercial use of this work, please see paragraphs 4.2 and 5 of our Terms.