Back to Journals » Diabetes, Metabolic Syndrome and Obesity » Volume 8
Interaction between leucine and phosphodiesterase 5 inhibition in modulating insulin sensitivity and lipid metabolism
Authors Fu L, Li F, Bruckbauer A, Cao Q, Cui X ![]() , Wu R, Shi H, Xue B, Zemel M
, Wu R, Shi H, Xue B, Zemel M
Received 6 February 2015
Accepted for publication 23 March 2015
Published 6 May 2015 Volume 2015:8 Pages 227—239
DOI https://doi.org/10.2147/DMSO.S82338
Checked for plagiarism Yes
Review by Single anonymous peer review
Peer reviewer comments 3
Editor who approved publication: Professor Ming-Hui Zou
Lizhi Fu,1 Fenfen Li,1 Antje Bruckbauer,2 Qiang Cao,1 Xin Cui,1 Rui Wu,1 Hang Shi,1 Bingzhong Xue,1 Michael B Zemel2
1Department of Biology, Center for Obesity Reversal, Georgia State University, Atlanta, GA, 2NuSirt Biopharma Inc., Nashville, TN, USA
Purpose: Leucine activates SIRT1/AMP-activated protein kinase (AMPK) signaling and markedly potentiates the effects of other sirtuin and AMPK activators on insulin signaling and lipid metabolism. Phosphodiesterase 5 inhibition increases nitric oxide–cGMP signaling, which in turn exhibits a positive feedback loop with both SIRT1 and AMPK, thus amplifying peroxisome proliferator-activated receptor γ co-activator α (PGC1α)-mediated effects.
Methods: We evaluated potential synergy between leucine and PDE5i on insulin sensitivity and lipid metabolism in vitro and in diet-induced obese (DIO) mice.
Results: Leucine (0.5 mM) exhibited significant synergy with subtherapeutic doses (0.1–10 nM) of PDE5-inhibitors (sildenafil and icariin) on fat oxidation, nitric oxide production, and mitochondrial biogenesis in hepatocytes, adipocytes, and myotubes. Effects on insulin sensitivity, glycemic control, and lipid metabolism were then assessed in DIO-mice. DIO-mice exhibited fasting and postprandial hyperglycemia, insulin resistance, and hepatic steatosis, which were not affected by the addition of leucine (24 g/kg diet). However, the combination of leucine and a subtherapeutic dose of icariin (25 mg/kg diet) for 6 weeks reduced fasting glucose (38%, P<0.002), insulin (37%, P<0.05), area under the glucose tolerance curve (20%, P<0.01), and fully restored glucose response to exogenous insulin challenge. The combination also inhibited hepatic lipogenesis, stimulated hepatic and muscle fatty acid oxidation, suppressed hepatic inflammation, and reversed high-fat diet-induced steatosis.
Conclusion: These robust improvements in insulin sensitivity, glycemic control, and lipid metabolism indicate therapeutic potential for leucine–PDE5 inhibitor combinations.
Keywords: AMPK, diabetes, icariin, PDE5, sildenafil, SIRT1, steatosis
Introduction
Sirtuin 1 (SIRT1) and AMP-activated protein kinase (AMPK) are well established as key sensors of energy status,1–4 sensing energy deprivation via elevations in NAD+ and AMP, respectively. Notably, due to their cross-activation, AMPK and SIRT1 are targets of common activators and produce overlapping outcomes via stimulation of peroxisome proliferator-activated receptor γ co-activator α (PGC1 α) to regulate mitochondrial biogenesis and energy expenditure.5,6 The SIRT1–AMPK axis is suppressed in energy replete states, including obesity and diabetes, while activation of this axis improves hyperglycemia, insulin resistance, and lipid metabolism.7–9
Our previous work demonstrated that the branched chain amino acid l-leucine activates SIRT110–13 by lowering its activation energy for NAD+,10 with secondary activation of AMPK.11 This shift in SIRT1 sensitivity to NAD+ enables activation of this energy sensor at lower NAD+ concentrations, characteristic of energy replete states, and permits coactivation and amplification of other compounds that converge on the SIRT1/AMPK axis.10,12 This results in significant synergy of leucine with polyphenols and with metformin, resulting in significant increases in efficacy.10,12–15
Nitric oxide (NO) levels are also responsive to energy status and are upregulated during caloric restriction; elevated NO, in turn, stimulates SIRT1 activity.16,17 SIRT1, in turn, may reciprocally elevate NO levels via deacetylation (Lys 496; Lys 506) of endothelial nitric oxide synthase (eNOS)18,19; AMPK plays a similar role via phosphorylation of eNOS (Ser 1177),20,21 resulting in a cross-talk energy-sensing network of SIRT1, AMPK, and NO.
The classically established mode of NO action is via stimulation of soluble NO-sensitive guanylyl cyclase to elevate cGMP and initiate subsequent physiological changes, primarily via cGMP-dependent protein kinases (PKGs).22 Since termination of cGMP signaling is dependent upon phosphodiesterase (PDE)-mediated hydrolysis, comparable effects are obtained via inhibition of the cGMP-specific PDE5 with specific inhibitors, such as sildenafil and icariin.22,23 However, these PDE5-inhibitors also activate eNOS24,25 and may thereby increase SIRT1 activity and improve lipid metabolism and insulin signaling.26–28 Accordingly, our objective was to determine whether leucine could synergize with PDE5-inhibitors to increase insulin sensitivity and lipid metabolism. We tested this synergy with sildenafil as a pharmaceutical PDE5 inhibitor and icariin as a naturally occurring compound with PDE5 inhibitory activity. Since the in vitro results of both were similar, we conducted the animal study only with icariin.
Materials and methods
Animals and diets
Six-to-eight-week-old male C57/BL6 mice were purchased from Jackson Laboratories. Obesity and insulin resistance were induced via a high-fat diet (HFD) for 6 weeks. The animals were then randomized into one of the following groups with ten animals per group and kept on their diet for 6 weeks: 1) control (low-fat diet, standard diet [LabDiet 5001]); 2) HFD (60% fat; Research Diets, Inc., New Brunswick, NJ, USA), 3) HFD + leucine (24 g/kg diet; Sigma-Aldrich Co, St Louis, MO, USA), 4) HFD + leucine + icariin (25 mg/kg diet; Sigma-Aldrich Co). The leucine dose was designed to add a two-fold increase in leucine intake, as previously described.12,13 The icariin dose was selected to ensure a subtherapeutic dose that would exert no independent effect. A survey of the icariin literature indicated typical doses in the 50–200 mg/kg body weight range, with no significant effect on any variable studied at doses below 10–20 mg/kg body weight. For a 30 g mouse consuming ~3 g chow/day, this is equivalent to 100 mg icariin/kg diet. We reduced this to 25 mg/kg diet (approximately equivalent to 2.5 mg/kg body weight) to ensure no independent effect.
Animals were housed in polypropylene cages at a room temperature of 22°C with a 12-hour light/dark cycle. The animals had free access to water and their experimental food throughout the experiment. Body weight was measured every week. Blood glucose was measured in the fed or fasting state using a OneTouch Ultra Glucose Meter (LifeScan, Milpitas, CA, USA). At the end of the treatment period (6 weeks), all animals were humanely euthanized with CO2 inhalation. Blood and tissues were collected for further experiments as described below.
This study and all animal procedures were performed under the auspices of an Institutional Animal Care and Use Committee-approved protocol of the Georgia State University and in accordance with Public Health Service policy and recommendations of the Guide.
Glucose tolerance test
Mice were in a fasting state overnight (~16 hours) prior to glucose tolerance test. Basal (time 0) blood glucose was measured, the mice were then injected intraperitoneally with 1.2 g glucose/kg body weight, blood glucose was then measured 15 minutes, 30 minutes, 60 minutes, 90 minutes, and 120 minutes post-injection, and the area under the glucose response curve was calculated.
Insulin tolerance test
Food was removed for 4–6 hours prior to initiation of insulin tolerance test (ITT). Blood glucose was then measured to obtain a time 0 point, and the mice were then injected intraperitoneally with 1.0 U insulin/kg body weight in ~0.1 mL 0.9% NaCl. Blood glucose was then measured 15 minutes, 30 minutes, 60 minutes, 90 minutes, and 120 minutes post-injection, and the change in blood glucose over the linear portion of the response curve was calculated.
Liver histology
Liver tissues were fixed in 10% neutral formalin, embedded in paraffin, and cut into 5 μm sections. Sections were processed for hematoxylin and eosin staining, and histological images were recorded using Nikon Eclipse E800 Microscopy with Zeiss AxioCam camera.
Gene expression
Total RNA from liver and gastrocnemius muscle was extracted using the Tri-Reagent kit (Molecular Research Center, Cincinnati, OH, USA), and gene expression was assessed by quantitative reverse transcription-polymerase chain reaction (PCR) (ABI Universal PCR Master Mix; Thermo Fisher Scientific, Waltham, MA, USA) using a Stratagene Mx3000P thermocycler (Stratagene, La Jolla, CA, USA). The gene expression data were normalized to the house keeping gene 18s. The primer and probe sets used in the assays were purchased from Thermo Fisher Scientific (Waltham, MA, USA) and are further described in Table 1.
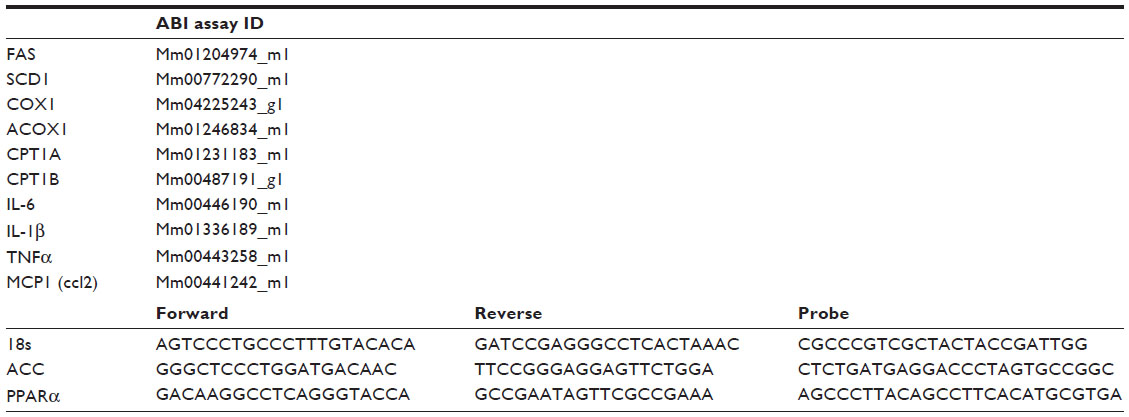 | Table 1 RT-PCR probes ID and sequences |
Plasma biochemistry
Blood was collected via tail vein, and plasma glucose and insulin were measured at the indicated time points using the glucose assay kit from Cayman Chemical (Ann Arbor, MI, USA) and an insulin enzyme linked immunosorbent assay kit from EMD Millipore (Billerica, MA, USA). Plasma C-reactive protein (CRP) levels were measured in fed mice using a mouse CRP enzyme linked immunosorbent assay kit (Life Diagnostics, West Chester, PA, USA).
Cell culture
Murine 3T3-L1 pre-adipocytes were grown in the absence of insulin in Dulbecco’s Modified Eagle’s Medium (DMEM, 25 mM glucose) containing 10% fetal bovine serum (FBS) and antibiotics (1% penicillin-streptomycin) (adipocyte medium) at 37°C in 5% CO2 in air. Confluent preadipocytes were induced to differentiate with a standard differentiation medium (DM2-L1; Zen-Bio Inc., Research Triangle Park, NC, USA). Preadipocytes were maintained in this differentiation medium for 3 days and subsequently cultured in adipocyte medium for a further 8–10 days to allow at least 90% of cells to reach full differentiation before treatment. Media was changed every 2–3 days; differentiation was determined microscopically via inclusion of fat droplets.
C2C12 myoblasts were plated at a density of 8,000 cells/cm2 (10 cm2 dish) and grown in DMEM containing 10% FBS and antibiotics at 37°C in 5% CO2. For differentiation of C2C12 cells, cells were grown to 100% confluence, transferred to differentiation medium (DMEM with 2% horse serum and 1% penicillin-streptomycin), and fed with fresh differentiation medium every day until myotubes were fully formed (3 days).
Human HepG2 cells (American Type Culture Collection HB-8065) were grown and maintained in DMEM, containing 5.5 mM glucose, 10% FBS, and antibiotics (1% penicillin-streptomycin) at 37°C in 5% CO2 in air. Medium was changed every 2–3 days, and cells were subcultured at a ratio of 1:4–1:6 upon reaching 80% confluence. Lipid accumulation was induced by incubation in 25 mM glucose for 48 hours prior to treatment.
All cells were obtained from American Type Culture Collection (ATCC, Manassas, VA, USA). Sildenafil, icariin, and leucine were obtained from Sigma-Aldrich Co.
Fatty acid oxidation
Palmitate-stimulated oxygen consumption rate was measured with an XF 24 analyzer (Seahorse Bioscience, Billerica, MA, USA) as previously described10,13 with slight modifications. Cells were seeded at 40,000 cells per well and differentiated as described above. Media was then changed, and the cells treated for 24 hours with the indicated treatments, washed twice with non-buffered carbonate-free pH 7.4 low glucose (2.5 mM) DMEM containing carnitine (0.5 mM), equilibrated with 550 μL of the same media in a non-CO2 incubator for 45 minutes, and then inserted into the instrument for 15 minutes of further equilibration, followed by O2 consumption measurement. Three successive baseline measures at 5-minute intervals were taken prior to injection of palmitate (200 μM final concentration). Four successive 5-minute measurements of O2 consumption were then conducted, followed by 10-minute re-equilibration and another three 5-minute measurements. This measurement pattern was then repeated over a 6-hour period.
Glucose utilization
In the absence of a fatty acid source and oxidative metabolism, glycolysis and subsequent lactate production results in extracellular acidification, which was also measured using a Seahorse Bioscience XF24 analyzer. Cells were prepared and equilibrated similar to the methods described above for fatty acid oxidation, with the exclusion of carnitine from the medium. Following instrument equilibration and three baseline measurements, glucose was injected to a final concentration of 10 mM in each well. Measurements were taken as described above utilizing the sensors for extracellular acidification rather than O2 consumption. Insulin (final concentration of 5 nM) was added to some wells as a positive control and to some treatment and control wells to assess treatment effects on insulin response. The area under the curve of extracellular acidification change from baseline for each sample was then calculated and used for subsequent analysis.
NO production
NO production was detected using diaminofluorescein-2 diacetate (DAF-2DA), as cell-permeable dye, which is hydrolyzed by intracellular esterases and thereby trapped within the cell as a non-fluorescent dye (DAF-2). NO converts DAF-2 to a fluorescent triazole derivative, and fluorescence (excitation at 488 nm and emission at 515 nm) is proportional to NO production. DAF-2DA was obtained from Cell Technology, Inc. (Mountain View, CA, USA), and fluorescence was measured using a microplate reader (Synergy HT; BioTek Instruments, Winooski, VT, USA). The intensity of fluorescence was expressed as arbitrary units per microgram protein.
Mitochondrial biogenesis
Mitochondrial biogenesis was assessed as change in mitochondrial mass, as previously described.12 The mitochondrial probe 10-N-nonyl-acridine orange (NAO) (Thermo Fisher Scientific, Waltham, MA, USA) was used to analyze mitochondrial mass by fluorescence (excitation 485 nm and emission 520 nm). Quantitative data were obtained with a fluorescence microplate reader (Synergy HT). The intensity of fluorescence was expressed as arbitrary units per microgram protein and normalized to control values within each assay.
Western blot
Phospho-IRS, IRS, Phospho-Akt, and Akt antibodies were obtained from Cell Signaling (Danvers, MA, USA). Protein levels of cell extracts were measured by bicinchoninic acid protein kit (Thermo Fisher Scientific). For Western blot, 15 μg protein was resolved on 10% gradient polyacrylamide gels (Criterion precast gel; Bio-Rad Laboratories Inc., Hercules, CA, USA), transferred to either polyvinylidene fluoride membranes, incubated in blocking buffer (5% non-fat dry milk in TBS) and then incubated with primary antibody (1:1,000 dilution), washed, and incubated with horseradish peroxidase- or fluorescence-conjugated secondary antibody (1:10,000 dilution). Visualization was conducted using Bio-Rad ChemiDoc instrumentation and software (Bio-Rad Laboratories) and/or band intensity was assessed using Image Lab 4.0 (Bio-Rad Laboratories), with correction for background and loading controls.
Statistical analysis
All data are expressed as mean ± standard error of the mean, with the exception of Seahorse fatty acid oxidation, which is shown as mean ± standard deviation. Data were analyzed by one-way analysis of variance, and significantly different group means (P<0.05) were separated by the least significant difference test using GraphPad Prism version 6 (GraphPad Software, Inc., La Jolla, CA, USA; http://www.graphpad.com).
Results
In vitro
We initially assessed potential synergy between leucine and PDE5-inhibitors in cell culture. Sildenafil dose–response curves showed no effects on fat oxidation or glucose utilization at concentrations below 10 nM; this is approximately 10% of the peak plasma concentration (~100 nM) achieved in response to a low dose (20 mg) of the drug in clinical application. To evaluate synergy, this dose was lowered further to 0.1 nM and 1.0 nM. Icariin dose–response curves were similar to sildenafil, so the same concentrations were utilized. While neither PDE5 inhibitor exerted an independent effect on fat oxidation, both interacted with leucine (0.5 mM) to significantly increase fat oxidation in C2C12 myotubes, 3T3-L1 adipocytes, and HepG2 hepatocytes by ~20%–30% (Figure 1). Both PDE5-inhibitors also interacted with leucine to produce modest but significant increases in NO production (15%–30%, P<0.0001, Figure 2A) and mitochondrial mass (P<0.03, Figure 2B). Sildenafil also exhibited synergy with leucine in stimulating glucose utilization in myotubes (~50%, P<0.04) and adipocytes (~300%, P<0.05) (Figure 3) and in stimulating insulin signaling in HepG2 hepatocytes (Figure 4).
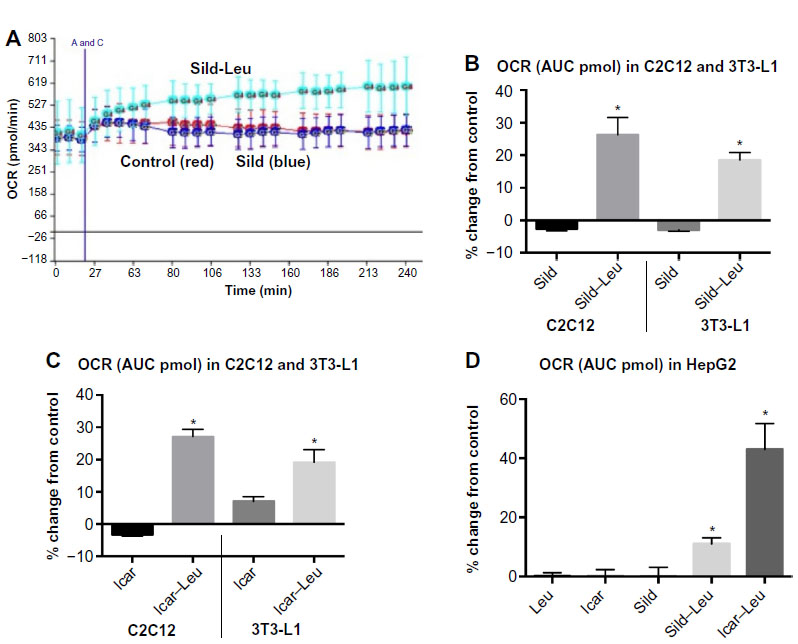 | Figure 1 PDE5-inhibitors combined with Leu increases fatty acid oxidation in vitro. |
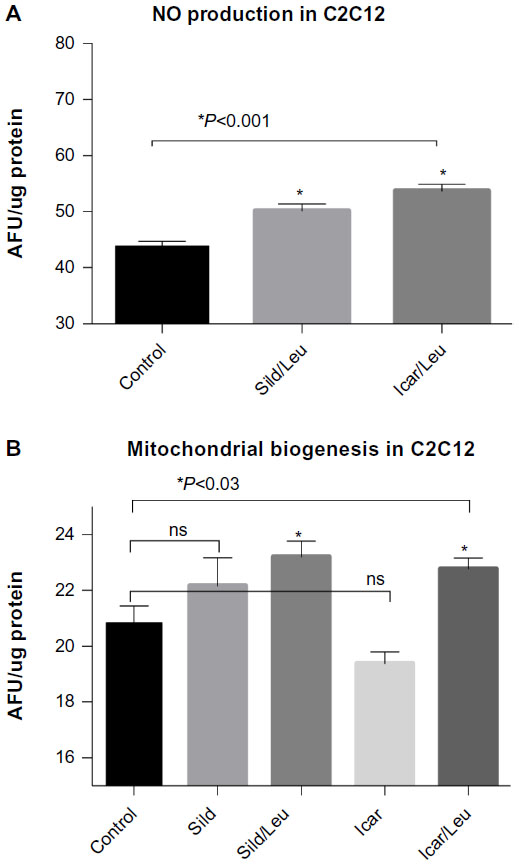 | Figure 2 PDE5-inhibitors combined with Leu increases NO production and mitochondrial biogenesis in vitro. |
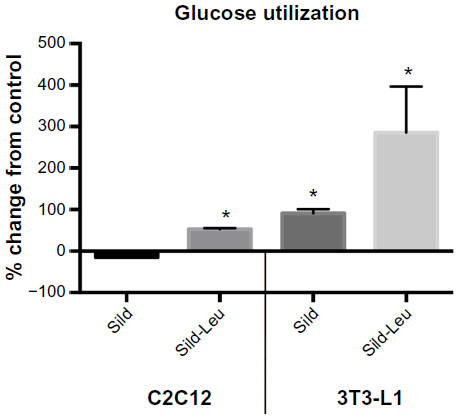 | Figure 3 PDE5-inhibitors combined with Leu increases glucose utilization in vitro. |
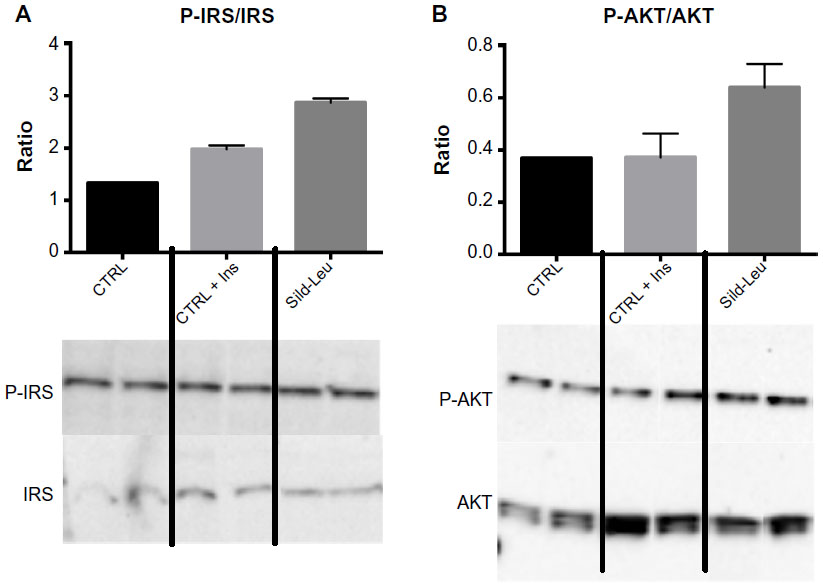 | Figure 4 PDE5-inhibitors combined with Leu increases insulin signaling in vitro. |
In vivo
Six weeks of obesity-induction via HFD caused significant weight gain compared to the low-fat diet group; however, there was no effect of the treatments on body weight during the 6-week treatment period (Figure 5). The HFD also produced significant fasting and postprandial hyperglycemia (Figure 6A and C) and hyperinsulinemia (Figure 6B and D). Addition of leucine exerted no effect on fasting or fed state glucose or on fasting insulin, although it did reduce insulin in the fasting state (Figure 6D). However, the HFD-induced hyperglycemia was significantly attenuated by the addition of leucine + icariin in both the fasting and fed states (Figure 6A and C), and the fasting insulinemia was also markedly reduced (Figure 6D).
The HFD caused a profound impairment in glucose tolerance, which was unaffected by the addition of leucine alone but markedly improved by the leucine–icariin combination (Figure 7A). This is reflected in a significant and substantial reduction in the area under the glucose tolerance curve (P<0.01, Figure 7B). The ITT demonstrates a profound blunting of the insulin response in animals on the HFD (Figure 7C). Addition of leucine alone exerted no effect on insulin tolerance, while the combination of leucine and icariin normalized the insulin response, as reflected in the ITT curve (Figure 7C) and in the 30-minute change in blood glucose (Figure 7D).
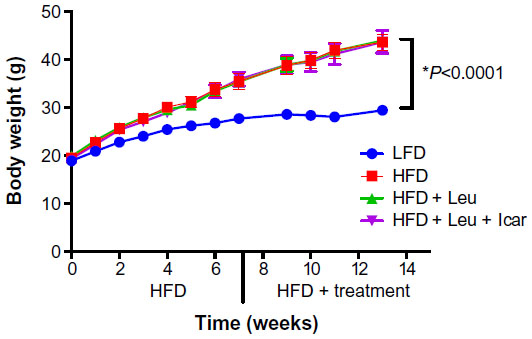 | Figure 5 Body weight measurements of the DIO-mice. |
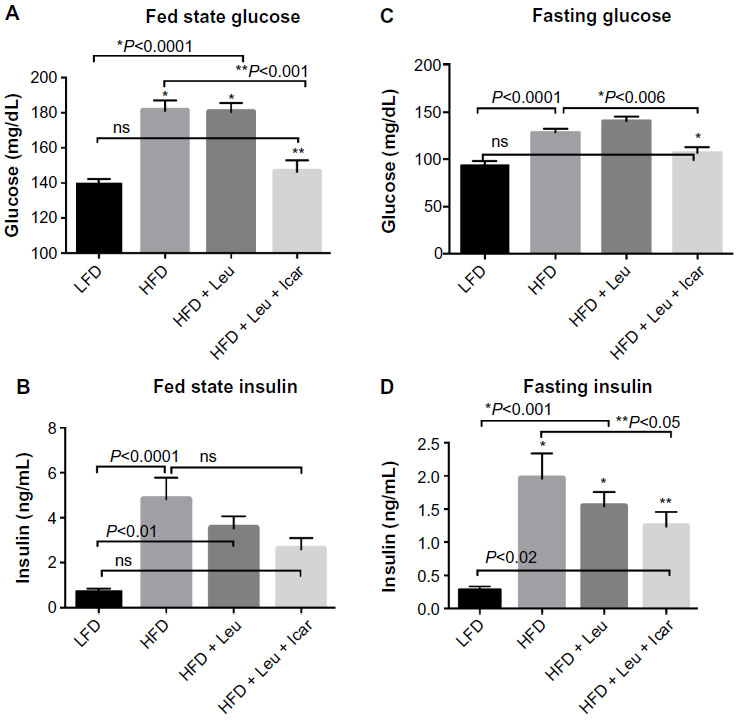 | Figure 6 Leu and Icar combination lowers plasma glucose and insulin levels in DIO-mice. |
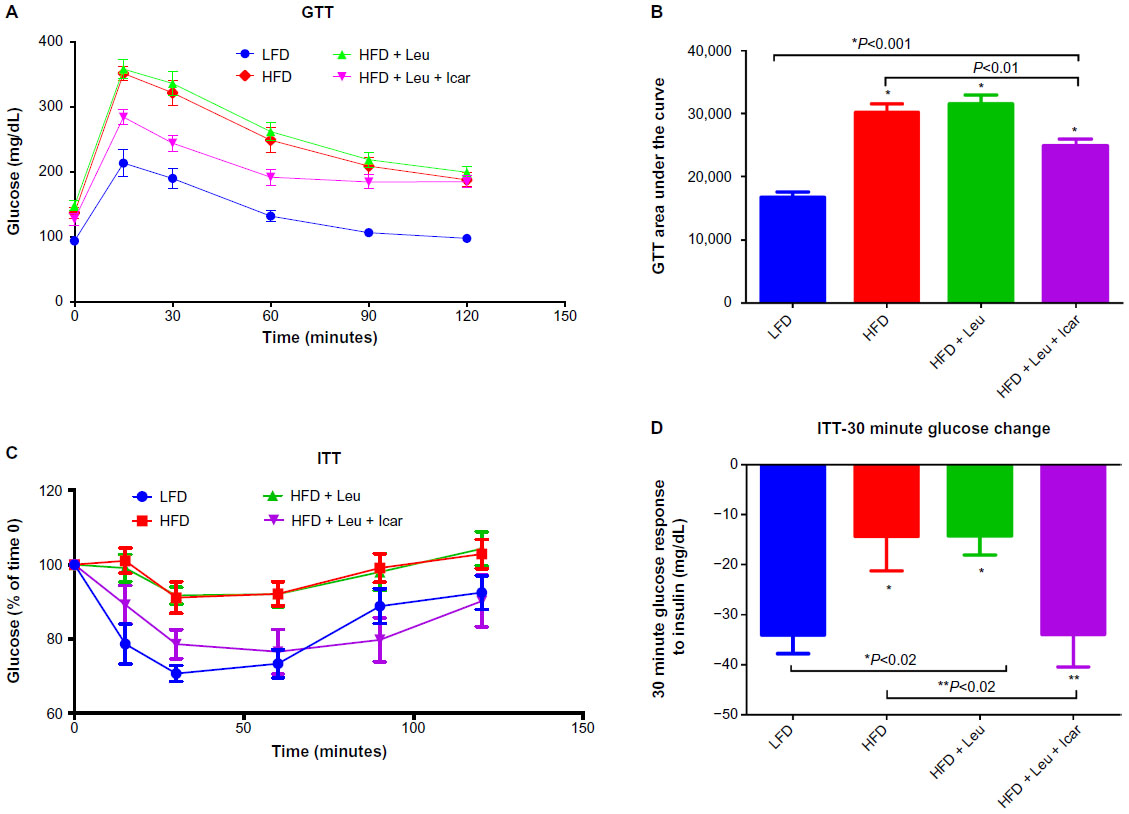 | Figure 7 Leu and Icar combination improves insulin sensitivity in DIO-mice. |
The leucine–icariin combination resulted in upregulation of fatty acid oxidation genes in skeletal muscle (Figure 8) and liver (Figure 9B) and suppression of hepatic lipogenic gene expression (Figure 9A). Moreover, the leucine–icariin combination significantly attenuated the HFD-induced increase in liver mass (Figure 10A) and completely prevented the HFD-induced hepatic lipid accumulation, as shown in the liver histology (Figure 10B). The leucine–icariin combination also suppressed hepatic inflammation, as shown by the reduction in hepatic inflammatory genes expression (Figure 11).
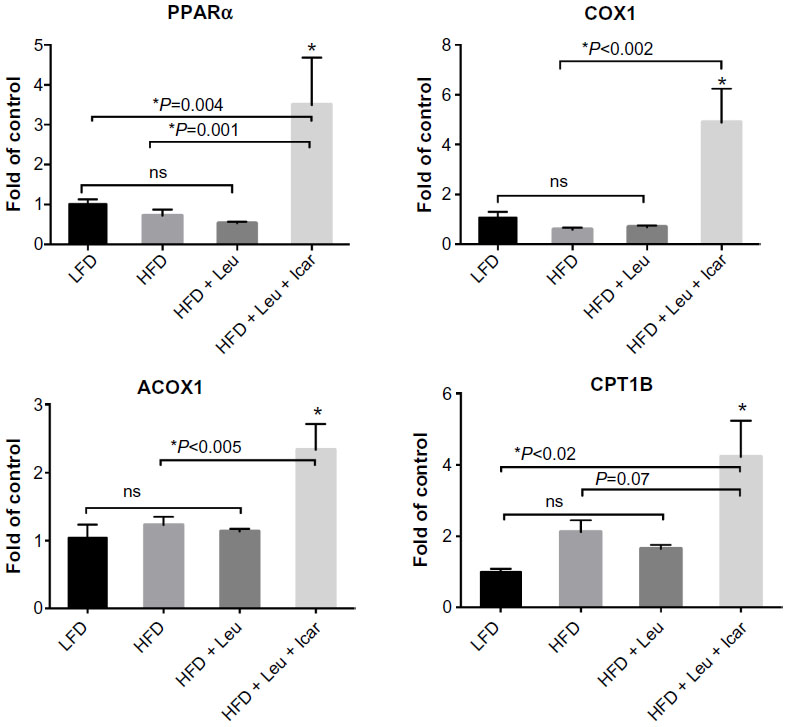 | Figure 8 Leu and Icar combination promotes muscle fatty acid oxidation in DIO-mice. |
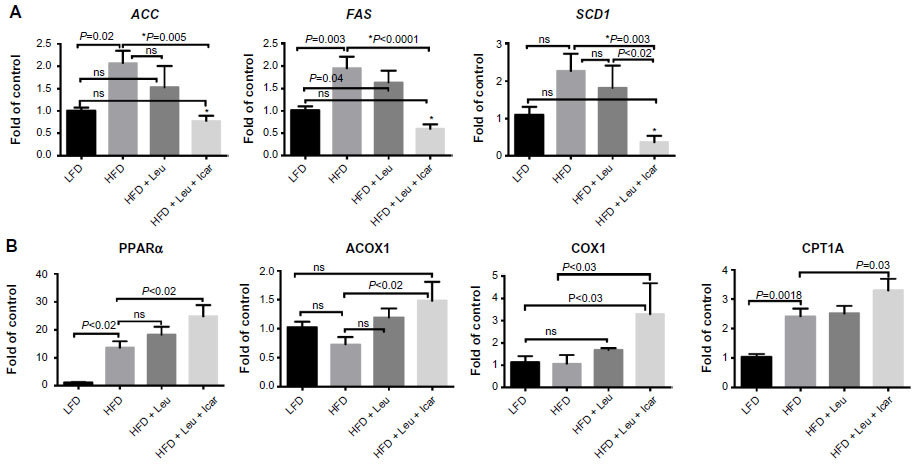 | Figure 9 Leu and Icar combination inhibits hepatic lipogenesis and promotes hepatic fatty acid oxidation in DIO-mice. |
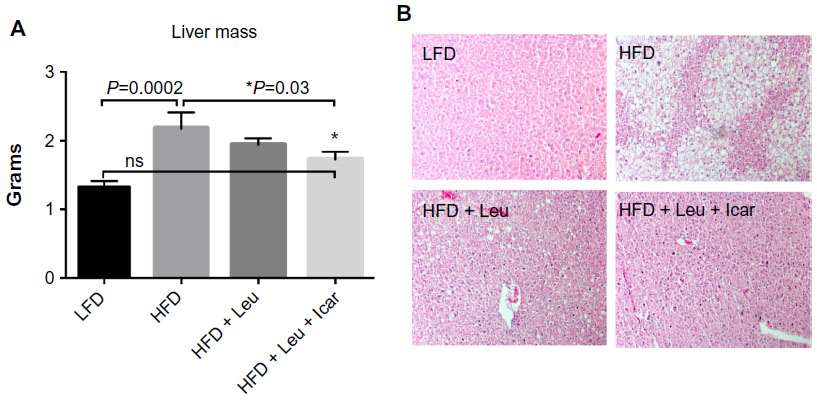 | Figure 10 Leu and Icar combination prevents hepatic steatosis in DIO-mice. |
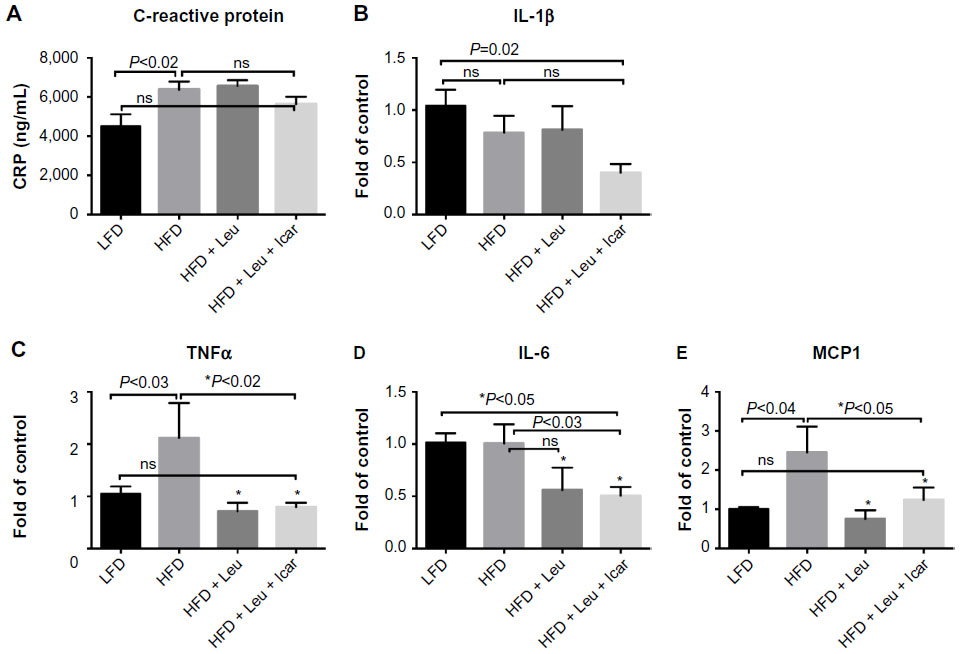 | Figure 11 Leu and Icar combination suppresses inflammation in liver of DIO-mice. |
Discussion
These data indicate that the combination of leucine with PDE5 inhibition shifts lipid metabolism from storage to oxidation, improves glycemic control, and reverses the hepatic steatosis induced by high-fat feeding. These effects are similar to those induced by caloric restriction29–34 and are likely to be mediated by the same pathways, including SIRT1 activation.
Obesity and insulin resistance result in impaired NO signaling,35,36 while PDE5-inhibitors, including sildenafil and tadalafil, have been demonstrated to increase SIRT1 signaling in mice,26,27 to increase energy expenditure in skeletal muscle cells,37 to improve energy balance, and to increase insulin action in both diet-induced obese (DIO), insulin-resistant mice and diabetic patients.28,38 This may be, in part, due to stimulation of eNOS and NO signaling24,25 and subsequent NO-mediated SIRT1 activation.26–28
Since leucine activation of SIRT1 results in significant augmentation of the effects of other compounds that converge on this signaling pathway,10–13 we considered the potential for leucine to amplify the effects of PDE5-inhibitors. We found leucine to exhibit synergy with subtherapeutic levels of both sildenafil and icariin in stimulating fat oxidation in skeletal muscle cells, adipocytes, and hepatocytes, as well as in stimulating glucose utilization. Moreover, leucine–sildenafil and leucine–icariin combinations increased NO production, possibly due to a combination of direct activation of eNOS by the PDE5-inhibitors and indirect eNOS activation by both SIRT1 and AMPK. This suggests a three-way interaction among SIRT1, AMPK, and NO in mediating the observed effects, as illustrated in Figure 12. Leucine activation of SIRT1 results in downstream activation of AMPK,11 while AMPK in turn activates SIRT1 via phosphorylation of NAMPT to regenerate the SIRT1 activator NAD+.39 Both AMPK and SIRT1, in turn, activate eNOS via phosphorylation20,21 and deacetylation,18,19 respectively. The increased NO, in turn, may stimulate SIRT1 activity,16,17 resulting in a three-component feed-forward loop.
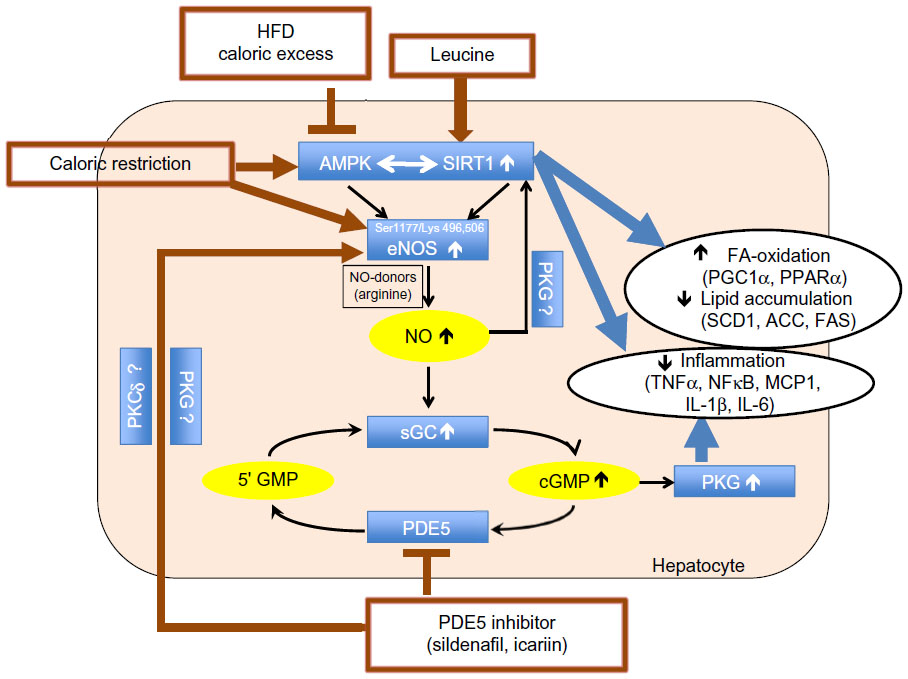 | Figure 12 Summary of the three-way interaction among AMPK, SIRT1, and eNOS. |
Data from the mice in the present study are consistent with such a multi-component activation. The leucine–icariin combination resulted in significant improvements in glycemic control and insulin sensitivity, upregulated fatty acid oxidation, and downregulated lipogenic markers, consistent with SIRT1–AMPK activation, while the attenuation of hepatic lipid accumulation and inflammatory markers may be mediated, in part, by both SIRT1 and NO. Reductions in SIRT1 activity increases steatosis in response to dietary fat in SIRT1+/− mice,40 while SIRT1 activation in DIO-mice results in amelioration of hepatic steatosis.15,41,42 On the other hand, diet-induced obesity and insulin resistance suppress hepatic eNOS activity prior to the induction of hepatic inflammation, while increasing NO signaling with sildenafil restored hepatic insulin signaling and prevented dietary fat-induced nuclear factor-kappaB (NFκB)-mediated hepatic inflammation.43 The combination of leucine and icariin in the present study resulted in reversal of histological evidence of dietary fat-induced hepatic steatosis and normalization of dietary fat-induced hepatic TNFα, interleukin 6 (IL-6), and MCP1 expression and circulating CRP, as well as ~50% reduction in interleukin-1 beta (IL-1β) expression. Thus, our data are consistent with a combination of SIRT1 and NO signaling, with cross-talk between the two pathways. However, a portion of these effects are likely also mediated via the classically established mode of PDE5 inhibitor action, mediated by extending the duration of cGMP signaling as well as NO stimulation of cGMP production via NO-sensitive guanylyl cyclase (Figure 12), resulting in enhanced cGMP-dependent PKG signaling.22 This further contributes to improvements in insulin sensitivity28,44 as well as reductions in hepatic steatosis and NFκB-mediated inflammation.36,43,44
Chronic treatment with the PDE5 inhibitor sildenafil has been reported to reduce weight gain in HFD-fed mice.28 In contrast, we found no effects of our treatments on body weight (Figure 5). However, we used a much lower dose of PDE inhibitor (~2.5 mg/kg body weight in our study vs 12 mg/kg BW) and a shorter treatment time (6 weeks in our study vs 12 weeks). Moreover, Ayala et al,28 used a prevention approach by starting the sildenafil treatment concomitantly with beginning of HFD feeding, while in our study, the treatment was added to the HFD after obesity-induction.
In summary, subtherapeutic doses of PDE5-inhibitors combined with leucine result in activation of fatty acid oxidation, marked improvement in insulin sensitivity, and reversal of hepatic steatosis and inflammation in DIO-mice. We conclude that this combination may have therapeutic potential for treatment of both non-alcoholic steatohepatitis and type 2 diabetes.
Acknowledgment
This work was supported by NuSirt Biopharma Inc.
Author contributions
All authors contributed toward data analysis, drafting and revising the paper and agree to be accountable for all aspects of the work.
Disclosure
The authors Antje Bruckbauer and Michael B Zemel are employees and stockholders of NuSirt Biopharma, Inc. All other authors declare that they have no conflicts of interest.
References
Cantó C, Auwerx J. PGC-1alpha, SIRT1 and AMPK, an energy sensing network that controls energy expenditure. Curr Opin Lipidol. 2009;20(2):98–105. | |
Gomes AP, Price NL, Ling AJ, et al. Declining NAD(+) induces a pseudohypoxic state disrupting nuclear-mitochondrial communication during aging. Cell. 2013;155(7):1624–1638. | |
Price NL, Gomes AP, Ling AJ, et al. SIRT1 is required for AMPK activation and the beneficial effects of resveratrol on mitochondrial function. Cell Metab. 2012;15:675–690. | |
Gowans GJ, Hawley SA, Ross FA, Hardie DG. AMP is a true physiological regulator of AMP-activated protein kinase by both allosteric activation and enhancing net phosphorylation. Cell Metab. 2013;18(4): 556–566. | |
Jäger S, Handschin C, St-Pierre J, Spiegelman BM. AMP-activated protein kinase (AMPK) action in skeletal muscle via direct phosphorylation of PGC-1alpha. Proc Natl Acad Sci U S A. 2007;104(29): 12017–12022. | |
Brenmoehl J, Hoe A. Dual control of mitochondrial biogenesis by sirtuin 1 and sirtuin 3. Mitochondrion. 2013;13:755–761. | |
Coughlan KA, Valentine RJ, Ruderman NB, Saha AK. AMPK activation: a therapeutic target for type 2 diabetes? Diabetes Metab Syndr Obes. 2014;7:241–253. | |
Pfluger PT, Herranz D, Velasco-miguel S, Serrano M, Tscho MH. Sirt1 protects against high-fat diet-induced metabolic damage. PNAS. 2008;105(28):9793–9798. | |
Milne JC, Lambert PD, Schenk S, et al. Small molecule activators of SIRT1 as therapeutics for the treatment of type 2 diabetes. Nature. 2007;450(7170):712–716. | |
Bruckbauer A, Zemel MB. Synergistic effects of polyphenols and methylxanthines with leucine on AMPK/Sirtuin-mediated metabolism in muscle cells and adipocytes. PLoS One. 2014;9(2):e89166. | |
Liang C, Curry BJ, Brown PL, Zemel MB. Leucine modulates mitochondrial biogenesis and SIRT1-AMPK signaling in C2C12 myotubes. J Nutr Metab. 2014;2014:239750. | |
Bruckbauer A, Zemel MB, Thorpe T, et al. Synergistic effects of leucine and resveratrol on insulin sensitivity and fat metabolism in adipocytes and mice. Nutr Metab (Lond). 2012;9(1):77. | |
Bruckbauer A, Zemel MB. Synergistic effects of metformin, resveratrol, and hydroxymethylbutyrate on insulin sensitivity. Diabetes Metab Syndr Obes. 2013;6:93–102. | |
Xue B, Fu L, Li F, et al. Leucine amplifies the effects of metformin on insulin sensitivity and glycemic. Diabetes. 2014;63(Suppl 1):A288. | |
Shi H, Fu L, Li F, et al. Synergy between metformin and leucine in sirtuin signaling and fat oxidation in vitro, and in reducing lipid accumulation in diet-induced obese mice. Diabetes. 2014;63(Suppl 1): A463. | |
Nisoli E, Tonello C, Cardile A, et al. Calorie restriction promotes mitochondrial biogenesis by inducing the expression of eNOS. Science. 2005;310(5746):314–317. | |
Shinmura K, Tamaki K, Bolli R. Impact of 6-mo caloric restriction on myocardial ischemic tolerance: possible involvement of nitric oxide-dependent increase in nuclear Sirt1. Am J Physiol Heart Circ Physiol. 2008;295(6):H2348–H2355. | |
Mattagajasingh I, Kim CS, Naqvi A, et al. SIRT1 promotes endothelium-dependent vascular relaxation by activating endothelial nitric oxide synthase. Proc Natl Acad Sci U S A. 2007;104(37):14855–14860. | |
Spallotta F, Cencioni C, Straino S, et al. A nitric oxide-dependent cross-talk between class I and III histone deacetylases accelerates skin repair. J Biol Chem. 2013;288(16):11004–11012. | |
Chen ZP, Mitchelhill KI, Michell BJ, et al. AMP-activated protein kinase phosphorylation of endothelial NO synthase. FEBS Lett. 1999;443:285–289. | |
Zhang Y, Lee TS, Kolb EM, et al. AMP-activated protein kinase is involved in endothelial NO synthase activation in response to shear stress. Arterioscler Thromb Vasc Biol. 2006;26:1281–1287. | |
Francis SH, Busch JL, Corbin JD, Sibley D. cGMP-dependent protein kinases and cGMP phosphodiesterases in nitric oxide and cGMP action. Pharmacol Rev. 2010;62(3):525–563. | |
Schluesener JK, Schluesener H. Plant polyphenols in the treatment of age-associated diseases: revealing the pleiotropic effects of icariin by network analysis. Mol Nutr Food Res. 2014;58(1):49–60. | |
Musicki B, Bivalacqua TJ, Champion HC, Burnett AL. Sildenafil promotes eNOS activation and inhibits NADPH oxidase in the transgenic sickle cell mouse penis. J Sex Med. 2014;11(2):424–430. | |
Das A, Xi L, Kukreja RC. Phosphodiesterase-5 inhibitor sildenafil preconditions adult cardiac myocytes against necrosis and apoptosis. Essential role of nitric oxide signaling. J Biol Chem. 2005;280(13): 12944–12955. | |
Shalwala M, Zhu S-G, Das A, Salloum FN, Xi L, Kukreja RC. Sirtuin 1 (SIRT1) activation mediates sildenafil induced delayed cardioprotection against ischemia-reperfusion injury in mice. PLoS One. 2014;9(1): e86977. | |
Koka S, Aluri HS, Xi L, Lesnefsky EJ, Kukreja RC. Chronic inhibition of phosphodiesterase 5 with tadalafil attenuates mitochondrial dysfunction in type 2 diabetic hearts: potential role of NO/SIRT1/PGC-1α signaling. Am J Physiol Heart Circ Physiol. 2014;306(11):H1558–H1568. | |
Ayala J, Bracy D, Julien B. Chronic treatment with sildenafil improves energy balance and insulin action in high fat-fed conscious mice. Diabetes. 2007;56(4):1025–1033. | |
Colman RJ, Beasley TM, Kemnitz JW, Johnson SC, Weindruch R, Anderson RM. Caloric restriction reduces age-related and all-cause mortality in rhesus monkeys. Nat Commun. 2014;5:3557. | |
Colman RJ, Anderson RM, Johnson SC, et al. Caloric restriction delays disease onset and mortality in rhesus monkeys. Science. 2009; 325(5937):201–204. | |
Jové M, Naudí A, Ramírez-Núñez O, et al. Caloric restriction reveals a metabolomic and lipidomic signature in liver of male mice. Aging Cell. 2014;13:1–10. | |
Mitchell SJ, Martin-Montalvo A, Mercken EM, et al. The SIRT1 activator SRT1720 extends lifespan and improves health of mice fed a standard diet. Cell Rep. 2014;6(5):836–843. | |
Mercken EM, Hu J, Krzysik-Walker S, et al. SIRT1 but not its increased expression is essential for lifespan extension in caloric-restricted mice. Aging Cell. 2014;13(1):193–196. | |
Chang H-C, Guarente L. SIRT1 and other sirtuins in metabolism. Trends Endocrinol Metab. 2014;25(3):138–145. | |
Kim F, Pham M, Maloney E, et al. Vascular inflammation, insulin resistance, and reduced nitric oxide production precede the onset of peripheral insulin resistance. Arterioscler Thromb Vasc Biol. 2008;28(11): 1982–1988. | |
Handa P, Tateya S, Rizzo NO, et al. Reduced vascular nitric oxide-cGMP signaling contributes to adipose tissue inflammation during high-fat feeding. Arterioscler Thromb Vasc Biol. 2011;31(12):2827–2835. | |
Sabatini S, Sgrò P, Duranti G, Ceci R, Di Luigi L. Tadalafil alters energy metabolism in C2C12 skeletal muscle cells. Acta Biochim Pol. 2011;58(2):237–241. | |
Jansson PA, Murdolo G, Sjögren L, et al. Tadalafil increases muscle capillary recruitment and forearm glucose uptake in women with type 2 diabetes. Diabetologica. 2010;53(10):2205–2208. | |
Imai S, Guarente L. Ten years of NAD-dependent SIR2 family deacetylases: implications for metabolic diseases. Trends Pharmacol Sci. 2010;31(5):212–220. | |
Xu F, Gao Z, Zhang J, et al. Lack of SIRT1 (Mammalian Sirtuin 1) activity leads to liver steatosis in the SIRT1+/− mice: a role of lipid mobilization and inflammation. Endocrinology. 2010;151(6):2504–2514. | |
Xu F, Li Z, Zheng X, et al. Sirt1 mediates the effect of GLP-1 receptor agonist exenatide on ameliorating hepatic steatosis. Diabetes. 2014;63(11):3637–3646. | |
Lee J, Hong SW, Chae SW, et al. Exendin-4 improves steatohepatitis by increasing Sirt1 expression in high-fat diet-induced obese C57BL/6J mice. PLoS One. 2012;7(2):e31394. | |
Tateya S, Rizzo NO, Handa P, et al. Endothelial NO/cGMP/VASP signaling attenuates Kupffer cell activation and hepatic insulin resistance induced by high-fat feeding. Diabetes. 2011;60(11):2792–2801. | |
Rizzo NO, Maloney E, Pham M, et al. Reduced NO–cGMP signaling contributes to vascular inflammation and insulin resistance induced by high-fat feeding. Arterioscler Thromb Vasc Biol. 2010;30(4): 758–765. |
 © 2015 The Author(s). This work is published and licensed by Dove Medical Press Limited. The
full terms of this license are available at https://www.dovepress.com/terms
and incorporate the Creative Commons Attribution
- Non Commercial (unported, 3.0) License.
By accessing the work you hereby accept the Terms. Non-commercial uses of the work are permitted
without any further permission from Dove Medical Press Limited, provided the work is properly
attributed. For permission for commercial use of this work, please see paragraphs 4.2 and 5 of our Terms.
© 2015 The Author(s). This work is published and licensed by Dove Medical Press Limited. The
full terms of this license are available at https://www.dovepress.com/terms
and incorporate the Creative Commons Attribution
- Non Commercial (unported, 3.0) License.
By accessing the work you hereby accept the Terms. Non-commercial uses of the work are permitted
without any further permission from Dove Medical Press Limited, provided the work is properly
attributed. For permission for commercial use of this work, please see paragraphs 4.2 and 5 of our Terms.