Back to Journals » Medical Devices: Evidence and Research » Volume 12
Injection And Infusion Technology Disruption For Use In MRI
Authors Kalmar M ![]() , Boese A
, Boese A ![]() , Landes R
, Landes R ![]() , Friebe M
, Friebe M ![]()
Received 23 May 2019
Accepted for publication 18 September 2019
Published 28 November 2019 Volume 2019:12 Pages 469—478
DOI https://doi.org/10.2147/MDER.S216758
Checked for plagiarism Yes
Review by Single anonymous peer review
Peer reviewer comments 2
Editor who approved publication: Dr Scott Fraser
M Kalmar, A Boese, R Landes, M Friebe
Intelligente Katheter INKA, Otto-Von-Guericke University Magdeburg, Magdeburg, Germany
Correspondence: M Kalmar
Intelligente Katheter INKA, Otto-von-Guericke University Magdeburg, Universitaetsplatz 2, Magdeburg 39106, Germany
Tel +49-391-67 57025
Email [email protected]
Introduction: Contrast media injections, infusions, or experiments that require a constant volume flow close to or within a very high magnetic field like in magnetic resonance imaging (MRI) require a liquid reservoir and a power unit to deliver the fluid. However, most power units are driven by motors that are either not MRI-compatible or require external connections that restrict mobility and usage. In this paper, the development of a highly portable, lightweight, and MRI-compatible pump system is explained.
Methods: The energy required to deliver the flow is generated using a pressurized bottle concept. The valve inside the bottle is opened to create a flow which should be maintained constant. In order to find the optimal flow resistance for a constant flow rate, we created multiple setups with different flow resistance.
Results: We measured the flow rates for different flow resistances by attaching a restring valve to the bottle. The results clearly show that high flow resistance results in lower and more constant flow rate.
Discussion: The optimal flow rate achieved using our current setup was significantly constant but not ideal. Consequently, such a pump system can be used in many medical applications like MRI-compatible contrast agent injectors.
Keywords: MRI-compatible, pump system, pressure, fluid, constant flowrate, injection, infusion
Introduction
MRI used for regular clinical applications typically employ a permanent or superconductive magnet system with a field strength of 0.2 T to 3.0 T. Electrical and metallic components can be damaged by the strong magnetic field, are potentially dangerous for the patient inside the magnet opening, and can also negatively influence the MRI performance.1
Equipment used in imaging modalities like Computed Tomography (CT) or X-Ray can therefore not automatically be used inside an MRI. Due to the strong magnetic field, it has to be compatible to the MRI system operation (= MR COMPATIBLE = no negative influence for system and patient) or at least safe with respect to the patient (= MR SAFE).2–4 MRI-compatible tools are increasingly used to support the MRI imaging or therapies performed in the MRI room. For certain clinical questions – especially for oncology imaging – it is sometimes necessary to create a constant flow of a liquid, for example contrast media that enhances certain structures, which leads to improved diagnosis.5,6
For that, an MR contrast agent is injected with a certain flow rate (e.g. 2 mL/s) and volume depending on the patient’s weight (e.g. 0.1–0.3 mL/kg for Gadovist.7,8 To ensure a constant flow and standardized clinical process electromechanical injection systems are used.9
Existing contrast agent injectors are not completely MRI compatible due to the use of electric components and ferromagnetic materials. Even the newest generation injectors need to be placed in an adequate distance (between 1 m and 2.5 m to the opening) to avoid being pulled into the bore due to the exponentially increasing magnetic attraction forces.4 The distance between the injector head and the patient's arm inside the tomograph needs to be bridged by long tubes and consequently, the air release is more complicated, the time of setup is longer, and more liquid is needed for the injection. Another disadvantage of the existing devices is the energy supply.10 There is either a power cable required, a battery unit installed, or hydraulic/pneumatic connections needed. This increases the initial setup time, limits the mobility of the devices and makes it difficult to obtain the level of full MRI compatibility.
The goal of this work was to rethink the current technological setup and to develop a system that is fully MRI compatible, while reducing the complexity and cost of the device dramatically. The clinical specifications are a constant flow-rate of 2 mL/s, with a maximum volume of 30 mL contrast media (for a 150 kg patient), easy air release, remote Start/Stop, and a continuous low flow-rate infusion of saline to prevent a vessel closure, which can be operated independent of an external power supply. To avoid long tubing, it should also be possible to place the system inside of the bore of the MRI, which would reduce the setup time and ease the workflow.
State Of The Art
Different pump principles are used inside of the MRI cabin. All of them have their advantages and disadvantages shown in the next section. Something all technological principles have in common is the law of Poiseuille.
The flow depends on the radius (1) and length
  of the tube, pressure difference
  and the viscosity of the fluid
  itself.11

Formula (1) shows that the longer the tube is, the higher the pressure difference needs to be to keep the same flow rate. Not included in this equation is the flow resistance of the surface inside the tubes and the friction between connected parts.
Piston Pump
Here, fluid is pumped through the connected tubes by the movement of a piston (Figure 1). The flow rate inside of the tubes is – Formula 1 – depending on the ratio of the cross-section of piston (2) to the cross-section of tube
  . The larger the difference of the cross-sections is, the more the flow rate
  is increased by a constant speed of the piston
  . The piston is moved by the force of a drive motor
  , which is normally not fully MRI-compatible and therefore needs to be positioned in a distance to the bore.10 The piston pump can be either prefilled with the fluid or can be filled with the help of a valve system and the suction that is created by moving the piston back.12

 |
Figure 1 Working principle of a piston pump. |
Roller Pump
The roller pump delivers the fluid directly out of a reservoir. A tube is getting constantly compressed by a rotating pressure wheel.13 The rotation movement (3) presses the fluid forward
  (Figure 2 and Formula 3) inside the tube.14

 |
Figure 2 Working principle of a roller pump. |
The rotation of the pressure wheel is caused by a motor that is normally not fully MRI compatible. Similar to the piston pump the flow of the roller pump has a sinusoidal course.
Pneumatic Or Hydraulic Pump
Like the piston pump, the pneumatic/hydraulic pump has a piston pushing the liquid through the tubes. The difference between both principles is the impulsion. Unlike the piston pump, the piston of the pneumatic/hydraulic pump is not operated by a motor, but through air or liquid pressure.15 This pressure can be created through a pump outside of the MRI-room or directly manually with a hand pump16,17 (Figure 3). Depending on the pressure, the flow rate is changing (Formula 1).
 |
Figure 3 Working principle of a pneumatic hand pump. |
Table 1 is showing the main advantages and disadvantages of the different pump principles. The precision and setting options of the piston and roller pumps are superior to a pneumatic pump and equal to a hydraulic pump, which also is fully MRI-compatible.
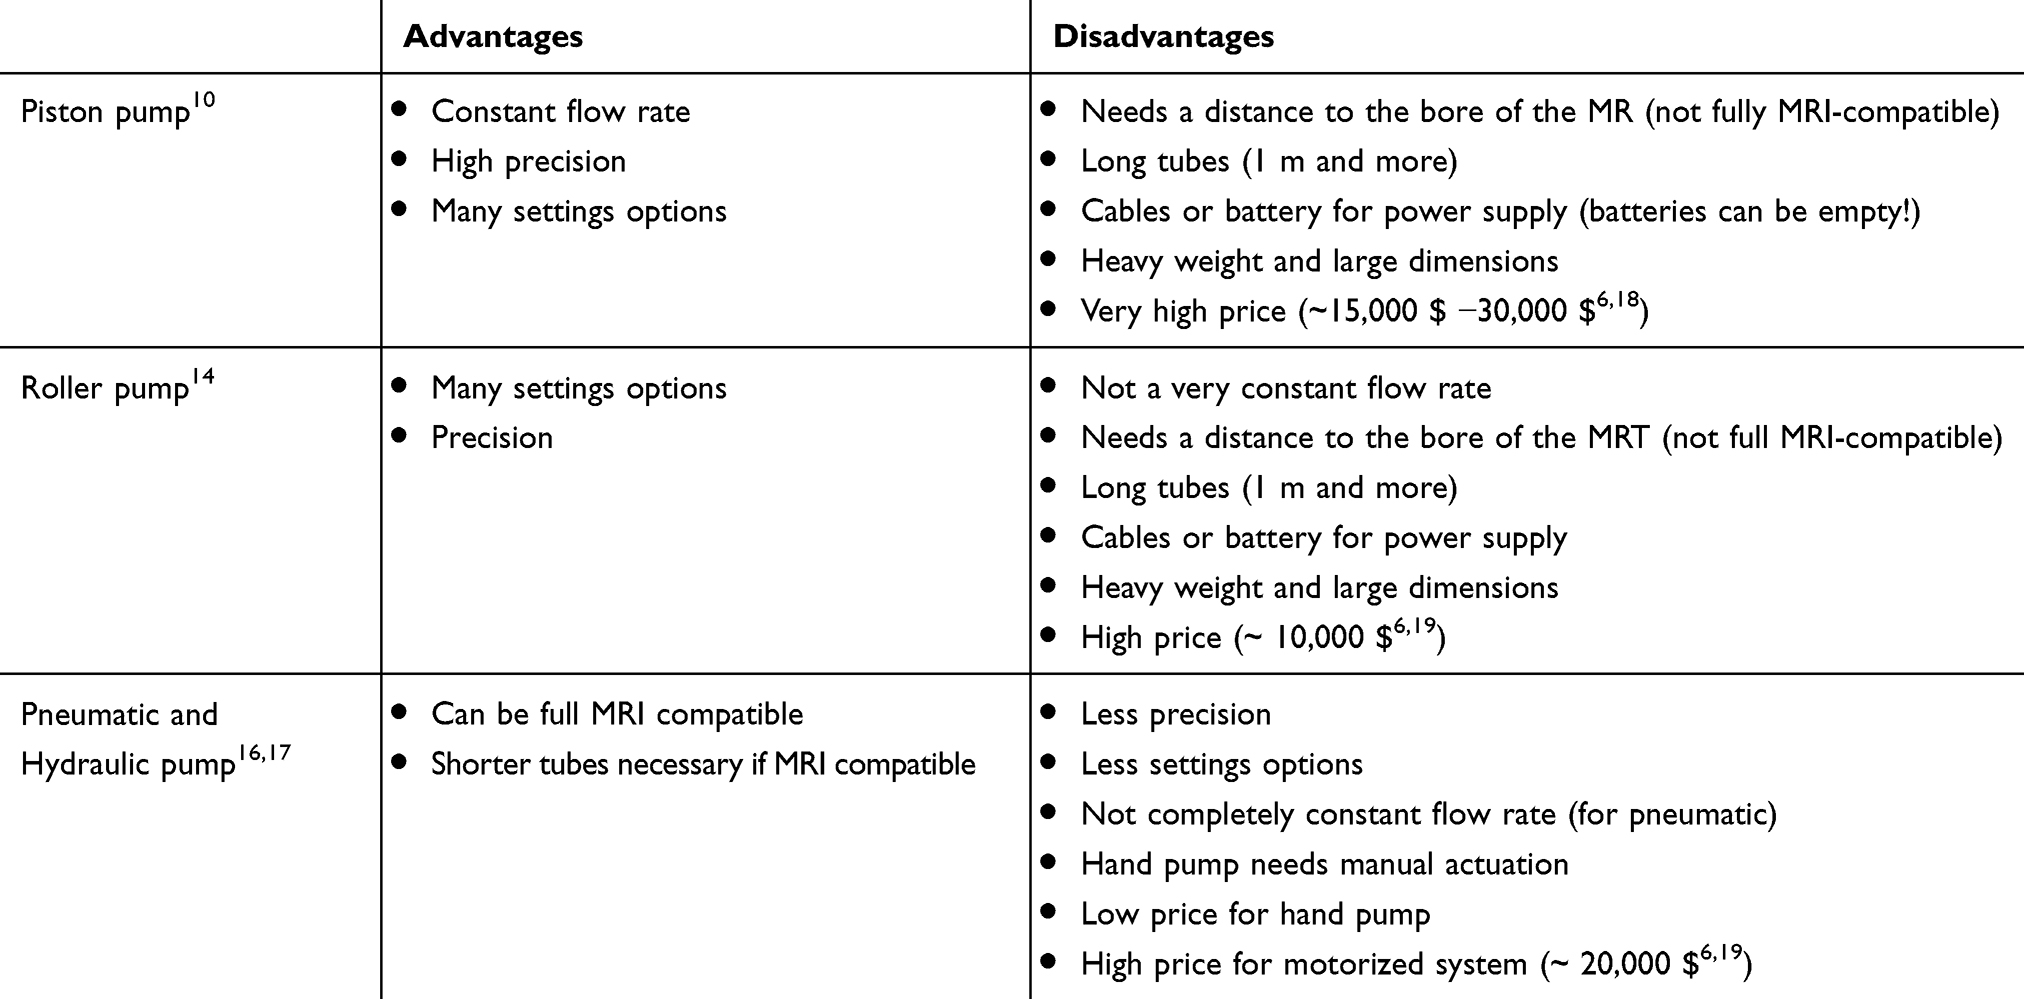 |
Table 1 Comparison Of The Pump Principles For MRI |
One of the biggest disadvantages of pumps with motors are the required energy supply and the associated connections and the ferromagnetic components. A possible solution for an MRI-compatible pump system could be to have a pneumatic pump with stored energy in the form of a high-pressure gradient. The needed pressure to transport the liquid can be released via a valve. In this case, the flow rate would not have to be controlled by a motor but by flow resistor, for example, a throttle. The volume to be delivered can thus be stored directly in the vicinity or in the MRI bore itself since no magnetic components are used. A potential application would be, for example, a contrast agent injector. Although this simple principle reduces the adjustment possibilities very likely and also the costs incurred for this type of pump.
Materials And Methods
Bag-On-Valve-Bottle
For a possible alternative, a fully MRI-compatible pump system with a constant flow rate, a polyethylene terephthalate (PET) bottle with a Bag-on-valve (BOV) system was tested. The BOV system is saving the pump energy in terms of pressure. Inside of the bottle is a plastic bag filled with the liquid. If the valve opens, the high pressure around the bag is pushing the liquid out of the bottle.20,21 Table 2 shows the important specifications of the bottles used in this work. Figure 4 presents the principle of an open and locked valve. If the closing mechanism of the valve is pressed down the liquid escapes from the bottle due to the pressure gradient. If the activation force is too low, the spring is pressing the closing mechanism up and with that closes the valve.
 |
Figure 4 Valve mechanism of a BOV-bottle. |
The information given in Table 2 can be used to calculate the resulting pressure when the bag is empty.
(4)


The ideal gas equation (formula 4) switched to  yields:
Theoretical Effect Of Length And Diameter Of A Throttle On The Flow
The pressure drop within a system depends on several factors. The following section will explain which of these factors allow to adjust the flow rate quickly. It is assumed that all components in this system are the same except the throttle that can be varied in length and diameter.
Reynold number
To calculate the flow, it is important to know whether the flow is laminar or turbulent, which has influence on the flow resistance. The Reynolds number ( (5) ) can be used to determine the type of flow inside of each component.


The mean flow velocity ( (6) ) can be calculated:

Inserting formula (6) in formula (5) gives:
(7)
For simplicity, the flow resistance of the other components can be assumed to be constant since the throttle is the only component that changes. Thus, it only needs to be determined if the flow within the throttle is laminar or turbulent. For such a determination, it is verified whether the Reynolds number within the created throttles exceeds the critical Reynolds number. The smallest diameter of a throttle planned for the measurement is 0.1 mm and the largest is 0.6 mm.


Both calculated Reynolds numbers show that the critical Reynolds number of 2320 is exceeded for a flow rate of 2 mL/s for all throttles. The flow within the throttle can be assumed to be turbulent. In case of a turbulent flow, the pressure drop is calculated according to the Darcy-Weisbach-equation.
For a correct representation of the pressure drop in relation to the volume flow, the flow in the range shown must be permanently turbulent. Thus, for the different diameters, the minimum permissible volume flow can be calculated with which the critical Reynolds number is still exceeded. For this, equation (7) is changed according to the volume flow  and the critical Reynolds number
  is used for
  .
.

Pressure drop according to Darcy Weisbach23
The pressure drops after Darcy–Weisbach results from three sections. Before and after the throttle, a certain pressure drops at the respective diffusers. The throttle itself can be considered as a tube with a pressure drop over the length.
(8)


Formula (6) inserted in formula (8) gives:

The pipe friction factor  depends on the Reynolds number Re, the pipe diameter D and average roughness
  . Based on the Moody diagram Figure 5, the respective friction factor can be determinate. In our example, we assume that the 3D printed throttle is made from resin with an average roughness of 0.0015 mm (plastic24).
 |
Figure 5 Moody diagram of friction factor for pipe flow.24Note: Copyright ©2011. Reproduced from McGovern J. Technical Note: Friction Factor Diagrams for Pipe Flow. 2011. Available from: http://arrow.dit.ie/engschmecart/28/.24 |
In general, the dropping pressure is given by equation (9):
(9)
The loss factor  as well as the flow rate
  will vary depending on the type of the diffuser. Due to the abrupt transition at the diffusers, a step diffuser can be assumed for both.
Cross-Sectional Narrowing Diffuser

For a cross-sectional narrowing step diffuser, the flow rate refers to the second diameter. Formula (10) and (6) inserted into formula (9) gives:


Cross-Sectional Widening Diffuser
 For a cross-sectional widening step diffuser, the flow rate refers to the first diameter. Formula (11) and (6) inserted into formula (9) gives:


Combination Of Tube And Diffuser Section
For the total pressure drop on the throttle, all pressure drops can be added.
(12)


Measurements Of The Needed Force To Open The Valve Of The BOV-Bottle And The Resulting Flow Rate
To use a BOV-bottle as a drive mechanism in an MRI, it must fulfill certain requirements. The following questions must be answered:
- Which force is required to open the valve of the BOV-bottle?
- What is the flow rate and how can it be regulated?
- How does the flow rate behave over time?
- Can the bottle be used inside of an MRI?
Force To Open The Valve
To measure the force required to open the valve, an adapter was designed following the model of the spray head supplied with the bottle. The adapter has a support surface on the head for placing a force sensor (FMI-200C2; ALLURIS). With the adapter pressed down by a guided force sensor, the force required to trigger the valve can now be measured (Figure 6). The measurements were repeated 5 times and then averaged.
 |
Figure 6 Measurement setup for the minimum required force to open the valve of the BOV-bottle. |
Flow Rate Of The BOV-Bottle
The pressure surrounding the bag decreases when the bag liquid volume inside is reduced. It can be assumed that the flow rate will decrease over time and that the small diameter of the throttle with the same length will cause a higher pressure to drop and therefore a lower flow rate. Another factor that affects the flow rate is the flow resistance within the supply lines.25 Knowing the flow resistance of all components it becomes possible to determine the flow rate over time. The flow resistance is expressed by the pressure drop across the respective component.
The measurement setup to determine the components for a flow rate of 2 mL/s is composed of the BOV-bottle, an adapter, a throttle and a cannula. One end of the tube is connected to an adapter to fit on the bottle. The other end is connected to a cannula via a throttle. All components have different diameters and lengths. For a throttle, there are different kits with different diameters and lengths. Depending on the different geometry of the throttles the flow resistance and thus the flow rate is changing. In the following sections, this assumption is supported by the derivation of the theoretical flow resistance. The liquid used for the measurements is water.
Several different throttle attachments were successively manufactured and subsequently tested. (Formlabs 2, Formlabs Inc. Somerville USA; White Resin RS-F2-GPWH-04 also from Formlabs).
The inside diameter of the inlet of the throttle should be equal to the inside diameter of the tube. Thus, it can be assumed that there are no other diffusers from throttle to tube.
Figure 7 shows the curve of the calculated pressure drop in relation to the volume flow for different throttle types.
 |
Figure 7 Influence of the diameter and length of a throttle on the pressure drop contribution to the volume flow. Abbreviations: D, diameter; L, length. |
Based on the formula (12) and the resulting diagram it can be concluded that by changing the following parameters, the flow or the pressure will drop accordingly.
- The smaller
 the higher the pressure drop in relation to the volume flow (influence with a power of 5)
 - The higher the difference between
 and
and  or between
  and
and  , the more the pressure drops (influence with a power of 4)
 - The higher the volume flow the higher the pressure drop (influence with a power of 2)
- The longer the throttle
 and the higher the lambda
  the higher the pressure drop (influence with a power of 1)
Measurement Setup – Flow Rate
First, it must be ensured that the bag of the BOV-bottle is filled with water. Then, the adapter with the tubes, the throttle and the cannula is placed on the bottle. The cannula is guided to a measuring cup and attached to the cup itself. A camera was used to document the increase of volume over time. For the activation of the flow, the adapter is manually pressed down, which opens the valve in the BOV-bottle. The fluid inside the bag is delivered into the measuring cup (Figure 8). The time and volume change inside the measuring cup is used to calculate the volume flow. Measurements were repeated five times for each throttle and then evaluated via the video.
 |
Figure 8 Measurement setup for the volume flow with different throttles. |
Results
Force To Open The Valve
Six measurements were taken to determine the force necessary to open the valve. The mean value of these measurements is 17.7 N (see Table 3).
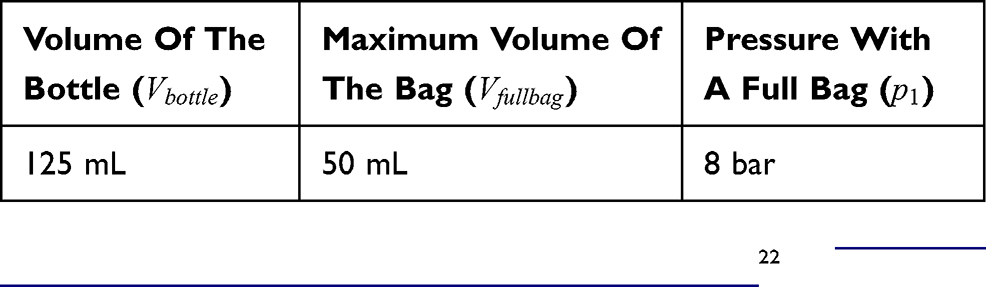 |
Table 2 Datasheet Of SprayPet |
 |
Table 3 Measurement Of The Force Required To Open The Valve |
Flow Rate Of The BOV-Bottle
The smaller the diameter and the longer the attachment, the lower and more constant is the volume flow over time (Figure 9). With a diameter of 0.4 mm and a length of 3 mm, the desired flow rate of 2 mL/s can be achieved. Figure 10 shows the course depending on the pressure difference between the inside bottle pressure and the outside pressure.
 |
Figure 9 Determination of the flow rate for different attachments with different lengths and diameters. |
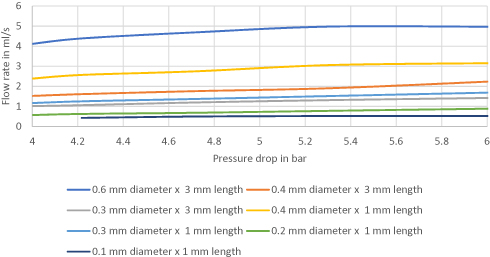 |
Figure 10 Measurement results shown according to the pressure difference between BOV-bottle internal pressure and ambient pressure as a function of the volume flow. |
Discussion
The force to open the valve depends on the spring used and the internal pressure. A change in the spring could be considered, if a lower activation force is needed. With this type of mechanism, the final volume delivered is limited by the size of the bag; therefore, for a wider array of applications, a larger selection of differently sized bottles would have to be present. A big advantage is that the used BOV-bottle can be easily refilled. However, it should be noted that when using other substances, the respective viscosity of the liquid must be considered. A higher viscosity increases the pressure drop of the components. Cleaning the bottles would be possible but is complicated due to the closed system and based on the cost of the system not economically viable.
The measurement results in Figure 9 show that the flow depends mainly on the diameter of the throttle. Looking at equation (12) and the results in Figure 10, one realizes that there is another factor that affects the flow. The highest pressure drop appears in the valve itself. However, this does not change the fact that the volume flow can be regulated via the throttle.
Swelling of the polymer could have a further impact on the measurement. Another factor can be that over a long period of time the diameter could narrow due to the water absorption of the polymer and with that reduce the expected flow rate. The material would soften by swelling and could, therefore, be carried away by the flow.
Figure 9 shows that the lower the volume flow is, the more constant it is over time. This is related to the fact that the higher the resistance, the larger the pressure range that is covered by a flow (shown in Figure 7). Pressure fluctuations thus have little influence on the volume flow. The measurements in Figure 9 shows that even with a very high resistance no completely constant volume flow is possible but only an approximation.
The pressure drop inside the bottle is accompanied by a drop in the volume flow. The higher the resistance, the less noticeable this drop becomes. Figure 10 also shows that the flow rate decreases with dropping pressure. This result is confirmed by the previously calculated dependence between flow rate and pressure drop in Figure 7.
Conclusion
The use of BOV-bottles with a matching attachment for volume flow control is a very feasible drive mechanism for an MRI-compatible pump system. Unlike the systems already available on the market, it does not require a motor or long cable to produce a constant flow within an MRI system. Such a setup could be a low-cost consumable that could be – due to the lightweight components mounted directly on the patient’s arm, would be placed directly into the MRI magnet system, and that would require very short connection lines. The delivery volume is limited to the size of the bag in the cartridge, which requires to determine the needed volume in advance. MRI contrast media application is almost always injected with a flow rate of 2 mL/s and a volume of 0.2 mL/kg patient weight. Assuming a maximum patient weight of 150 kg that would result in a 30 mL contrast media volume. These BOV bottles could be pre-filled for different patient weights (e.g. 10 mL for 50 kg, 15 mL for 75 kg, or 20 mL for 100 kg). This would make the current clinical workflow of contrast media application significantly easier and would save time and reduce user errors and cost.
The injection device was tested in a 3T MRI (Siemens Skyra) without any performance deviations compared to the presented experimental results. The magnetic attraction forces were observable but are manageable, for example, with conventional Velcro due to the relatively low metallic mass. With that, we believe that there will be no adverse effects in a 1.5T. While we expect no issues, we have not tested the system in a 7T MRI yet.
To conclude the initial results of our research:
- It is worth looking at established applications that seem to not need any innovation by focusing on the features that are really needed.
- Major cost reductions in combination with increased patient safety and workflow improvements are possible with reduced systems/device complexity.
Disclosure
MK reports a patent “Mehrkolbenkontrastmittelinjektor” with royalties paid to 102 017 125 266.5, and a patent Nespresso Konzept - MRT Injektor_ IDTM with royalties paid to 10 2018 104 720.7. AB reports a patent Nespresso Konzept - MRT Injektor_ IDTM (10 2018 104 720.7). MF reports a patent DE 10 2014 101 763 pending, and a patent US 2015 15 117 741. The authors report no other conflicts of interest in this work.
References
1. Price DL, Wilde JPD, Papadaki AM, Curran JS, Kitney RI. Investigation of acoustic noise on 15 MRI scanners from 0.2 T to 3 T. J Magn Reson Imaging. 2001;13(2):288–293. doi:10.1002/1522-2586(200102)13:2<288::AID-JMRI1041>3.0.CO;2-P
2. Sawyer‐Glover AM, Shellock FG. Pre-MRI procedure screening: recommendations and safety considerations for biomedical implants and devices. J Magn Reson Imaging. 2000;12(1):92–106. doi:10.1002/1522-2586(200007)12:1<92::AID-JMRI11>3.0.CO;2-7
3. Gosbee J, Gosbee LL. Flying object hits MRI | AHRQ patient safety network. 2003. Available from: https://psnet.ahrq.gov/webmm/case/4/Flying-Object-Hits-MRI.
4. Panych LP, Madore B. The physics of MRI safety. J Magn Reson Imaging. 2018;47(1):28–43. doi:10.1002/jmri.25761
5. Shellock FG, Crivelli R, Venugopalan R. Programmable infusion pump and catheter: evaluation using 3-tesla magnetic resonance imaging. Neuromodulation. 2008;11(3):163–170. doi:10.1111/j.1525-1403.2008.00162.x
6. Denysenkov V, Terekhov M, Maeder R, et al. Continuous-flow DNP polarizer for MRI applications at 1.5 T. Sci Rep. 2017;7:44010. doi:10.1038/srep44010
7. Vital B. Gebrauchsinformation: Information für Patienten - Gadovist 1,0 mmol/mL Injenktionslösung. 2017. Available from: https://www.patienteninfo-service.de/a-z-liste/g/gadovistR-10-mmolml-injektionsloesung/.
8. Friebe M. Computed tomography and magnetic resonance imaging contrast media injectors: technical feature review – what is really needed? Med Devices. 2016;9:231–239. doi:10.2147/MDER.S106338
9. Buijs SB, Barentsz MW, Smits MLJ, Gratama JWC, Spronk PE. Systematic review of the safety and efficacy of contrast injection via venous catheters for contrast-enhanced computed tomography. Eur J Radiol Open. 2017;4:118–122. doi:10.1016/j.ejro.2017.09.002
10. Indrajit IK, Sivasankar R, D’Souza J, et al. Pressure injectors for radiologists: A review and what is new. Indian J Radiol Imaging. 2015;25(1):2. doi:10.4103/0971-3026.150105
11. Pfitzner J. Poiseuille and his law. Anaesthesia. 1976;31(2):273–275. doi:10.1111/j.1365-2044.1976.tb11804.x
12. Ye S-G, Zhang J-H, Xu B. Noise reduction of an axial piston pump by valve plate optimization. Chin J Mech Eng. 2018;31. doi:10.1186/s10033-018-0258-x
13. Cooley DA. Development of the roller pump for use in the cardiopulmonary bypass circuit. Texas Heart Inst J. 1987;14(2):112–118.
14. Buerke B, Puesken M, Mellmann A, et al. Automatic MDCT injectors: hygiene and efficiency of disposable, prefilled, and multidosing roller pump systems in clinical routine. Am J Roentgenol. 2011;197:W226–W232. doi:10.2214/AJR.10.5924
15. Bodh AM, Waghmare GH. Study, design and improvement of pumping system efficiency of hydraulic pneumatic reciprocating pump. Int J Mech Eng Technol. 2016;7(5):127–132.
16. Nghiem VD. Entwicklung Und Prototypischer Aufbau Eines Einfachen MR-Kompatiblen Kontrastmittelinjektors Bachelorarbeit. Otto-von-Guericke Universität; 2016.
17. Reynolds S, Kazan SM, Bluff JE, et al. Fully MR-compatible syringe pump for the controllable injection of hyperpolarized substrate in animals. Appl Magn Reson. 2012;43(1–2):263–273. doi:10.1007/s00723-012-0333-x
18. Imaging Technology News. May 15, 2012. Available from: https://www.itnonline.com/article/automated-contrast-injectors-market-and-technology-trends.
19. Medical Price. STOCKERT-SHILEY 10-00-00 Roller Pump. (n.d.) Available from: https://www.medicalpriceonline.com/used-medical-equipment/stockert-shiley/stockert-shiley-10-00-00-roller-pump/. Accessed October 16, 2019.
20. How the bag-on-valve works BOV solutions. 2015. Available from: http://bovsolutions.com/products/how-the-bag-on-valve-works/.
21. Plastipak - The transparent aerosol system. Available from: https://www.plastipak.com/technologies/aerosol/. Accessed January 1, 2019.
22. Plastipak-Datasheet for SprayPET. 2017. Available from: https://www.plastipak.com/technologies/pdf/Plastipak-SprayPET-Datasheet.pdf. Accessed January 1, 2019.
23. Glenn B. The Darcy-Weisbach equation bae.okstate.edu. 2000. Available from: http://bae.okstate.edu/faculty-sites/Darcy/DarcyWeisbach/Darcy-WeisbachEq.htm.
24. McGovern J. Technical Note: Friction Factor Diagrams for Pipe Flow . 2011. Available from: http://arrow.dit.ie/engschmecart/28/. Accessed January 1, 2019.
25. Brown G. The history of the darcy-weisbach equation for pipe flow resistance. Proc Environ Water Resour Hist. 2002. doi:10.1061/40650(2003)4
 © 2019 The Author(s). This work is published and licensed by Dove Medical Press Limited. The
full terms of this license are available at https://www.dovepress.com/terms
and incorporate the Creative Commons Attribution
- Non Commercial (unported, 3.0) License.
By accessing the work you hereby accept the Terms. Non-commercial uses of the work are permitted
without any further permission from Dove Medical Press Limited, provided the work is properly
attributed. For permission for commercial use of this work, please see paragraphs 4.2 and 5 of our Terms.
© 2019 The Author(s). This work is published and licensed by Dove Medical Press Limited. The
full terms of this license are available at https://www.dovepress.com/terms
and incorporate the Creative Commons Attribution
- Non Commercial (unported, 3.0) License.
By accessing the work you hereby accept the Terms. Non-commercial uses of the work are permitted
without any further permission from Dove Medical Press Limited, provided the work is properly
attributed. For permission for commercial use of this work, please see paragraphs 4.2 and 5 of our Terms.