Back to Journals » International Journal of Nanomedicine » Volume 12
Inhibitory effect of a new orally active cedrol-loaded nanostructured lipid carrier on compound 48/80-induced mast cell degranulation and anaphylactic shock in mice
Authors Chakraborty S, Kar N, Kumari L, De A, Bera T
Received 10 January 2017
Accepted for publication 2 June 2017
Published 7 July 2017 Volume 2017:12 Pages 4849—4868
DOI https://doi.org/10.2147/IJN.S132114
Checked for plagiarism Yes
Review by Single anonymous peer review
Peer reviewer comments 4
Editor who approved publication: Dr Thomas Webster
Shreyasi Chakraborty, Nabanita Kar, Leena Kumari, Asit De, Tanmoy Bera
Laboratory of Nanomedicine, Department of Pharmaceutical Technology, Jadavpur University, Kolkata, West Bengal, India
Background: Type I hypersensitivity is an allergic reaction characterized by the overactivity of the immune system provoked by normally harmless substances. Glucocorticoids, anti-histamines, or mast cell stabilizers are the choices of treatment for type I hypersensitivity. Even though these drugs have the anti-allergic effect, they can have several side effects in prolong use. Cedrol is the main bioactive compound of Cedrus atlantica with anti-tumor, anti-oxidative, and platelet-activating factor inhibiting properties.
Methods: In this study, the preparation and anti-anaphylactic effect of cedrol-loaded nanostructured lipid carriers (NLCs) were evaluated. NLCs were prepared using Compritol® 888 ATO and triolein as lipid phase and vitamin E D-α-tocopherylpolyethyleneglycol 1000 succinate, soya lecithin, and sodium deoxycholate as nanoparticle stabilizers.
Results: The average diameter of cedrol-NLCs (CR-NLCs) was 71.2 nm (NLC-C1) and 91.93 nm (NLC-C2). The particle had negative zeta potential values of –31.9 mV (NLC-C1) and –44.5 mV (NLC-C2). Type I anaphylactoid reaction in the animal model is significantly reduced by cedrol and cedrol-NLC. This in vivo activity of cedrol resulted that cedrol suppressed compound 48/80-induced peritoneal mast cell degranulation and histamine release from mast cells. Furthermore, compound 48/80-evoked Ca2+ uptake into mast cells was reduced in a dose-dependent manner by cedrol and cedrol-NLC. Studies confirmed that the inhibition of type I anaphylactoid response in vivo in mice and compound 48/80-induced mast cell activation in vitro are greatly enhanced by the loading of cedrol into the NLCs. The safety of cedrol and CR-NLC was evaluated as selectivity index (SI) with prednisolone and cromolyn sodium as positive control. SI of CR-NLC-C2 was found to be 11.5-fold greater than both prednisolone and cromolyn sodium.
Conclusion: Administration of CR-NLC 24 hours before the onset of anaphylaxis can prevent an anaphylactoid reaction. NLCs could be a promising vehicle for the oral delivery of cedrol to protect anaphylactic reactions.
Keywords: mast cell, degranulation, allergy, NLC, cedrol, anaphylaxis
Introduction
Over the last few decades, the occurrence of allergic asthma, rhinitis, conjunctivitis, food allergy, and anaphylaxis has increased in both the developing and the developed world.1,2 Systemic anaphylaxis is the most deadly one among them.3 Around 300 million people suffer from asthma globally. The World Health Organization (WHO) has estimated that worldwide mortality due to asthma has reached >180,000 annually.88 Asthma affects all age groups. The pathogenesis mainly involves inflammation of the airways, which in turn affects sensitivity of the nerve endings resulting in irritation, breathlessness, and wheezing. Normally harmless environmental agents act as the cause for this disease. Asthma, allergic rhinitis, atopic dermatitis, and food allergy are categorized under type I hypersensitivity. Many types of inflammatory cells like T-helper type 2 cells, mast cells, B cells, eosinophils, and a number of inflammatory leukotrienes and cytokines are involved in type I hypersensitivity.4,5 The allergens trigger B cells to produce immunoglobulin IgE and IgG antibodies. Crosslinking of IgE with the high-affinity receptor for IgE (FcεR1) on the surface of mast cell and basophil triggers mast cell activation and release of inflammatory mediators like histamine and bioactive lipids including eicosanoids, platelet-activating factor (PAF), and numerous proinflammatory cytokines,6 which are essential in the pathogenesis of allergic diseases and anaphylaxis.3 Secretion of chemokines from mast cell initiates the late phase response which promote leukocytes into the affected tissues.2,4,7,8
Corticosteroids, anti-histaminic, and mast cell stabilizers are commonly used in the treatment of type I hypersensitivity. These drugs are anti-inflammatory or prevent the activation of inflammatory cells and consequently block the actions of inflammatory mediators. Although these drugs are helpful in the treatment of type I hypersensitivity, they may have side effects in long-term use. For example, oral corticosteroids cause general immunosuppression, skin fragility, and Cushing syndrome. Not even the new generation anti-histaminics are completely devoid of sedative properties.9,10 Therefore, new anti-asthmatic agents that are effective in both early and late phase and of good tolerability in long-term use is still a vital need.
Screening of novel therapeutic agent is one of the current trends in the process of lead discovery.11,12 In the last 40 years, Centre for Drug Evaluation Research of the US Food and Drug Administration, Silver Spring, MD, has processed >400 new plant species.13 Plant-derived products are gaining interest in the discovery of new anti-asthmatic agents because of their availability and low cost. Only a fraction of ~250,000 plant species have been studied for anti-asthmatic activity till now.14–21 WHO has reported that 80% people of world population believe in traditional medicine for their health management.22
In our laboratory, we have screened a vast number of natural extract in the form of steam volatile oil in vitro for their inhibitory effect on mast cell degranulation and anaphylactic shock. Cedarwood oil from Cedrus atlantica was found to be a potential inhibitor of compound 48/80-induced mast cell degranulation at a low concentration. The cedarwood oil contains a number of sesquiterpenes like α-cedrene, β-cedrene, and cedrol.23 Cedrol is the main active constituent of cedarwood oil. (+) Cedrol (CR) showed anti-obesity, anti-hyperlipidemia, and/or antidiabetic effect.24 Umeno et al used cedrol via inhalation in both healthy subjects and anosmic patient and found a significant decrease in blood pressure. Their results showed that cedrol acts on the lower respiratory system and may help in hypertensive therapy in future.25 Later, Hori et al found that cedrol not only modulates autonomic activity via central nervous system26 but also causes an increase in the extracellular matrix in dermal cells which may be useful for clinical skin care.27 Now cedrol is mostly used as positive control in different experiments for comparing the PAF antagonist activity.28,29 In the present study, we showed that (+) cedrol had a strong inhibitory effect on mast cell degranulation and anaphylactic shock in mice. But the major drawback of cedrol is its poor water solubility (21.88 mg/L), thereby limiting its bioavailability and localization.30 Therefore, to become a lead for asthma treatment, a suitable and low-cost delivery system for cedrol was essential.
D-α-Tocopherylpolyethyleneglycol 1000 succinate (vitamin E TPGS, or simply TPGS) is a well-known stabilizer which is amphiphilic in nature containing both lipophilic alkyl tail and hydrophilic polar head groups. It is a water-soluble vitamin E derivative with hydrophilic-lipophilic balance value of 13.2 and critical micelle concentration of 0.02% w/w.31,32 A number of advantages like the extended half-life of the drug in plasma and increase in drug-loading (DL) capacity can be achieved by using TPGS in the formulation.33,34 P-gp is a protein in the cell membrane which uses ATP as energy to pump drugs and other xenobiotics out of the cell making the cell more resistant.35 Vitamin E TPGS is a P-gp efflux inhibitor.36 TPGS inhibits P-gp by several mechanisms like membrane fluidization, depletion of ATP, and inhibition of substrate binding. Rege et al37 showed the effect of Tween 80, cremophor EL, and vitamin E TPGS on the P-gp efflux transporter in caco-2 cell monolayers. They reported that TPGS has inhibitory effect at a concentration of 0.025 mM.37 Hence, cedrol nanoparticle stabilized by TPGS is expected to have a good pharmacological response in asthma.
In our formulation, we have used both solid and liquid lipids to form the core matrix for nanostructured lipid carrier (NLC). NLC has certain advantages over solid lipid nanoparticles and other drug delivery systems which include high DL capacity, enhanced storage stability, improved permeability, bioavailability, reduced adverse effect, prolonged half-life, and tissue-targeted delivery.38 Triolein is a hydrophobic molecule that shows little interaction with water and phospholipid planer bilayers. Measured effects of triolein on the structure and properties of phosphatidyl ethanolamine membrane have verified that triolein could enhance the formation of the HII phase, which may be beneficial for destabilizing the membrane and enhancing the gene transfection.39 Artificial lipoprotein has been developed with triolein, and the transfection efficacy was comparable with that of commercial Lipofectamine.40,41 In our laboratory, we have prepared cedrol-NLC composed of compritol® 888ATO and triolein as lipid matrix stabilized by TPGS, soybean lecithin, and sodium deoxycholate.
Materials and methods
Materials
Compritol® 888 ATO was supplied by Gattefosse India Pvt Ltd (Mumbai, India). Triolein, soybean lecithin, TPGS, sodium deoxycholate, compound 48/80, O-phthalaldehyde (opt), 4-nitrophenyl N-acetyl-β-D-glucosaminide, Fura 2-AM, cromolyn sodium, prednisolone, and cedrol were obtained from Sigma-Aldrich Co. (St Louis, MO, USA). Fetal bovine serum (RM10432 HiMedia), RPMI 1640, and Medium 199 were supplied by HiMedia (Mumbai, India).
Instruments and equipment
Sartorious digital balance, Vortex (CM101 cyclomixer; Remi, Mumbai, India), a 700 MW sonicator (Vibra cell VCX750; Sonics, Newtown, CT, USA), high-speed homogenizer (Ika® T10 basic, Ultra-Turrax®), magnetically stirred hot plate (Tarsons, Spinot digital model MCO2), lyophilizer (LaboGene-ApS, 6-B-DR-3450 Lynge, Denmark) were used in the process of NLC preparation. Analyses were carried out by high performance liquid chromatography (HPLC) (Dionex ultimate3000; Thermo Fisher Scientific, Waltham, MA, USA), UV spectrophotometer (Shimadzu UV-1800; Schimadzu, Koyto, Japan), BOD incubator shaker (BOD Inc 1S, Kolkata, India), CO2 incubator (MCO-15AC; Sanyo, Tokyo, Japan), Laminar Airflow (Stericlean; Deepak Meditech Pvt. Ltd, New Delhi, India), Cold Centrifuge (Rota 4R-V/FM; Plasto Crafts, Mumbai, India). Standard glasswares of Borosil® brand were used for experimental purposes. GraphPad Prism 5.0.1, Statistica version 6, and MedCalc version 11.6 were used for statistical analysis.
Methods
Ethics statements
All the experiments were carried out on BALB/c mice of either sex, weighing 20–25 g and of approximately the same age. All the mice were housed in polypropylene cage and were kept in pathogen-free condition of animal house. The experimental procedure was done according to the guidelines of Jadavpur University Animal Ethics Committee (Committee for the purpose of control and supervision of experiments on animals), which also approved the study and was carried out with necessary humane care. Mice had the free access of standard diet and water ad libitum and were exposed to a proper day and night cycle.
Preparation of cedrol-loaded NLCs
The lipid materials used in the formulation have been used frequently in the preparation of NLC for good biocompatibility with hydrophobic drugs.42 Cedrol-loaded NLCs were prepared by a combination of melt emulsification combined with high-speed stirring and ultrasonication method. Briefly, according to the drug and lipid ratio (Table 1), Compritol® 888 ATO (3 g) (glycerylmonobehenate 15%, glyceryldibehenate 50%, glyceryl tribehenate 35%), triolein (0.63 g), and the drug were mixed and melted at 85°C with occasional stirring for 15 minutes to form a transparent and uniform oil phase. The stability study for cedrol at the melting point of the lipid for the time period to obtain NLC revealed that no degradation of cedrol has occurred under these conditions. Besides the lipid phase, the aqueous phase (120 mL double-distilled water) containing hydrophilic emulsifier vitamin E TPGS (0.048 g), sodium deoxycholate (0.03 g), and amphiphilic emulsifier soya lecithin (0.63 g) was also heated to 85°C for 15 minutes and was then added dropwise slowly to the lipid phase under homogenization (Ika® T10 basic, Ultra-Turrax®) at 20,000 rpm for 10 minutes. The obtained pre-emulsion was then subjected to ultrasonication (a 700 MW sonicator, Vibra cell VCX750; Sonics) for 10 minutes at 85°C. Blank NLC was also prepared by the same technique except for the addition of cedrol.
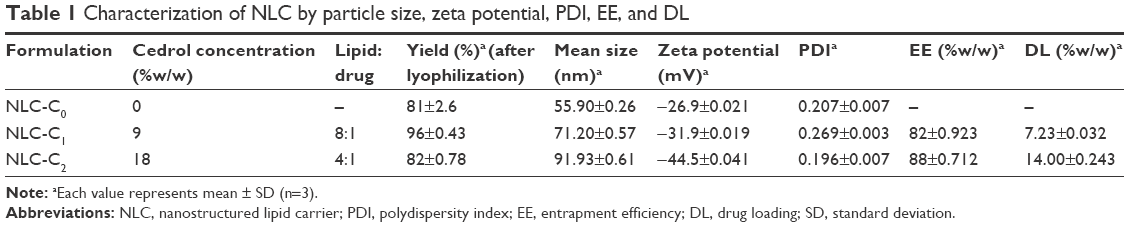 | Table 1 Characterization of NLC by particle size, zeta potential, PDI, EE, and DL |
Coumarin-6 was used as a fluorescent marker to prepare coumarin-6-loaded nanoparticles (CM-NLC). CM-NLC was prepared by the same technique where 150 nmol/g of coumarin-6 was added instead of cedrol. The different formulations of NLCs were then cooled at 4°C for 20 hours and filtered through Millipore filter (0.45 μm). To each NLC suspension, 7% sorbitol was added. The obtained NLC suspensions were frozen to −80°C and lyophilized for 48 hours at −45°C using a LaboGene-ApS Lyophilizer (LaboGene-ApS 6-B-DR-3450 Lynge) until the solid product was obtained. The yields of the NLCs were calculated by using the following formula:
|
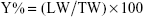
where LW is the (lyophilized weight-weight of sorbitol added) and TW is the theoretical weight of lipids and surfactants.
Physicochemical characterization of cedrol-NLC (CR-NLC)
Particle size, polydispersity index (PDI), and zeta potential
Average particle sizes of different formulations of NLCs were determined by a dynamic light scattering (DLS) method using Data Transfer Assistance (DTA) software by Zetasizer Nano ZS90 (Zetasizer Nano ZS; Malvern Instrument, Malvern, UK) at 25°C. The range of the analyzer was 0.02 nm to 2 μm. The PDI is an index of width or spread or variation within the particle size distribution. It was measured for different formulations by DLS instrument.43
PDI can be calculated by the following equation:
|

where D90, D50, and D10 are particle diameter determined at 90th, 50th, and 10th percentile of undesired particles, respectively.
Zeta potential was measured by Zetasizernano ZS (Malvern Instrument). It is measured as charge of a potential that moves as suspension placed between two electrodes that have DC voltage across them, and the velocity will be proportional to the zeta potential of the particle.44
Field emission scanning electron microscopy (FE-SEM)
The surface morphology of NLC was studied by FE-SEM. For that purpose, after suspending the sample in distilled water, it was centrifuged (30,000 rpm for 30 minutes) two times and was then resuspended in distilled water. Millipore filter membrane (0.45 μm) was used as the carrier medium. Then with the help of tweezers, membrane squares (0.5×0.5 cm) were dipped in concentrated NLC suspension, and carrier medium was mounted on stubs. Using a Sputter Coater JFC-1100, the particles were coated with gold (20 nm thickness) and was observed under a JSM-6700F scanning electron microscope (JEOL, Tokyo, Japan).
Transmission electron microscopy (TEM)
The morphology of CR-NLC was examined by TEM (Jeol JEM 2100F; JEOL-France, Paris, France), with an accelerating voltage of 200 kV. A drop of NLC suspension was stained by a 2% phosphotungstic acid aqueous solution for 30 seconds and was sprayed onto copper grids overlaid with 1% formvar in chloroform. The grid was then allowed to air dry before observation under transmission electron microscope.
Atomic force microscopy (AFM)
The surface properties of cedrol-loaded NLCs were visualized by an AFM (Dimension Icon, Bruker, Germany). After diluting the sample 20 times in double-distilled water, the CR-NLC suspension was dropped (20 μL of final sample) onto freshly cleaned mica plates, followed by vacuum drying for 24 h at 25°C, and measurements were taken in triplicate in different sample locations. AFM was done by tapping mode, using high resonant frequency (F0 =129 kHz), 2 μM pyramidal cantilevers with a monocrystalline silicium tip (Ultalever UL 020) having force constant 10 nN. The linear scanning speeds were set at 1 Hz. Contact and non-contact methods of AFM also revealed that this method has no effect on the shape of nanoparticles.
Fourier transform infrared (FT-IR) spectroscopy
To detect the interaction of cedrol with carriers, FT-IR studies were carried out. FT-IR spectra for pure cedrol, the physical mixture of all components, pure TPGS, blank NLC, and the CR-NLC were obtained at ambient temperature. All the spectra were acquired by scanning the samples between 4,000 and 400 cm−1 at a resolution of 4 cm−1 (IR Affinity 1; Shimadzu, Kyoto, Japan).
Differential scanning calorimetry (DSC) analysis
DSC analysis was carried out for pure cedrol, pure TPGS, CR-NLC, blank NLC, and physical mixture of all components on a DSC 60 detector (Pyris Diamond TG/DTA; PerkinElmer, Singapore). 5 mg of each sample was taken in a platinum crucible and sealed hermetically. DSC scan was recorded in the range of 30°C–300°C at a heating rate of 5°C/min under a nitrogen purge, using alpha aluminum powder as a reference.
Stability studies of freeze-dried cedrol-loaded NLC
Lyophilized NLCs were stored in glass vials in refrigerator (at 4°C) for 60 days. The stability of the NLC was evaluated on the basis of mean diameter, PDI, zeta potential, and DL capacity.
Determination of entrapment efficiency (EE) and DL
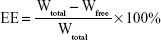
For the determination of EE and DL capacity, CR-NLC was taken in a centrifuge tube and 3 mL of 0.5 wt% Tween 80 in phosphate-buffered solution (PBS, pH 7.4) was added. It was then shaken for 3 minutes by using the vortex to dissolve the free drug. After proper mixing, the samples were centrifuged for 15 minutes at 25,000 rpm (Cold Centrifuge Rota 4R-V/FM; Plasto Crafts, Mumbai, India). The supernatant after centrifugation was analyzed by HPLC method (Dionex ultimate3000, Thermo Fisher Scientific) where HPLC column used was C18, 4.6×250 mm, 5 μM. The mobile phase was chloroform and methanol (85:15).45 The flow rate was 1 mL/min, and the detecting wavelength was 242 nm. The calibration curve of peak area against the concentration of cedrol (Y =30.48X +13.11, R2=0.991, where Y = peak area and X = cedrol concentration) was plotted. This was used to detect cedrol concentrations throughout. The drug EE and DL of NLC were calculated by using the following equations:
|
|
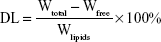
where Wtotal, Wfree, and Wlipids were the weight of drug added in the system, analyzed weight of drug in supernatant, and weight of lipids added to the system, respectively.
In vitro release of cedrol-loaded NLC
In vitro release of cedrol from the NLC core has been studied using dialysis bag diffusion technique. For the study, freeze-dried CR-NLC in a concentration of 3 mg/mL was suspended in 3 mL of deionized water and vortexed. The resulting suspension was then placed into a 12 kDa, molecular weight cutoff pre-swelled dialysis bag. The bag was incubated in 50 mL release medium (0.5% of Tween 80 in PBS, pH 7.4, and acetate buffer, pH 4.5) at 37°C under 100 rpm horizontal shaking. At specific time interval (0.75, 1.5, 3, 6, 12, 24, 48, and 72 hours) aliquots of 2 mL were withdrawn from the dissolution media and the same volume was replaced by fresh buffer. To all the collected aliquots, 2 mL of HPLC grade chloroform was added, shaken properly, and allowed for phase separation. To quantify cedrol in the aliquots, chloroform layer was taken and analyzed by HPLC.
Mast cell purification and culture
Mice peritoneal mast cells were isolated as described.46 Briefly, mice were killed with excess carbon dioxide and 5 mL of heparinized (10 IU/mL) calcium- and magnesium-free Hank’s solution (HBSS) was injected into peritoneal cavity. After 90 seconds, the fluid was collected, centrifuged at 1,290 rpm for 10 minutes at 4°C. The pelleted cells were resuspended in HBSS containing 0.1% protease-free bovine serum albumin and purified by continuous isotonic Percoll gradient (72%) for mast cell isolation. Purified mast cells were resuspended in HBSS containing Mg2+ and Ca2+. Purity and viability were evaluated by toluidine blue and trypan blue exclusion staining, respectively. Purified mast cells were transferred to 15% FBS and 5 μg/mL streptomycin and 50 U penicillin fortified RPMI-1640 for multiplication of mast cells.47 Media was changed after every 3 days, and the culture was maintained up to 2 months.
Trypan blue exclusion assay of mast cell viability
For the cell viability assay, trypan blue exclusion was carried out. Briefly, to a 1.5 mL clear effendrop tube, 200 μL of mast cells was aseptically transferred and incubated with an equal volume of 0.4% (w/v) trypan blue solution prepared in 0.8% NaCl and 0.06% (w/v) dibasic potassium phosphate for 3 minutes at room temperature. Cells were counted by using dual chamber hemocytometer under a light microscope. Viable and nonviable cells were recorded separately, and the means of the three independent cell counts were pooled for analysis. Cell viability study was conducted by incubating the cells for 24 hours at 37°C with the experimental concentrations of standard anti-asthmatic drugs, cedrol, and CR-NLC used for histamine release assay, β-hexosaminidase release assay and intracellular Ca2+ uptake measurement.
Mast cell sensitization by compound 48/80 and microscopic observation
Purified mast cell suspension in HEPES-Tyrode’s buffer was incubated with compound 48/80 (4 μg/mL) for 10 minutes at 37°C. Smears of mast cells were prepared, fixed in methanol, and stained with 0.1% (w/v) toluidine blue for 10 minutes. The morphology of the cells was observed under a light microscope.48
Time course of fluorescence intracellular distribution studies
For intracellular distribution study, CM-NLC was prepared and un-entrapped coumarin-6 was removed by dialysis (12 kDa; Sigma-Aldrich Co.). To study the uptake of CM-NLC in mast cells, 4×10⁵ cells/well were seeded with CM-NLC (0.5 mg/mL) and incubated in a CO2 incubator at 37°C for 15, 30, and 45 min. After these time intervals, the samples were withdrawn and observed under confocal laser scanning microscope (TCS SP8; Leica Microsystems, Wetzlar, Germany) equipped with Leicasuitelas X software. Samples were observed in fluorescein isothiocyanate channel. The magnification of the objective was 63×.
Effects of anti-asthmatic drugs, cedrol, and CR-NLC on histamine release assay from mast cells
Purified mice peritoneal mast cells (2×10⁵ cells/mL) were preincubated at 37°C for 10 minutes in carbon dioxide incubator for stabilization. Standard anti-asthmatic drugs, cedrol, and CR-NLC at various concentrations were added and incubated at 37°C. After 24 hours of incubation, the cells were washed to free from the unabsorbed drug before incubation with compound 48/80 (4 μg/mL) for 20 minutes. The reaction was stopped by chilling test tubes in ice water. The cells were separated from the released histamine by centrifugation at 2,108 rpm for 5 minutes at 4°C. In the cell pellets, 0.05% (v/v) Triton X-100 was added to liberate the residual histamine. After the addition of 0.02% opt-methanol solution, histamine content in the supernatant and cell pellets was determined spectrofluorimetrically (excitation 360 nm, emission 450 nm). For the estimation of the spontaneous release of histamine (spontaneous), exactly the same procedure without adding drugs and samples was followed. The release percentage of histamine was calculated by the following equation.49,50
|
Effect of anti-asthmatic drugs, cedrol, and CR-NLC on β-hexosaminidase release assay from mast cells
As a marker of degranulation, we measured the release of β-hexosaminidase. To measure β-hexosaminidase release, cells were incubated with standard anti-asthmatic drugs, cedrol, and CR-NLC at various concentrations for 24 hours at 37°C. The supernatant from cells after the compound 48/80-stimulation in PIPES buffer and β-hexosaminidase substrate (p-nitrophenyl-N-acetyl-β-D-glucosaminide) in 100 mM citrate buffer (pH 4.5) were mixed in 48-well plates and were incubated at 37°C for 1 hour in carbon dioxide incubator. The reaction was terminated by adding 100 mM carbonate buffer (pH 10.5), and the absorbance at 405 nm was measured by a microplate reader. The percentage of β-hexosaminidase release inhibition was calculated by using the following formula:
|
T = test, in the presence of compound 48/80 and drug
B = blank, in the absence of compound 48/80 but in the presence drug
C = control, in the presence of compound 48/80 without drug
N = normal, in the absence of compound 48/80 and drug.
Measurement of intracellular calcium
The intracellular levels of Ca2+ ions were estimated by Fura-2-AM. The cells (107 cells/mL) were incubated with anti-asthmatic drugs, cedrol, and CR-NLC in Ca2+-supplemented Tyrode solution for 24 hours. The cells were then washed and stimulated with C 48/80 for 20 minutes at 37°C, except for wells used to measure the baseline release from cells alone. The intracellular level of Ca2+ ions was measured by adding 2 μM Fura-2-AM and incubating the cells for a further 30 minutes prior to analysis. Finally, the cells were washed twice in PBS and the fluorescence intensity was recorded using fluorescent plate reader at an excitation of 340 nm and emission of 500 nm.
Compound 48/80-induced systemic anaphylactic reaction
The experiment was carried out according to the method as described by Kim et al.51 Briefly, each mouse was given an intraperitoneal (ip) injection of mast cell degranulator compound 48/80 (10 mg/kg) to evoke a systemic anaphylactic reaction. The anti-asthmatic drug, cedrol, or CR-NLC was orally administered 1, 16, and 24 hours before the injection of compound 48/80. Survival time and mortality were monitored after the induction of anaphylactic shock.
Cytotoxicity assay and selectivity index (SI)
The assay was performed in 48-well tissue culture plates in the presence of 2×10⁵ mast cells in RPMI-1640 medium. The wells were seeded with standard anti-asthmatic drugs, cedrol, or CR-NLC solutions and incubated at 37°C in carbon dioxide incubator for 3 days followed by counting of viable mast cells stained by trypan blue, microscopically. Control cell system was run in parallel in the absence of drugs or inhibitors. The SI which is typically considered as highest exposure that produces desired efficacy is an important parameter in efforts to achieve this balance. In the present study, the degree of selectivity of the drug or its formulation is expressed as SI = CC50 of a drug or its formulation in a mast cell line/IC50 of the same drug or its formulation, where CC50 is the concentration required to kill 50% of mast cell population and IC50 is the concentration required to inhibit 50% of either histamine or β-hexosaminidase release from mast cell in the presence of the drug or its formulation. When SI value is >10, the drug or formulation presents promising activity, that is higher than its toxicity.52
Statistical analysis
Experimental results were expressed as mean ± standard deviation. Comparison of IC50 values of histamine assay, β-hexosaminidase assay, and Ca2+ uptake inhibition between groups was done by one-way analysis of variance followed by Tukey’s test for post hoc pairwise comparison between groups. P<0.05 was considered as significant. In the case of survival time comparison between the groups in anaphylaxis reaction, we conducted Kaplan–Meier survival analysis.
Results
Selection of lipids and surfactants
In the development of lipid nanoparticle, the most critical parameter is to select adequate lipids. The selected lipids form solid–liquid binary lipid (SLB) matrix and should have the ability to solubilize the drug.53 For that purpose, to select the most suitable matrix, the solubility of cedrol was studied in different solid and liquid lipids. The most suitable lipid matrix was found to be Compritol® 888 ATO:Triolein =5:1 (w/w) for cedrol-loaded NLC preparation. Based on the capacity to emulsify SLB, the surfactants were selected. The most suitable combination of surfactants in the preparation of NLC was found to be soya lecithin:vitamin E TPGS:sodium deoxycholate =21:1.6:1(w/w/w).
Characterization and preformulation study of NLC
A number of active pharmaceutical compounds are efficient in vitro at the cellular level, but their high hydrophobicity that restricts their direct administration in vivo. Low drug capacity is the major drawback for polymeric nanoparticles.54 High drug content and good drug retention are the most desirable properties of nanoparticles to exert their efficacy in both in vitro and in vivo.55 Nanoparticles with a lipid core constitute ideal carrier for the vectorization of high payloads of these lipophilic drugs/compounds. In this study, we described a low-cost preparation of NLC composed of Generally Recognized As Safe (GRAS) ingredients, such as fat, oil, and lecithin, TPGS, and sodium deoxycholate surfactants (Table 2).
 | Table 2 The composition of nanostructured lipid carrier system |
Preparation and physicochemical characterization of cedrol-loaded nanoparticles
Different NLC formulations were prepared by the technique of both hot melt homogenization and ultrasonication, comprising Compritol® 888 ATO and triolein as the lipid phase and a mixture of surfactants – TPGS, soya lecithin, and sodium deoxycholate. Several initial experiments were performed to ensure the optimum conditions with respect to formulation composition in the preparative process of NLC.
To interpret the effect of lipid-to-drug ratio on the physical properties of NLCs, the particle size, zeta potential, PDI, EE, and DL values were evaluated, which are shown in Table 1. The Z average diameter for the NLCs was increased from 71.2 to 91.9 nm as the cedrol concentration increased from 9% to 18% (Figure 1; Table 1). TPGS-emulsified nanoparticles exhibited negative surface charge, NLC-C1 having −31.9 mV and NLC-C2 having −44.5 mV. PDI indicates the width of the particle size distribution, which ranges from 0 to 1. A monodisperse sample has PDI near to 0. The mean PDI values for the NLC-C1 and NLC-C2 formulations varied in the range of 0.269–0.196 as tabulated in Table 1. PDI values indicate that the NLCs show polydispersity. NLCs prepared with 9% and 18% (w/w) cedrol resulted in 7.23% and 14% (w/w), respectively, of DL and 82%–88% (w/w) of EE. Formulation NLC-C2 was considered for further characterization, due to higher DL.
 | Figure 1 Particle size distribution and zeta potential analysis by DLS study. |
Morphology study
FE-SEM study confirms that the particles are in nano range (Figure 2A). TEM analysis of NLCs showed that the particles are of spherical shape (Figure 2B1 and B2). Particles with an inner dark core comprising Compritol® 888 ATO and triolein can be observed at high magnification. TEM image also revealed that the particles have no rupture on their surfaces. The topographic and three dimensional (3D) micrographs of AFM were generated by the atomic level interaction between a sharp tip and the surface of CR-NLC which is depicted in Figure 2C1 and C2. AFM images showed uniform spherical-shaped CR-NLCs having a smooth surface without any visible crevices or pores. The uniform covering of both hydrophilic and amphiphilic emulsifier over the surface of solid–liquid lipid core is the probable cause for the smooth surface of NLC. The images of morphology study of NLCs revealed the regular spherical shapes, smooth surface with no apparent aggregation.
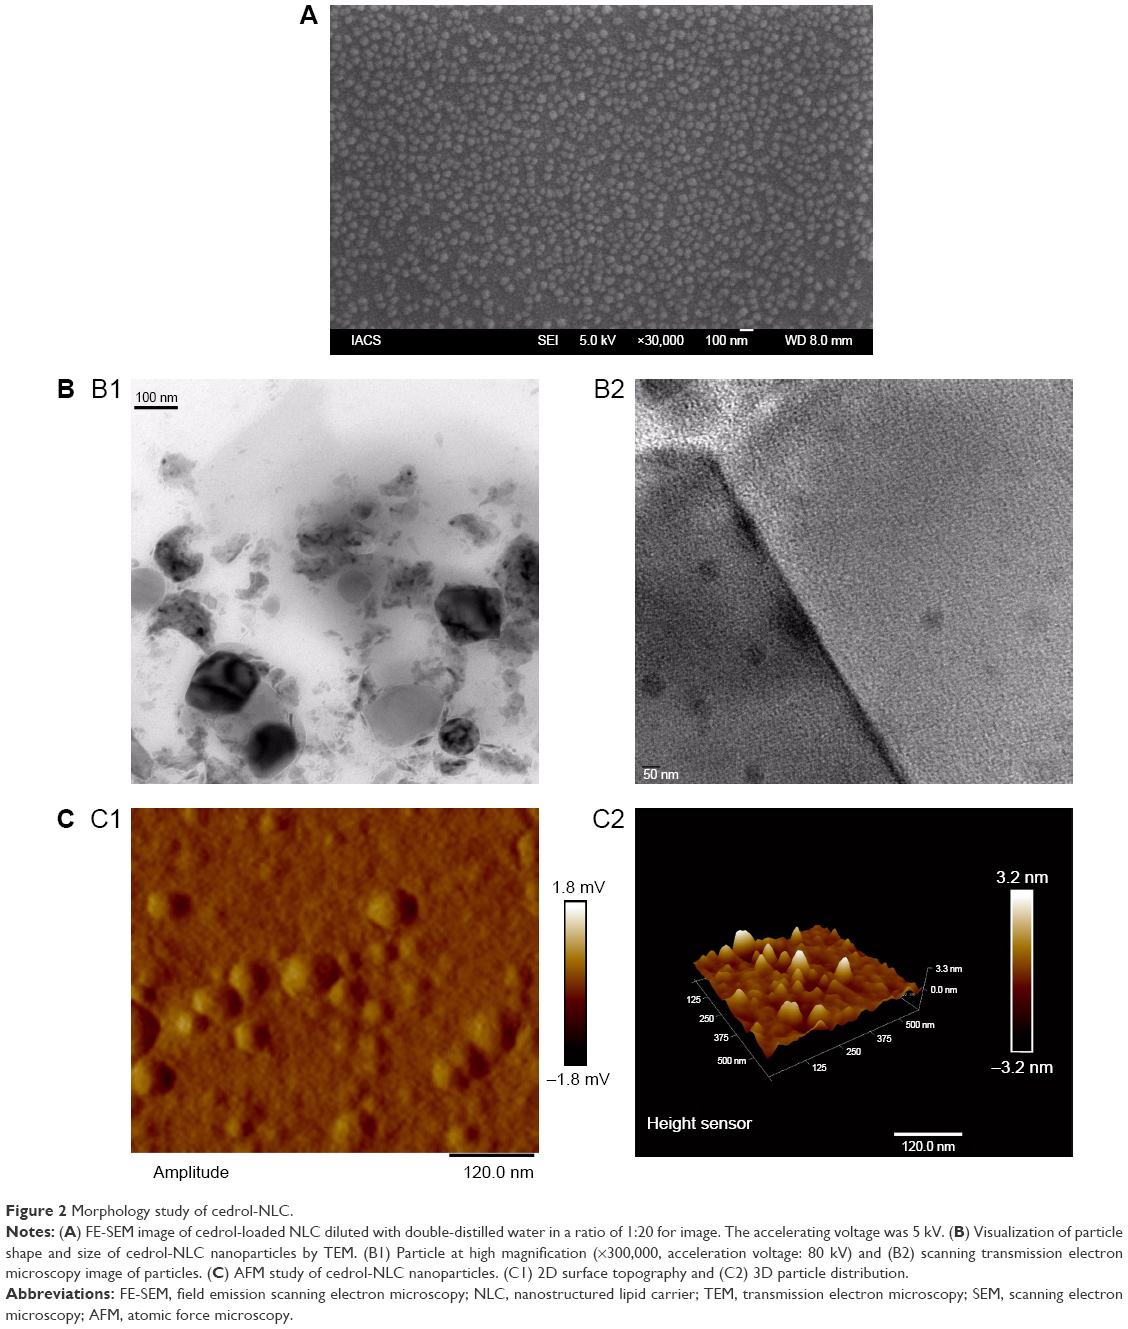 | Figure 2 Morphology study of cedrol-NLC. |
FTIR spectroscopy
FTIR investigation showed that cedrol had important peaks at 1,128, 1,371, and 3,352 cm−1 (Figure 3A). A small sharp peak of 1,128 cm−1 was present in cedrol, whereas the same peak in CR-NLC turned too broad. The peak 1,128 cm−1 represents C-O stretching of C-OH, and when the same peak becomes broad, it represents bond stretching is hindered due to immobilization in NLC. A small sharp peak at 1,371 cm−1 of cedrol represents –O-H bending, and the same is absent from CR-NLC. This observation again shows that due to immobilization in NLC, –O-H bending is hindered. A broad peak at 3,352 cm−1 represents H-bonded –OH of cedrol, and the same is absent from the physical mixture, whereas present in the CR-NLC due to H-bonding. A small sharp peak at 1,371 cm−1 represents  (CH3)2 of cedrol and the same is absent from CR-NLC due to immobilization.
 | Figure 3 Characterization of cedrol-loaded NLC nanoparticles. |
DSC study
The DSC thermograms of cedrol, pure TPGS, physical mixture, blank NLC, and CR-NLC are depicted in Figure 3B. In DSC thermogram of pure cedrol and pure TPGS, a sharp melting point at 83.6°C and 44.8°C, respectively, indicates crystalline behavior of the two. The sharp endothermic peak of blank NLC and CR-NLC appeared at 72.58°C and 71.81°C, respectively. In case of the physical mixture of cedrol with all components of NLC, the peak exhibited at 78.04°C. The absence of sharp endotherm of cedrol in the thermogram of CR-NLC is the clear indication of phase transformation of cedrol. Here it can be suggested that during the process of encapsulation, cedrol has transformed to amorphous state from crystalline state. The melting-homogenization process has prevented the recrystallization of cedrol. As a result, cedrol inside the NLC core became amorphous molecular dispersion form. Furthermore, homogeneous encapsulation of cedrol can be suggested here because of the absence of redundant endothermic peaks of CR-NLC. In addition, the absence of redundant endothermic peak suggests that there is homogenous encapsulation of cedrol inside the NLC.
Storage stability
The data of stability study of NLC-C1 and NLC-C2 after 60 days of storage at 4°C is presented in Table 3. It can be observed that there is a very little change in mean diameter, PDI, a slight decrease in zeta potential and loading capacity, as observed in Table 3, thus indicating the stability of the formulations, which is the most important desired product characteristics.
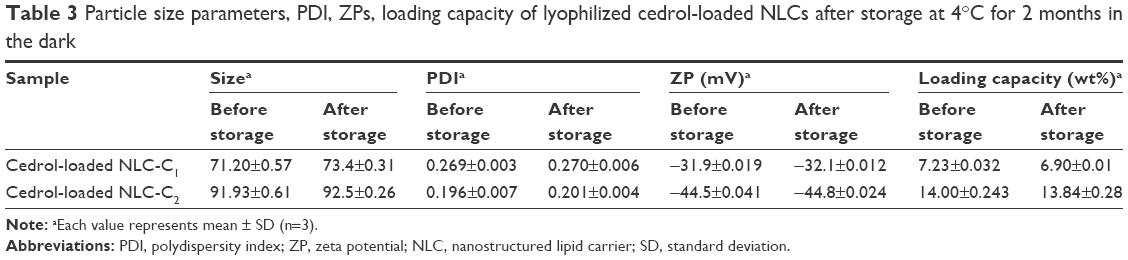 | Table 3 Particle size parameters, PDI, ZPs, loading capacity of lyophilized cedrol-loaded NLCs after storage at 4°C for 2 months in the dark |
In vitro release study of cedrol from NLC
In vitro drug release study was conducted upon sink condition performed in order to assess the potential of cedrol-NLC to control the release of cedrol for prolonging the action. The in vitro drug release profile of cedrol from CR-NLC in phosphate buffer pH 7.4 and acetate buffer pH 4.5, respectively, placed in dialysis bag and incubated in PBS, pH 7.4, with 0.5% (v/v) Tween 80 and acetate buffer 4.5 at 37°C is presented in Figure 4. The release of cedrol from NLCs showed phase release behaviour, where an initial burst release has been noticed which extended over a period of 24 hours. The release of cedrol from NLCs in PBS, pH 7.4, is comparatively greater than the release in acetate buffer, pH 4.5. As it is reported earlier in the case of hydrophobic drugs, this is due to the partial erosion of outer phospholipid layer of CR-NLC, and there is a rapid diffusion and desorption of surface adsorbed or weakly bound cedrol which resulted in quick diffusion.56 The subsequent extended release was achieved up to 72 hours, indicating the slower diffusion of the encapsulated cedrol from CR-NLC core. The phospholipid envelop of NLC acts as the barrier, which has restricted the penetration of release media and reduced the faster immobilization of cedrol from the compritol-triolein core extending the release.57 To measure the efficiency of the formulation NLC-C1 and NLC-C2, in vitro release of cedrol from NLC was conducted in stimulated physiological dissolution medium. The results obtained were further analyzed by using different mathematical models for drug release kinetics. To investigate the kinetic modeling of drug release from NLCs, the correlation coefficient (R2) was used as an indicator of the best fitting of the models which is shown in Table 4. The dissolution profiles were fitted to zero order (Q = k0t): first order [In (100-Q) = In Q0-k1t]: Higuchi (Q = kht1/2) and Korsmeyer-Peppas models equation.58 The R2 values for first-order kinetics of NLC-C1 and NLC-C2 were greater than that of zero order at pH 7.4. To understand the mechanism of drug release, the first 60% drug release data were fitted to Korsmeyer-Peppas exponential model Mt/Mα = Ktn, where Mt/Mα is the fraction of drug released after time “t” and “K” is kinetic constant and “n” is release exponent, which characterizes the different drug release mechanism.59 The value of release exponent “n” of Korsmeyer-Peppas model indicates the release mechanism (Fickian diffusion, case II transport or anomolos transport) involved in the process. The limits considered were n ≤0.43 (for classical Fickian diffusion-controlled drug release) and n=0.85 indicates a case II release transport; non-Fickian, zero-order release. When “n” value lies between 0.43 and 0.85, this can be the indicator of both phenomena (drug diffusion in the hydrated matrix and matrix relaxation) generally called as anomalous transport.59 In our study, both the formulation NLC-C1 and NLC-C2 at both pH have “n” value in the range between 0.43 and 0.85, which suggests the phenomena of anomalous or non-Fickian diffusion and is related to both diffusion of the drug and dissolution of the NLC matrix.
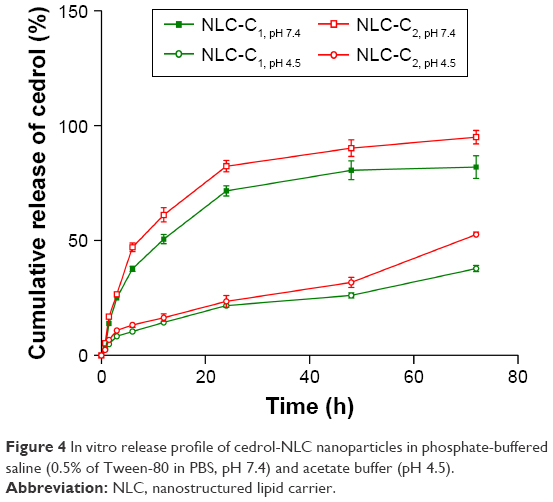 | Figure 4 In vitro release profile of cedrol-NLC nanoparticles in phosphate-buffered saline (0.5% of Tween-80 in PBS, pH 7.4) and acetate buffer (pH 4.5). |
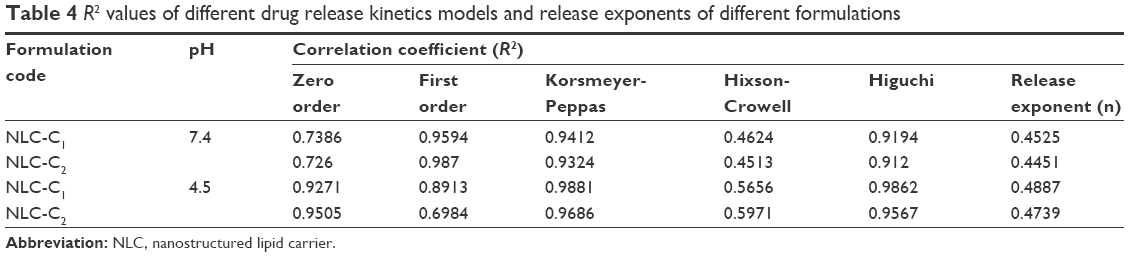 | Table 4 R2 values of different drug release kinetics models and release exponents of different formulations |
Light microscopy of compound 48/80-induced degranulation of mast cell
Mast cells showed 94% purity and 97% viability when evaluated by toluidine blue and trypan blue exclusion staining, respectively. When mast cell incubated with standard anti-asthmatic drugs, cedrol and cedrol-NLC for 24 hours at 37°C with experimental concentrations used for histamine release assay, β-hexosaminidase release assay and intracellular Ca2+ uptake measurement, no major change in the viability has occurred. The morphology of the mast cells was observed under a light microscope to examine compound 48/80-induced mast cell activation (Figure 5). Microscopic observation of mast cells smear stained with toluidine blue showed the presence of granules generally spherical or oval in shape within a mast cell (Figure 5A). Following stimulation with compound 48/80 for 10 minutes, mast cells showed the characteristics of mast cell degranulation with cell swelling and extended granules near the cell surface and the surrounding medium (Figure 5B).
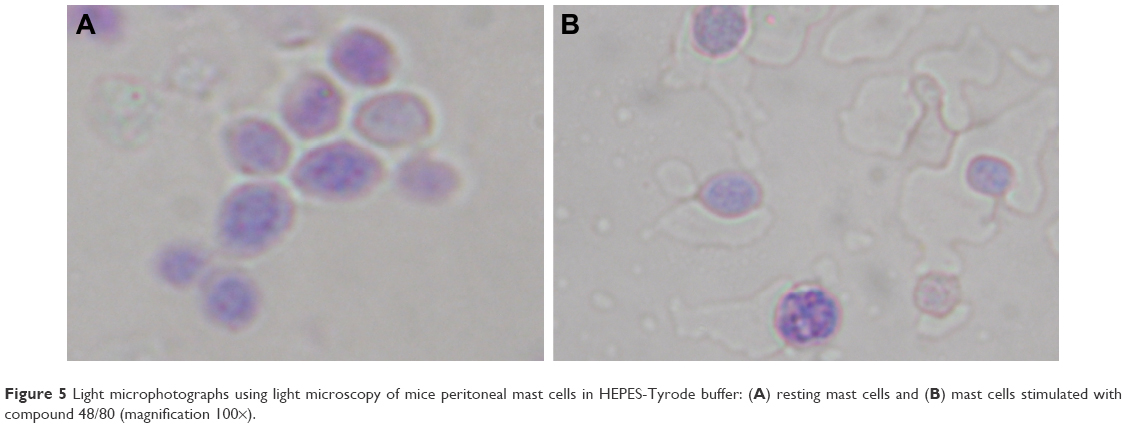 | Figure 5 Light microphotographs using light microscopy of mice peritoneal mast cells in HEPES-Tyrode buffer: (A) resting mast cells and (B) mast cells stimulated with compound 48/80 (magnification 100×). |
Permeation of NLC in mast cell
In order to assess the permeation potential of NLCs, the permeation study using mast cell model was conducted (Figure 6). CM-NLC was used as a fluorescent label for time-dependent uptake of NLC. Considerable internalization of CM-NLC into the mast cells was within 45 minutes of incubation while 15 minutes incubation period showed insignificant internalization. Cellular internalization of CM-NLC only took place in viable cells. Figure 6 represented time-dependent uptake of CM-NLC. The anti-degranulation activity of CR-NLC is attributed to be the cedrol payload and to mast cell localization.
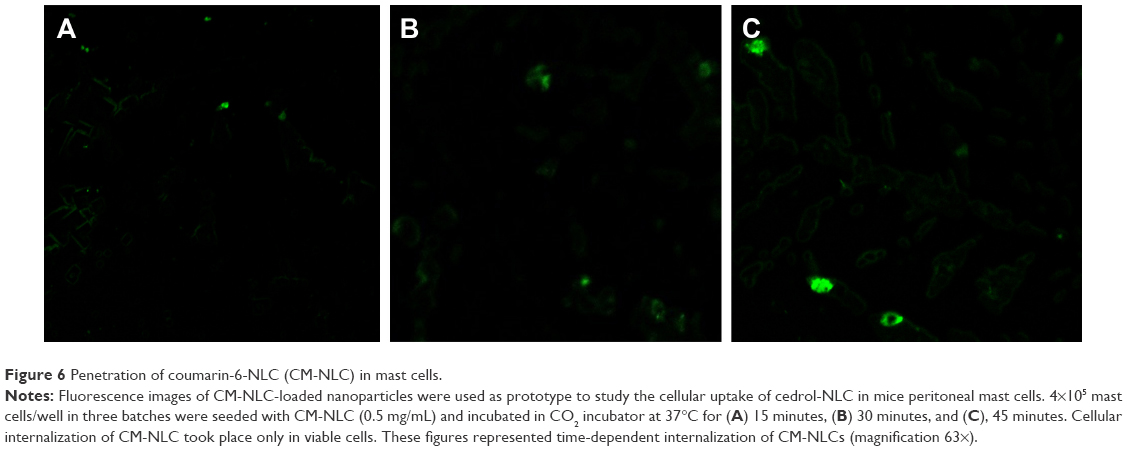 | Figure 6 Penetration of coumarin-6-NLC (CM-NLC) in mast cells. |
Cedrol and CR-NLC inhibit compound 48/80-induced histamine release from mast cells
A standard histamine concentration curve was obtained using pure histamine by the method of Shore et al.60 Incubation of mast cells with compound 48/80 in the positive control group showed significant increase of histamine release compared to the normal control group. In contrast, preincubation of mast cells with anti-asthmatic drugs, cedarwood oil, cedrol, and CR-NLC showed a significant and dose-dependent inhibition of histamine release from mast cells, indicating their mast cell stabilizing activity. To determine SI, a parameter for the relative safety of drugs, IC50, CC50 values of anti-asthmatic drugs, cedarwood oil, cedrol, and CR-NLCs were determined as shown in Table 5 and Figure 7. Histamine release from mast cells was estimated from the standard histamine curve, and the percentage inhibition was calculated with respect to control histamine release (without effector). Table 5 shows that 50% inhibitory concentration (IC50) of NLC-C2 for histamine release from mast cells was least (10.5 μM) followed by NLC-C1 (17 μM) < cromolyn sodium (23 μM) < prednisolone (26 μM) < cedrol (35 μM). With respect to SI, NLC-C2 showed maximum selectivity (99.2) followed by NLC-C1 (64.1) > cedrol (25.2) > prednisolone (8.6) > cromolyn sodium (8.5) > cedarwood oil (7.9). Since SI value of CR-NLCs was >10 and much higher than standard anti-asthmatic drugs, we may expect CR-NLCs would be therapeutically safe for the amelioration of asthma, allergy, and rhinitis. Blank NLC had no effect on mast cell degranulation.
 | Table 5 Histamine release evaluation from mast cells in the presence of anti-histaminic drugs, cedarwood oil, cedrol, and cedrol-NLCa |
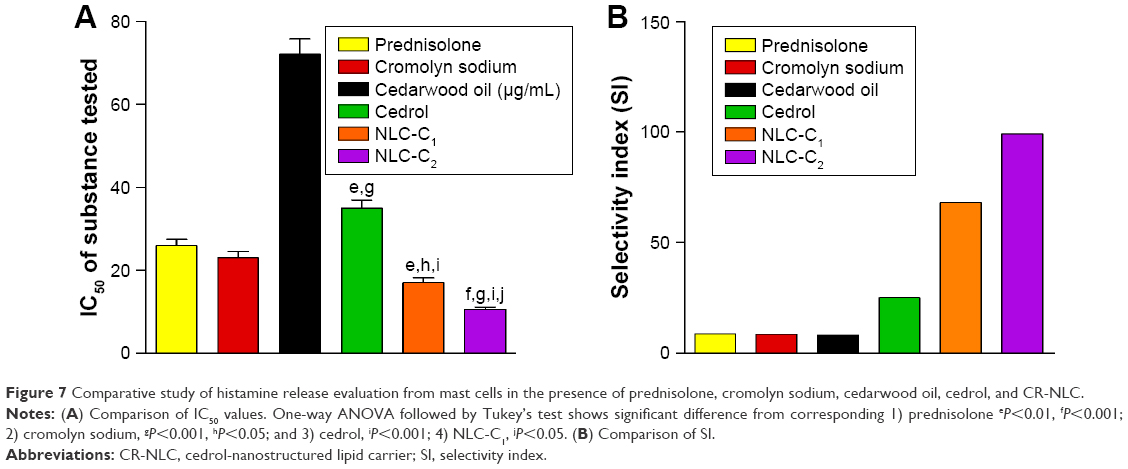 | Figure 7 Comparative study of histamine release evaluation from mast cells in the presence of prednisolone, cromolyn sodium, cedarwood oil, cedrol, and CR-NLC. |
Cedrol and CR-NLC inhibits compound 48/80-induced β-hexosaminidase release from mast cells
Degranulation marker β-hexosaminidase was determined by measuring the levels of secreted β-hexosaminidase from compound 48/80-sensitized mast cells.20 Preincubation of mast cells with anti-asthmatic drugs, cedrol, and CR-NLCs showed a dose-dependent inhibition of β-hexosaminidase release from compound 48/80-sensitized mast cells, indicating their mast cell stabilizing activity. Comparative analysis of SIs of the anti-asthmatic drug, cedrol, and CR-NLC-treated mast cells revealed highest SI of NLC-C2 (29.8) followed by NLC-C1 (23.6) > cromolyn sodium (9.28) > cedrol (7.3) > prednisolone (5). Table 6 reveals that in β-hexosaminidase degranulation model, SI of CR-NLCs was again >10 and higher than cromolyn sodium and cedrol. Our result indicates that CR-NLC is an effective and safe inhibitor of mast cell degranulation induced by compound 48/80.
 | Table 6 β-Hexosaminidase release inhibition from mast cells in the presence of anti-histaminic drug, cedrol, and cedrol-NLCa |
Measurement of intracellular calcium
Mast cell degranulation is a highly regulated Ca2+ dependent process.61,62 To investigate the mechanisms of cedrol and CR-NLC in histamine release inhibition, intracellular calcium levels were examined. Upon treatment with compound 48/80 (4 μg/mL), the intracellular calcium of mast cells gets stimulated which are presented in Figure 8A–C. Preincubation of cromolyn sodium (Figure 8A), cedrol (Figure 8B), and CR-NLC (Figure 8C) decreased intracellular calcium levels induced by compound 48/80. CR-NLC appears to have highest Ca2+ uptake inhibition property followed by cromolyn sodium and cedrol (Figure 8D).
 | Figure 8 Evaluation of the effect of cromolyn sodium, cedrol, and NLC-C2 on Ca2+ uptake study of mast cell by Fura-2-AM. |
Effects of oral cedrol and CR-NLC after different periods of pretreatment in the mice model of C-48/80-mediated systemic anaphylaxis
Systemic anaphylaxis was induced in mice by IP injection of 10 mg/kg of C-48/80. Systemic anaphylaxis was evaluated by death of mice which took place at 18±2 minutes (n=5). To determine the influence of the pretreatment period on the anaphylactic reaction, mice were given oral doses with standard anti-asthmatic drugs and cedrol before 1 hour and CR-NLCs before 1, 16, and 24 hours prior to induction of anaphylaxis by C-48/80. Cedrol and CR-NLC significantly attenuated anaphylactic death, suggesting that they prevented C-48/80-sensitized mast cell activation causing systemic anaphylaxis (Table 7), compared with administration of vehicles prior to secretagogue. However, CR-NLC treatment was more effective than free cedrol. We conducted Kaplan–Meier survival analysis to have the median survival time (Figure 9). The mice that survived >120 minutes were considered to survive the challenge. After pretreatment with prednisolone for 1 hour at 278 μmoles/kg and cromolyn sodium at 390 μmoles/kg, the reaction was inhibited and the mice survived >120 minutes compared to the vehicle group where mice died within 18±2 minutes. The effect increased with increase of dose. Thus, longer period of pretreatment (16 or 24 hours) further improved the efficacy of CR-NLC. Here it is worth to mention that when DL of cedrol increased from 7.23% to 14% and at a pretreatment dose of 450 μmoles/kg cedrol as NLCs, 24 hours before C-48/80 sensitization, median survival time increased from 28 to 75 min. In conclusion, cedrol and CR-NLC significantly inhibited the anaphylaxis reaction at tested time point in comparison with the negative control group and DL have significant influence on the efficacy of CR-NLC. This series of experiments in the anaphylaxis model strongly showed that CR-NLC is beneficial for the treatment of immediate type I hypersensitivity reactions and anaphylaxis.
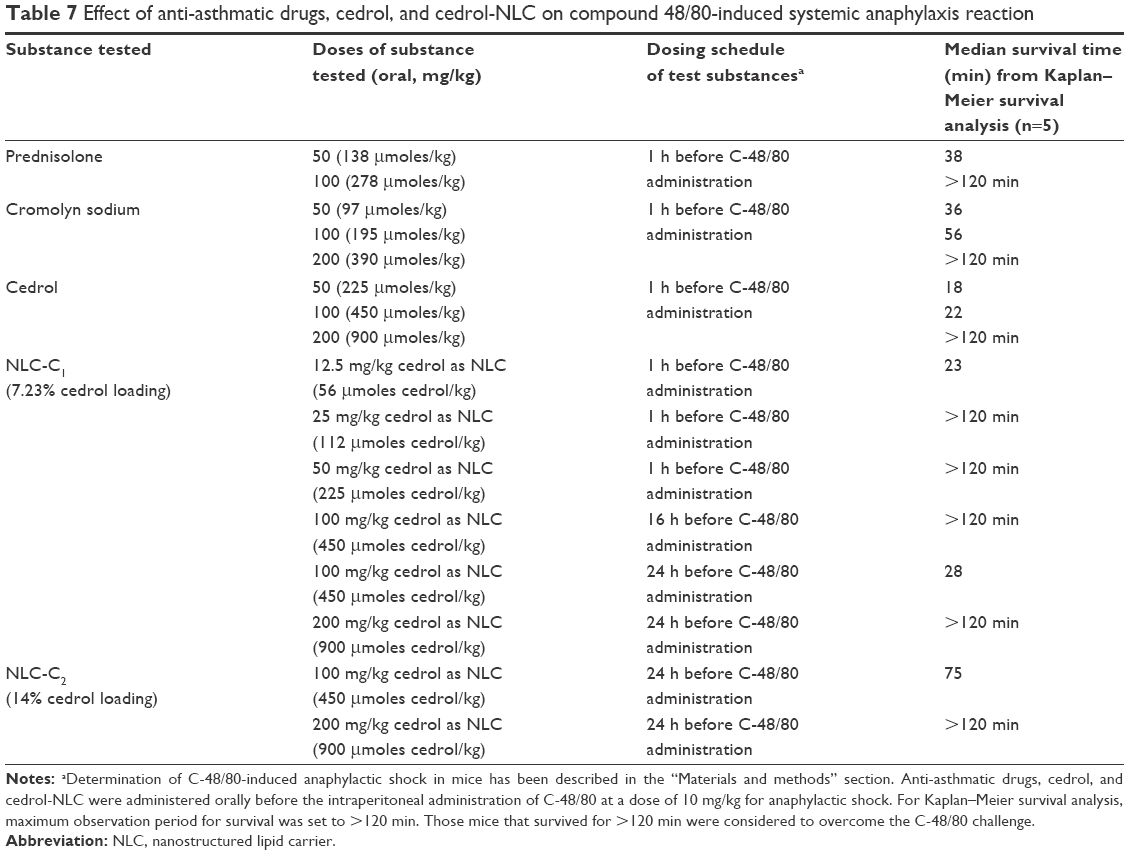 | Table 7 Effect of anti-asthmatic drugs, cedrol, and cedrol-NLC on compound 48/80-induced systemic anaphylaxis reaction |
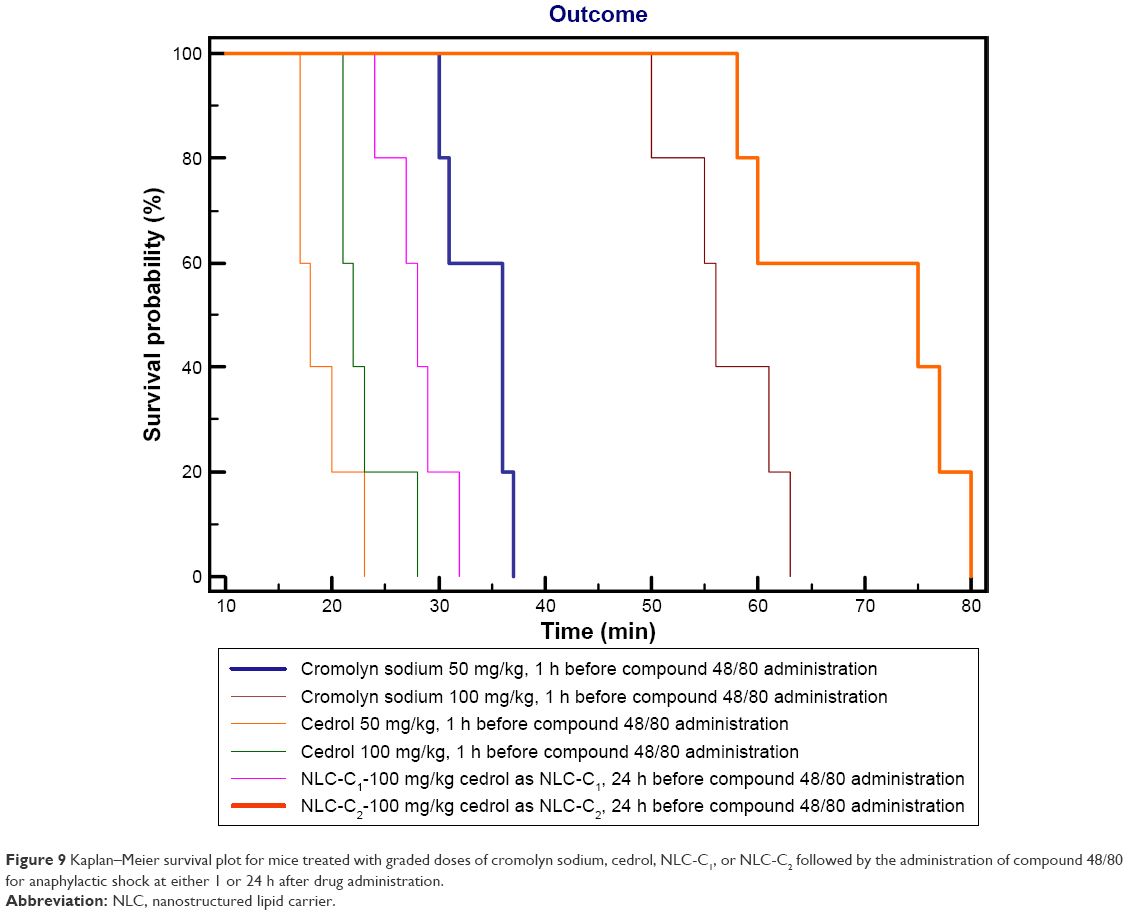 | Figure 9 Kaplan–Meier survival plot for mice treated with graded doses of cromolyn sodium, cedrol, NLC-C1, or NLC-C2 followed by the administration of compound 48/80 for anaphylactic shock at either 1 or 24 h after drug administration. |
Discussion
There is a well-known evidence that allergic diseases have debilitating effects on life.63 Allergic diseases such as asthma, allergic rhinitis, atopic dermatitis, anaphylactic reaction due to some drugs and food allergy are classified as type I allergy. In the allergic cascade, mast cells play a key role.64,65 Mast cells are derived from white blood cells and are widely distributed especially in connective tissue and mucosal surfaces. Systemic anaphylaxis is a life-threatening allergic reaction induced by rapid release of mediators like histamine, cytokines, chemokines, and lipid-derived mediators from mast cells.66 Therefore, mast cells are the key target for the development of mediators for allergic disorders. From previously published reports, it is a well-known fact that upon stimulation with compound 48/80 or IgE, the signal transduction pathway of mast cell becomes activated through G protein which leads to the release of histamine from it.67 As a result of it, calcium movement across the membrane increases leading to rising in intracellular Ca2+ level in mast cell.68,69 The fact that the Ca2+ chelator ethylenediaminetetraacetic acid abolishes the Ca2+ mobilization and mast cell degranulation that follow FcεR1 cross-linking proves intracellular Ca2+ concentration to be a potential target of regulation.70–72
This report presents the first study of the effects of the natural sesquiterpene cedrol and its nanoformulation CR-NLC on the compound 48/80-induced mast cell degranulation inhibition in vitro as well as early-phase type I hypersensitivity studies in vivo. The result shows that the release of histamine and β-hexosaminidase is strongly inhibited by cedrol and cedrol-NLC. Furthermore, it also inhibits systemic anaphylactic reaction in mice in vivo. The results are comparable or even superior to standard anti-allergic drugs like cromolyn sodium and prednisolone (Tables 5 and 7).
Poor oral bioavailability due to the poor water solubility of drugs and short half-life remains a great clinical issue in patients.73,74 Cedrol being a poorly water-soluble compound, a preparation with a long-acting effect is desirable. To improve the oral absorption and bioavailability of poorly water-soluble drugs, many nanocarriers like SLN and NLC are used extensively.75–77 NLC has gained attention because of biocompatibility, physicochemical stability, and ease of production.78
NLCs are known to improve the transportation of drug through the intestinal epithelial layer and render protection against the vicious environment of gastrointestinal tracts.79 Several theories have been proposed to explain the mechanism by which nanocarrier facilitates the oral bioavailability of drugs.80 For instance, absorbed lipid from NLC in enterocytes can be assembled into intestinal lipoprotein in the endoplasmic reticulum and Golgi body. The absorbed lipid is then selectively taken up by the intestinal lymphatic system after the lipid is exocytosed from the enterocytes.81 NLCs prepared with Compritol® 888 ATO were successfully utilized for oral, pulmonary delivery routes and had extended the release profile.82 Nanoparticles can be modified with specific stabilizers, such as vitamin E TPGS, Pluronic F127, and penetrating peptides; once modified, these nanoparticles can improve the oral bioavailability of drug by promoting cross static water level and cell membrane permeability.83
In an allergic reaction, mast cells are the key effector cells. They release a number of mediators along with histamine when exposed to foreign elements that trigger allergic symptoms like wheezing and shortness of breath. Many signaling molecules play a crucial role in the cascade of the allergic process of which PLCγ1 is the primary one. PLCγ1 is a membrane-associated enzyme which is tyrosine phosphorylated by Syk and Bruton’s TK upon mast cell activation. PLCγ1 catalyzes the cleavage of phospholipid PIP2 to secondary messengers like ionositol-1, 4, 5-triphosphate and diacyl glycerol. As a result, calcium from extracellular environment enters into the cell. Increase in cytosolic Ca2+ initiates mast cell degranulation and the onset of allergic reaction. Agents that prevent Ca2+ mobilization across the membrane and mediator release from mast cells are termed as mast cell stabilizers.84
Compound 48/80 is well known for its ability to induce anaphylactic reaction by releasing mediator from mast cell.85 The present study has demonstrated that cedrol and CR-NLCs inhibit compound 48/80-induced systemic anaphylaxis-like reactions in mice (Table 7). Free cedrol appears to be less potent than prednisolone and cromolyn sodium. In contrast, when cedrol was incorporated in NLC, the activity of cedrol to prevent compound 48/80-induced anaphylactic shock became much superior to prednisolone and cromolyn sodium. When formulation NLC-C1 was administered at a dose of 112 μmoles cedrol/kg 1 hour before the administration of compound 48/80, animal survived >120 minutes, whereas for prednisolone at a dose of 138 μmoles/kg survived for 38 minutes and for cromolyn sodium at a dose of 195 μmoles/kg animal survived for 56 minutes. Sustained release behavior is evident when 225 μmoles cedrol/kg was administered 1 hour before the administration of compound 48/80, the median survival time was 18 minutes, whereas when NLC-C1 was administered at the same dose 225 μmoles cedrol/kg as NLC, 1 hour before the administration of compound 48/80, the mice survived the challenge. Strikingly enough, when formulation NLC-C1 and NLC-C2 were administered at the same dose 450 μmoles cedrol/kg, 24 hours before the administration of compound 48/80, median survival time for mice were 28 minutes for formulation NLC-C1 and 75 minutes for formulation NLC-C2. Formulations NLC-C1 and NLC-C2 had their DL 7.23% and 14%, respectively. Thus, it appears that increased DL may increase efficacy of formulations. It is interesting to observe that SI of NLC-C2 (99.2) was much higher than NLC-C1 (64.1) and the standard drug prednisolone (8.6) and cromolyn sodium (8.5) (Table 5; Figure 7). In the process of degranulation of mast cell, secondary messenger like intracellular Ca2+ has a very critical role.86 Intracellular Ca2+ level regulates exocytosis from mast cells and also an expression of inflammatory cytokines.87 As calcium movement across the membrane of mast cell is associated with stimulation and secretion of mediator, its immobilization is the target for a drug to be called as effective antiallergic drugs.68 Data presented in this paper show that cedrol and CR-NLC pretreatment greatly affected compound 48/80-induced mast cell degranulation and histamine release from the mice peritoneal mast cells. A close correlation between the concentration of the histamine, β-hexosaminidase-releasing stimulus, calcium ion influx, and the amount of released histamine, β-hexosaminidase suggest a cause-and-effect relationship between the influx of Ca2+ and the release of both histamine and β-hexosaminidase (Tables 5 and 6; Figures 7 and 8). The compound 48/80 causes increase in Ca2+ uptake and release of histamine, but pretreatment with cedrol and CR-NLC inhibits the compound 48/80-induced Ca2+ uptake into the mast cells. The inhibitory effect of CR-NLC on histamine release and Ca2+ uptake induced by compound 48/80 was more potent than cedrol and cromolyn sodium (Table 5, Figure 8). These observations strongly indicate the inhibitory effects of cedrol and CR-NLC on the release of histamine and decrease in intracellular Ca2+ levels seems to play an important role in the process.
Conclusion
The purpose of this study was to assess the feasibility of using NLC to promote the oral absorption of cedrol. The controlled release was achieved by the lipid matrix with Compritol® 888 ATO and triolein stabilized by vitamin E TPGS, soya lecithin, and sodium deoxycholate. Our finding provides evidence that cedrol and CR-NLC inhibit mast-cell-derived type I hypersensitivity reaction by blocking Ca2+ uptake and histamine release in mast cells. In vitro and in vivo antiallergic effects of CR-NLC suggest a possible therapeutic application against inflammatory allergic diseases. NLC could be a promising vehicle for oral delivery of cedrol to improve its antiallergic properties.
Acknowledgments
The first author acknowledges the support of INSPIRE fellowship, DST, Govt. of India. Our group would like to thank the Director of Indian Association of Cultivation of Science Kolkata, Director of Bose Institute, Kolkata, Director of Sophisticated Test and Instrumentation Centre, Kerala, Director of The Indian School of Mines, Dhanbad for providing us instrumental facility and Dr Abhijit Hazra, SSKM Hospital, Kolkata for statistical assistance.
Disclosure
The authors report no conflicts of interest in this work.
References
Devereux G. The increase in the prevalence of asthma and allergy: food for thought. Nat Rev Immunol. 2006;6(11):869–874. | ||
Bloemen K, Verstraelen S, Van Den Heuvel R, Witters H, Nelissen I, Schoeters G. The allergic cascade: review of the most important molecules in the asthmatic lung. Immunol Lett. 2007;113(1):6–18. | ||
Finkelman FD. Anaphylaxis: lessons from mouse models. J Allergy Clin Immunol. 2007;120(3):506–515. | ||
Galli SJ, Tsai M, Piliponsky AM. The development of allergic inflammation. Nature. 2008;454(7203):445–454. | ||
Medoff BD, Thomas SY, Luster AD. T cell trafficking in allergic asthma: the ins and outs. Annu Rev Immunol. 2008;26:205–232. | ||
Kalesnikoff J, Galli SJ. New developments in mast cell biology. Nat Immunol. 2008;9(11):1215–1223. | ||
Baumruker T, Prieschl E. Mast cells and their activation-from the molecular mechanism to clinical relevance. Mod Asp Immunobiol. 2001;1(6):256–262. | ||
Marshall JS. Mast-cell responses to pathogens. Nat Rev Immunol. 2004;4(10):787–799. | ||
Baroody FM, Naclerio RM. Antiallergic effects of H1-receptor antagonists. Allergy. 2000;55(Suppl 64):17–27. | ||
Rizzo MC, Solé D. Inhaled corticosteroids in the treatment of respiratory allergy: safety vs. efficacy. J Pediatr (Rio J). 2006;82(5):S198–S205. | ||
Newman DJ, Cragg GM. Natural products as sources of new drugs over the 30 years from 1981 to 2010. J Nat Prod. 2012;75(3):311–335. | ||
Chen ST, Dou J, Temple R, Agarwal R, Wu KM, Walker S. New therapies from old medicines. Nat Biotechnol. 2008;26(10):1077–1083. | ||
Lee SL, Dou JH, Agarwal R, et al. Evolution of traditional medicines to botanical drugs. Science. 2015;347(6219):S32–S34. | ||
Dai Y, Hou LF, Chan YP, Cheng L, But PP. Inhibition of immediate allergic reactions by ethanol extract from Plumbago zeylanica stems. Biol Pharm Bull. 2004;27(3):429–432. | ||
Chai OH, Lee MS, Han EH, Kim HT, Song CH. Inhibitory effects of Morus alba on compound 48/80-induced anaphylactic reactions and anti-chicken gamma globulin IgE-mediated mast cell activation. Biol Pharm Bull. 2005;28(10):1852–1858. | ||
Jiang S, Nakano Y, Yatsuzuka R, Ono R, Kamei C. Inhibitory effects of Moutan cortex on immediate allergic reactions. Biol Pharm Bull. 2007;30(9):1707–1710. | ||
Brito FA, Lima LA, Ramos MF, et al. Pharmacological study of anti-allergic activity of Syzygium cumini (L.) Skeels. Braz J Med Biol Res. 2007;40(1):105–115. | ||
Bao Z, Guan S, Cheng C, et al. A novel antiinflammatory role for andrographolide in asthma via inhibition of the nuclear factor-κB pathway. Am J Respir Crit Care Med. 2009;179(8):657–665. | ||
Park YK, Jung HW, Jung JK. Antiallergic effect of Ostericum koreanum root extract on ovalbumin-induced allergic rhinitis mouse model and mast cells. Asian Pac J Allergy Immunol. 2011;29(4):338–348. | ||
Yoo JM, Kim JH, Park SJ, Kang YJ, Kim TJ. Inhibitory effect of eriodictyol on IgE/Ag-induced type I hypersensitivity. Biosci Biotechnol Biochem. 2012;76(7):1285–1290. | ||
Ashwini Y, Rafiq M, Viswanatha GL, et al. Polyherbal formulation Bresol® protects the mast cells against compound 48/80-induced disruption and histamine release: a non-immunological mechanism of mast cell stabilization. Zhong xi yi jie he xue bao. 2012;10(6):690–694. | ||
Newman DJ, Cragg GM. Natural products as sources of new drugs over the last 25 years. J Nat Prod. 2007;70(3):461–477. | ||
Duquesnoy E, Dinh NH, Castola V, Casanova J. Composition of a pyrolytic oil from Cupressus funebris Endl. of Vietnamese origin. Flavour Fragr J. 2006;21(3):453–457. | ||
Park TS, Kim HW. Uses of sesquiterpene derivatives. United States patent US 8481592. 2013 July 9. | ||
Umeno K, Hori E, Tsubota M, et al. Effects of direct cedrol inhalation into the lower airway on autonomic nervous activity in totally laryngectomized subjects. Br J Clin Pharmacol. 2008;65(2):188–196. | ||
Hori E, Shojaku H, Watanabe N, et al. Effects of direct cedrol inhalation into the lower airway on brain hemodynamics in totally laryngectomized subjects. Auton Neurosci. 2012;168(1):88–92. | ||
Jin MH, Park SG, Hwang YL, et al. Cedrol enhances extracellular matrix production in dermal fibroblasts in a MAPK-dependent manner. Ann Dermatol. 2012;24(1):16–21. | ||
Jantan I, Rafi IA, Jalil J. Platelet-activating factor (PAF) receptor-binding antagonist activity of Malaysian medicinal plants. Phytomedicine. 2005;12(1):88–92. | ||
Jantan I, Pisar MM, Idris MS, Taher M, Ali RM. In vitro inhibitory effect of rubraxanthone isolated from Garcinia parvifolia on platelet-activating factor receptor binding. Planta Med. 2002;68(12):1133–1134. | ||
Jenner KJ, Kreutzer G, Racine P. Persistency assessment and aerobic biodegradation of selected cyclic sesquiterpenes present in essential oils. Environ Toxicol Chem. 2011;30(5):1096–1108. | ||
Zhang Z, Tan S, Feng SS. Vitamin E TPGS as a molecular biomaterial for drug delivery. Biomaterials. 2012;33(19):4889–4906. | ||
Win KY, Feng SS. Effects of particle size and surface coating on cellular uptake of polymeric nanoparticles for oral delivery of anticancer drugs. Biomaterials. 2005;26(15):2713–2722. | ||
Zhang Z, Lee SH, Gan CW, Feng SS. In vitro and in vivo investigation on PLA–TPGS nanoparticles for controlled and sustained small molecule chemotherapy. Pharm Res. 2008;25(8):1925–1935. | ||
Zhang Z, Feng SS. Nanoparticles of poly (lactide)/vitamin E TPGS copolymer for cancer chemotherapy: synthesis, formulation, characterization and in vitro drug release. Biomaterials. 2006;27(2):262–270. | ||
Stand F, Ceckova M, Micuda S, Pavek P. Expression and function of P-glycoprotein in normal tissues: effect on pharmacokinetics. Methods Mol Biol. 2010;596:199–222. | ||
Werle M. Natural and synthetic polymers as inhibitors of drug efflux pumps. Pharm Res. 2008;25(3):500–511. | ||
Rege BD, Kao JP, Polli JE. Effects of nonionic surfactants on membrane transporters in Caco-2 cell monolayers. Eur J Pharm Sci. 2002;16(4):237–246. | ||
Fang CL, Al-Suwayeh SA, Fang JY. Nanostructured lipid carriers (NLCs) for drug delivery and targeting. Recent Pat Nanotechnol. 2013;7(1):41–55. | ||
Prades J, Funari SS, Escribá PV, Barceló F. Effects of unsaturated fatty acids and triacylglycerols on phosphatidylethanolamine membrane structure. J Lipid Res. 2003;44(9):1720–1727. | ||
Alanazi F, Fu ZF, Lu DR. Effective transfection of rabies DNA vaccine in cell culture using an artificial lipoprotein carrier system. Pharm Res. 2004;21(4):675–682. | ||
Pan G, Shawer M, Øie S, Lu DR. In vitro gene transfection in human glioma cells using a novel and less cytotoxic artificial lipoprotein delivery system. Pharm Res. 2003;20(5):738–744. | ||
Wang MT, Jin Y, Yang YX, et al. In vivo biodistribution, anti-inflammatory, and hepatoprotective effects of liver targeting dexamethasone acetate loaded nanostructured lipid carrier system. Int J Nanomedicine. 2010;5:487–497. | ||
Wolfgang S, editor. Sample preparation. In: Light Scattering from Polymer Solutions and Nanoparticle Dispersions. Berlin: Springer Berlin Hidelberg GmBH & Co. KG; 2007:43–44. | ||
Martin A. Physical Pharmacy. 4th ed. Philadelphia, PA: Lippincott Williams & Wilkins; 1993:386–388. | ||
Snyder LR, Kirkland JJ, Glajch JL, editors. Non-ionic samples: reversed- and normal-phase HPLC. In: Practical HPLC Method Development. 2nd ed. New York: John Wiley & Sons; 2012:264–267. | ||
de Oliveira Barreto E, de Frias Carvalho V, Diaz BL, et al. Adoptive transfer of mast cells abolishes the inflammatory refractoriness to allergen in diabetic rats. Int Arch Allergy Immunol. 2003;131(3):212–220. | ||
Meurer SK, Neß M, Weiskirchen S, et al. Isolation of mature (peritoneum-derived) mast cells and immature (bone marrow-derived) mast cell precursors from mice. PLoS One. 2016;11(6):e0158104. | ||
Ikarashi Y, Yuzurihara M, Sakakibara I, Takahashi A, Ishimaru H, Maruyama Y. Effects of an oriental herbal medicine,“Saiboku-to”, and its constituent herbs on compound 48/80-induced histamine release from peritoneal mast cells in rats. Phytomedicine. 2001;8(1):8–15. | ||
Inoue T, Sugimoto Y, Masuda H, Kamei C. Antiallergic effect of flavonoid glycosides obtained from Mentha piperita L. Biol Pharm Bull. 2002;25(2):256–259. | ||
Jung CH, Lee JY, Cho CH, Kim CJ. Anti-asthmatic action of quercetin and rutin in conscious guinea-pigs challenged with aerosolized ovalbumin. Arch Pharm Res. 2007;30(12):1599–1607. | ||
Kim SH, Kim SH, Kim SH, et al. Action of Dracocephalum argunense on mast cell-mediated allergy model. Biol Pharm Bull. 2006;29(3):494–498. | ||
Nwaka S, Hudson A. Innovative lead discovery strategies for tropical diseases. Nat Rev Drug Discov. 2006;5(11):941–955. | ||
Chakraborty S, Shukla D, Mishra B, Singh S. Lipid – an emerging platform for oral delivery of drugs with poor bioavailability. Eur J Pharm Biopharm. 2009;73(1):1–15. | ||
Breunig M, Bauer S, Göpferich A. Polymers and nanoparticles: intelligent tools for intracellular targeting? Eur J Pharm Biopharm. 2008;68(1):112–128. | ||
Ishihara T, Mizushima T. Techniques for efficient entrapment of pharmaceuticals in biodegradable solid micro/nanoparticles. Expert Opin Drug Deliv. 2010;7(5):565–575. | ||
Mondal S, Roy P, Das S, Halder A, Mukherjee A, Bera T. In vitro susceptibilities of wild and drug resistant leishmania donovani amastigote stages to andrographolide nanoparticle: role of vitamin E derivative TPGS for nanoparticle efficacy. PLoS One. 2013;8(12):e81492. | ||
Kumar M, Kakkar V, Mishra AK, Chuttani K, Kaur IP. Intranasal delivery of streptomycin sulfate (STRS) loaded solid lipid nanoparticles to brain and blood. Int J Pharm. 2014;461(1):223–233. | ||
Mehta AK, Yadav KS, Sawant KK. Nimodipine loaded PLGA nanoparticles: formulation optimization using factorial design, characterization and in vitro evaluation. Curr Drug Deliv. 2007;4(3):185–193. | ||
Korsmeyer RW, Gurny R, Doelker E, Buri P, Peppas NA. Mechanisms of solute release from porous hydrophilic polymers. Int J Pharm. 1983;15(1):25–35. | ||
Shore PA, Burkhalter A, Cohn VH. A method for the fluorometric assay of histamine in tissues. J Pharmacol Exp Ther. 1959;127(3):182–186. | ||
Melicoff E, Sansores-Garcia L, Gomez A, et al. Synaptotagmin-2 controls regulated exocytosis but not other secretory responses of mast cells. J Biol Chem. 2009;284(29):19445–19451. | ||
Beaven MA, Metzger H. Signal transduction by Fc receptors: the Fc&RI case. Immunol Today. 1993;14(5):222–226. | ||
Jung ID, Lee HS, Lee HY, Choi OH. FcεRI-mediated mast cell migration: signaling pathways and dependence on cytosolic free Ca2+ concentration. Cell Signal. 2009;21(11):1698–1705. | ||
Galli SJ, Kalesnikoff J, Grimbaldeston MA, Piliponsky AM, Williams CM, Tsai M. Mast cells as “tunable” effector and immunoregulatory cells: recent advances. Annu Rev Immunol. 2005;23:749–786. | ||
Galli SJ, Grimbaldeston M, Tsai M. Immunomodulatory mast cells: negative, as well as positive, regulators of immunity. Nat Rev Immunol. 2008;8(6):478–486. | ||
Galli SJ, Tsai M. IgE and mast cells in allergic disease. Nat Med. 2012;18(5):693–704. | ||
Palomäki VA, Laitinen JT. The basic secretagogue compound 48/80 activates G proteins indirectly via stimulation of phospholipase D-lysophosphatidic acid receptor axis and 5-HT1A receptors in rat brain sections. Br J Pharmacol. 2006;147(6):596–606. | ||
Ma HT, Beaven MA. Regulators of Ca2+ signaling in mast cells: potential targets for treatment of mast cell-related diseases? Adv Exp Med Biol. 2011;716:62–90. | ||
Manikandan J, Kothandaraman N, Hande MP, Pushparaj PN. Deciphering the structure and function of FcεRI/mast cell axis in the regulation of allergy and anaphylaxis: a functional genomics paradigm. Cell Mol Life Sci. 2012;69(12):1917–1929. | ||
Baba Y, Nishida K, Fujii Y, Hirano T, Hikida M, Kurosaki T. Essential function for the calcium sensor STIM1 in mast cell activation and anaphylactic responses. Nat Immunol. 2008;9(1):81–88. | ||
Vig M, Kinet JP. Calcium signaling in immune cells. Nat Immunol. 2009;10(1):21–27. | ||
Zaitsu M, Narita SI, Lambert KC, et al. Estradiol activates mast cells via a non-genomic estrogen receptor-α and calcium influx. Mol Immunol. 2007;44(8):1977–1985. | ||
Soudry-Kochavi L, Naraykin N, Nassar T, Benita S. Improved oral absorption of exenatide using an original nanoencapsulation and microencapsulation approach. J Control Release. 2015;217:202–210. | ||
Wang J, Li L, Du Y, et al. Improved oral absorption of doxorubicin by amphiphilic copolymer of lysine-linked ditocopherol polyethylene glycol 2000 succinate: in vitro characterization and in vivo evaluation. Mol Pharm. 2015;12(2):463–473. | ||
Chen D, Xia D, Li X, et al. Comparative study of Pluronic® F127-modified liposomes and chitosan-modified liposomes for mucus penetration and oral absorption of cyclosporine A in rats. Int J Pharm. 2013;449(1):1–9. | ||
Mo R, Jin X, Li N, et al. The mechanism of enhancement on oral absorption of paclitaxel by N-octyl-O-sulfate chitosan micelles. Biomaterials. 2011;32(20):4609–4620. | ||
Luo Y, Teng Z, Li Y, Wang Q. Solid lipid nanoparticles for oral drug delivery: chitosan coating improves stability, controlled delivery, mucoadhesion and cellular uptake. Carbohydr Polym. 2015;122:221–229. | ||
Muchow M, Maincent P, Müller RH. Lipid nanoparticles with a solid matrix (SLN®, NLC®, LDC®) for oral drug delivery. Drug Dev Ind Pharm. 2008;34(12):1394–1405. | ||
Severino P, Andreani T, Macedo AS, et al. Current state-of-art and new trends on lipid nanoparticles (SLN and NLC) for oral drug delivery. J Drug Deliv. 2011;2012:750891. | ||
Zhang J, Li J, Ju Y, Fu Y, Gong T, Zhang Z. Mechanism of enhanced oral absorption of morin by phospholipid complex based self-nanoemulsifying drug delivery system. Mol Pharm. 2015;12(2):504–513. | ||
Zhang Z, Gao F, Bu H, Xiao J, Li Y. Solid lipid nanoparticles loading candesartan cilexetil enhance oral bioavailability: in vitro characteristics and absorption mechanism in rats. Nanomedicine. 2012;8(5):740–747. | ||
Aburahma MH, Badr-Eldin SM. Compritol 888 ATO: a multifunctional lipid excipient in drug delivery systems and nanopharmaceuticals. Expert Opin Drug Deliv. 2014;11(12):1865–1883. | ||
Shan W, Zhu X, Liu M, et al. Overcoming the diffusion barrier of mucus and absorption barrier of epithelium by self-assembled nanoparticles for oral delivery of insulin. ACS Nano. 2015;9(3):2345–2356. | ||
Finn DF, Walsh JJ. Twenty-first century mast cell stabilizers. Br J Pharmacol. 2013;170(1):23–37. | ||
Nishikawa H, Kitani S. Tea catechins have dual effect on mast cell degranulation induced by compound 48/80. Int Immunopharmacol. 2008;8(9):1207–1215. | ||
Vig M, Dehaven WI, Bird GS, et al. Defective mast cell effector functions in mice lacking the CRACM1 pore subunit of store-operated calcium release-activated calcium channels. Nat Immunol. 2008;9(1):89–96. | ||
Tanaka S, Mikura S, Hashimoto E, Sugimoto Y, Ichikawa A. Ca2+ influx-mediated histamine synthesis and IL-6 release in mast cells activated by monomeric IgE. Eur J Immunol. 2005;35(2):460–468. | ||
World Health Organization. Media centre: Bronchial asthma. Available from: http://www.who.int/mediacentre/factsheets/fs206/en/. Accessed June 1, 2017. |
 © 2017 The Author(s). This work is published and licensed by Dove Medical Press Limited. The
full terms of this license are available at https://www.dovepress.com/terms
and incorporate the Creative Commons Attribution
- Non Commercial (unported, 3.0) License.
By accessing the work you hereby accept the Terms. Non-commercial uses of the work are permitted
without any further permission from Dove Medical Press Limited, provided the work is properly
attributed. For permission for commercial use of this work, please see paragraphs 4.2 and 5 of our Terms.
© 2017 The Author(s). This work is published and licensed by Dove Medical Press Limited. The
full terms of this license are available at https://www.dovepress.com/terms
and incorporate the Creative Commons Attribution
- Non Commercial (unported, 3.0) License.
By accessing the work you hereby accept the Terms. Non-commercial uses of the work are permitted
without any further permission from Dove Medical Press Limited, provided the work is properly
attributed. For permission for commercial use of this work, please see paragraphs 4.2 and 5 of our Terms.