
Back to Journals » Research and Reports in Urology » Volume 17
Influencing Factors and Risk Prediction Model Construction of Urinary Tract Infections in Patients with Bladder Cancer
Authors Di Y, Zhang L, Zhao L, Yin L
Received 5 June 2025
Accepted for publication 15 September 2025
Published 30 September 2025 Volume 2025:17 Pages 383—399
DOI https://doi.org/10.2147/RRU.S545001
Checked for plagiarism Yes
Review by Single anonymous peer review
Peer reviewer comments 2
Editor who approved publication: Professor Guglielmo Mantica
Yancheng Di, Lingling Zhang, Linlin Zhao, Lei Yin
Department of Urology, Hongqi Hospital Affiliated to Mudanjiang Medical University, Mudanjiang, 157000, People’s Republic of China
Correspondence: Lei Yin, Department of Urology, Hongqi Hospital Affiliated to Mudanjiang Medical University, No. 5 Tongxiang Road, Aimin District, Mudanjiang, 157000, People’s Republic of China, Email [email protected]
Purpose: Urinary tract infections (UTI) are a common complication in patients with bladder cancer (BLCA). This study investigated the role of stearoyl-CoA desaturase-1 (SCD1) in BLCA progression and assessed its potential as a biomarker for predicting UTI risk in BLCA patients.
Patients and Methods: SCD1 expression profiles were evaluated in BLCA patients with concurrent UTI. Receiver operating characteristic curve analysis was used to assess the diagnostic value of SCD1 for predicting UTI risk. In vitro assays were conducted to explore the functional role of SCD1 in lipopolysaccharide (LPS)-associated BLCA progression.
Results: SCD1 expression was significantly higher in the UTI group compared with the non-UTI group (p = 0.000 and 0.011, respectively). The combination of SCD1, immune-inflammation index, and C-reactive protein demonstrated strong predictive value for UTI risk in BLCA patients (non-muscle invasive BLCA patients: area under the curve (AUC) = 0.887; 95% CI: 0.821– 0.935; muscle-invasive BLCA patients: AUC = 0.861; 95% CI: 0.767– 0.927). Functional experiments revealed that lipopolysaccharide (LPS)-induced SCD1 expression promoted autophagy and enhanced malignant phenotypes, whereas SCD1 inhibition or treatment with an autophagosome inhibitor reversed these effects.
Conclusion: SCD1 promotes LPS-associated BLCA progression by regulating autophagy and may serve as a valuable biomarker for predicting UTI risk in BLCA patients.
Keywords: bladder cancer, urinary tract infections, stearoyl-CoA desaturase 1, autophagy, biomarker
Graphical Abstract:

Introduction
Bladder cancer (BLCA) is the tenth most prevalent malignancy worldwide and the second most common urological cancer.1 In 2022, more than 610,000 new cases and over 220,000 deaths were reported globally.2 BLCA arises primarily from the epithelial tissue of the urinary tract. At diagnosis, urothelial carcinoma is classified as non-muscle invasive bladder cancer (NMIBC), including stages Ta and T1, which account for approximately 80% of all BLCA cases. Standard NMIBC treatment involves transurethral resection of bladder tumor (TURBT), followed by intravesical treatment with agents such as mitomycin C or Bacille Calmette-Guérin, to reduce recurrence risk. Muscle-invasive bladder cancer (MIBC), including stages T2, T3, and T4, represents approximately 20% of BLCA cases and is generally treated through radical cystectomy plus platinum-based neoadjuvant chemotherapy.3 Approximately 12.5% of patients initially diagnosed as NMIBC may eventually progress to MIBC, a transition associated with significantly higher mortality risk.4 BLCA patients are particularly susceptible to urinary tract infections (UTI) due to surgical trauma, urethral mucosa injury, retrograde manipulation during procedures, and irritation caused by chemotherapy drugs. Postoperative UTI can undermine treatment effectiveness and worsen prognosis by increasing metastasis and recurrence rates.5 Therefore, identifying factors influencing UTI risk during BLCA treatment is essential for early infection prevention and better patient outcomes. There is an urgent need for novel UTI biomarkers and intervention strategies to address infection-related complications in BLCA.
Inflammation is a host defense response to pathogens such as bacteria and viruses, but it also plays a pivotal regulatory role in tumor biology, including immunosuppression, angiogenesis, and tumor cell proliferation and metastasis. Inflammation serves as a critical driver in various cancers.6 The inflammatory microenvironment can also promote angiogenesis and disease progression in BLCA.7 Lipopolysaccharide (LPS), a major component of gram-negative bacterial cell membranes, is a potent inflammatory mediator. It can trigger a cascade of protein interactions during cancer development, thereby stimulating pro-inflammatory cytokine and interferon production.8 LPS can upregulate NLRP3 expression, which participates in inflammatory responses and is implicated in the progression of multiple cancers such as colorectal cancer, breast cancer, and gastric cancer.9–11 LPS can also induce autophagy by activating Toll-like receptor 4 (TLR4) and TLR3, facilitating cell migration and invasion in lung cancer.12 Autophagy, a cellular degradation pathway, is involved in diverse physiological functions, including intracellular bacterial clearance,13 inflammatory cytokine secretion,14 inflammatory response regulation, antigen presentation,15 and lymphocyte development. Its role in cancer is complex and context-dependent, regulating both disease initiation and progression. This role varies according to tumor stage, biological characteristics, and microenvironment.16 This dual role of autophagy has been elucidated from tumor cell biology to clinical trials, impaired autophagy can exacerbate inflammation and increase malignancy risk. However, the role of autophagy in LPS-associated BLCA remains inadequately elucidated, and its underlying mechanisms require further investigation.
As it regulates cellular homeostasis, autophagy sustains cell survival under nutrient deprivation or hypoxia by degrading lipid droplets to release reserve substances such as free fatty acids.17 Being closely associated with lipid metabolism, autophagy serves as a critical node linking energy metabolism and cellular fate. Stearoyl-CoA desaturase 1 (SCD1) is a key enzyme in lipid metabolism that exerts delta-9 desaturase activity, thus converting saturated fatty acids (SFAs) into monounsaturated fatty acids (MUFAs). SCD1 regulates autophagy initiation through a unique dual-pathway mechanism, namely by altering membrane phospholipid composition to enhance endoplasmic reticulum (ER) membrane fluidity, thus facilitating autophagosome nucleation and producing unsaturated fatty acids such as oleic acid, which induce membrane curvature changes through steric effects.18 Notably, dysfunctional SCD1 impairs autophagosome maturation and triggers abnormal ER stress, mitochondrial dysfunction, and apoptosis. Although SCD1’s positive role in autophagy has been established using multiple models, its regulatory functions in the tumor microenvironment exhibit tissue-specific heterogeneity, particularly in inflammation-associated BLCA progression, where its mechanism remains unexplored.
The biological significance of SCD1 manifests in two dimensions: clinically, its expression is significantly correlated with tumor aggressiveness and poor prognosis. Mechanistically, it is a central link between lipid metabolism, autophagy, and inflammation. However, ① the dynamic regulatory mechanisms of SCD1-mediated autophagy in the inflammatory BLCA microenvironment are not fully understood, and ② a validated biomarker system for predicting UTI risk in BLCA patients is lacking. This study addresses these gaps by 1) elucidating the regulatory mechanisms of the SCD1–autophagy axis in LPS-associated BLCA progression and 2) identifying inflammation-related molecular biomarkers for UTI risk assessment in BLCA patients. These findings offer a theoretical foundation for developing novel BLCA prognostic evaluation strategies based on metabolic autophagy regulation.
Materials and Methods
Patients and Samples
During January 2018–2021, preoperative serum specimens and postoperative tumor tissues were collected from 215 patients treated at the Hongqi Hospital affiliated to Mudanjiang Medical University (Mudanjiang, China). This cohort included 133 NMIBC patients and 82 MIBC patients; the former underwent transurethral resection of bladder tumor (TURBT) followed by intravesical chemotherapy, and the latter were managed with radical cystectomy. All specimens were clinically and histologically confirmed by the Hongqi Hospital. The NMIBC patients were stratified into two groups based on their UTI status: non-UTI (n = 73; 42 males, 31 females, age: 38–84 [64.33 ±11.53] years) and UTI (n = 60;34 males, 26 females, age: 40–86 [63.72 ±10.14] years). Similarly, the MIBC patients were assigned to the following groups: non-UTI (n = 46;29 males, 17 females, age: 39–81 [62.77 ±9.82] years) and UTI (n = 36; 22 males, 14 females, age: 40–84 [63.59 ±11.24] years). The subject inclusion criteria were as follows: (i) age ≥18 years, (ii) BLCA as the first primary tumor, (iii) no prior treatment with chemotherapy, radiotherapy, biologic therapy, or hormonal therapy, (iv) availability of comprehensive clinicopathological data, demographic details, and follow-up records. The exclusion criteria were as follow: (i) patients exposed to clinical therapy before serum collection, (ii) those with concurrent other types of malignant tumors, (iii) those with confirmed distant metastasis before treatment, (iv) those with other renal or urological disorders, (v) active severe infection in other systems, (vi) antibiotic treatment within 3 weeks before the enrollment, (vii) hematological or immunologic diseases. All participants provided written informed consent before enrollment, and the study protocol received approval from the Ethics Committee of the Hongqi Hospital Affiliated to Mudanjiang Medical University.
Diagnostic Criteria for UTI
Symptomatic cases: UTI-associated symptoms (such as dysuria, urinary frequency/urgency, fever, chills, or bacteremia) along with a midstream clean-catch urine culture with ≥105 CFU/mL for bacilli or ≥104 CFU/mL for cocci. Asymptomatic cases included two consecutive midstream urine cultures (clean-catch) with ≥105 CFU/mL of the same bacterial strain, irrespective of the symptoms.19
Data Collection
The following data were collected: age, gender, tumor diameter, tumor number, histological type, tumor stage (T: Tumor size; N: lymph Nodes; M: Metastasis), The American Joint Committee on Cancer (AJCC) stage, myometrial invasion, and initial treatment methods (such as surgery, chemotherapy, or radiotherapy). The test records were gathered, including urinalysis, biochemical routine, urine bacterial culture, and cystoscopy reports. Clinical laboratory parameters included the absolute neutrophil count, absolute lymphocyte count, platelet count, and C-reactive protein (CRP). Systemic immune-inflammation index (SII) was derived using the following formula: platelet count (×109/L) × neutrophil count (×109/L)/lymphocyte count (×109/L).
Follow-up and Clinical Outcomes Assessment
Overall survival (OS) was defined as the duration from surgery until the last follow-up or death, whereas progression-free survival (PFS) was defined as the time between the initiation of treatment until disease progression (indicated by tumor recurrence/progression or spread) or death from any cause. Among the 215 patients, 139 underwent bladder-sparing surgery. For the 108 patients who received cystoscopy every 3 months for the first 2 years, every 6 months for 2–4 years, and then annually thereafter. The remaining 76 patients, who underwent radical cystectomy, undertook abdominal and pelvic CT every 3 months for the first 2 years, every 6 months for 2–4 years, and then annually thereafter. The recurrence was considered as histopathological evidence of abnormal bladder mucosa or BLCA tissue post-surgery. For the 133 patients with NMIBC who received intravesical chemotherapy, the chemotherapy failure was considered indicative of BLCA recurrence or progression.
Grouping
The concentrations of serum SCD1 were quantified using commercial enzyme-linked immunosorbent assay kits (Xuanzekang, Shanghai) in accordance with the manufacturer’s protocol. Based on the receiver operating characteristic (ROC) curve analysis, NMIBC patients were stratified into high (≥5.46 ng/mL) or low (<5.46 ng/mL) SCD1-expression groups, and the MIBC patients were stratified into high (≥4.33 ng/mL) and low (<4.33 ng/mL) SCD1-expression groups based on the optimal cut-off value.
Bioinformatics Analysis
The expression profiles of SCD1 in BLCA were obtained from The Cancer Genome Atlas (TCGA) (http://portal.gdc.cancer.gov) and the Gene Expression Profiling Interactive Analysis (GEPIA) platform (http://gepia.cancer-pku.cn/). The OS and PFS of BLCA patients were evaluated by using the Kaplan–Meier plotter (http://kmplot.com/analysis).
Cell Culture and Treatments
Human BLCA cell lines UMUC3 were purchased from the Shanghai Institutes of Biological Sciences (Shanghai, China). The cells were maintained in Dulbecco’s modified Eagle’s medium (DMEM; Life Technologies, Carlsbad, CA, USA) supplemented with 10% fetal bovine serum (FBS; Life Technologies) and a combination of 100 IU/mL penicillin and 100 IU/mL streptomycin (Invitrogen, Carlsbad, CA, USA). The cells were incubated at 37°C in a humidified incubator with 5% CO2. All experimental procedures were conducted using early-passage cells, specifically those at passages 3–10. The cells were confirmed to be free of mycoplasma contamination and subjected to annual short-tandem repeat (STR) profiling, population doubling-time assessment, and morphological evaluation to ensure genetic integrity.
Plasmid Construction and Transfection
DNA fragments encoding SCD1 (Genes ID: 101801349) were cloned into a pcDNA3.1 mammalian expression vector (Invitrogen). The primer sequences used for constructing the pcDNA3.1-SCD1 (pc-SCD1) plasmid were as follows: SCD1-sense, 5’-CTT GAC ACA GGT GCC ATC-3’; SCD1-antisense, 5’- GGG GGC TAA TGT TCT TGT CA −3′. The reconstituted pc-SCD1 and empty (pc-NC) plasmids were transfected into UMUC3 cells. Briefly, pc-SCD1 or pc-NC plasmids were combined with lipofectamine 2000 (Invitrogen). The cells were incubated for 6 h, and following transfection, cultured in DMEM supplemented with 20% FBS for another 48 h. A plasmid concentration of 2.5 μg/mL was used for subsequent cellular viability, migration, and invasion assays.
Quantitative Reverse Transcription-Polymerase Chain Reaction (RT-qPCR)
Total RNA was isolated from BLCA tissues using Trizol (Invitrogen). The purity and concentration of the RNA samples were assessed using the Nanodrop 2000 spectrophotometer (Thermo Fisher Scientific, Waltham, MA, USA). Reverse transcription of the RNA was performed with M-MLV reverse transcriptase (Promega, Fitchburg, WI, USA) as per the manufacturer’s protocol. The RT-qPCR detection was performed with the SYBP Green Master mixture (Bio-Rad, Hercules, CA, USA) on the ABI 7500 system (Applied Biosystems, Waltham, MA, USA). The relative expression of SCD1 was normalized to the β-actin expression by using the 2–ΔΔCt method.20 The specific primer sequences used were as follows: SCD1 forward, 5’-TTC CTA CCT GCA AGT TCT ACA CC-3’, and reverse, 5’-CCG AGC TTT GTA AGA GCG GT-3’; and β-actin-forward, 5’-TGA CTT CAA CAG CGA CAC CCA-3’, and reverse, 5’-CAC CCT GTT GCT GTA GCC AAA-3. The PCR amplification conditions were as follows: initial denaturation at 95°C for 3 min, followed by 30 cycles of 95°C for 1 min, 60°C for 1 min, and 72°C for 1 min.
Western Blotting
Total proteins were extracted from UMUC3 cells using RIPA buffer containing 1 mM phenylmethanesulfonyl fluoride (PMSF; Beyotime, Shanghai, China). The extracted proteins were separated by 12% sodium dodecyl sulfate-polyacrylamide gel electrophoresis (SDS-PAGE) and then transferred onto a polyvinyl difluoride membrane (Millipore, Billerica, MA, USA). The membrane was probed with primary antibodies specific to SCD1 (1: 1000, Cat. #ab236868; Abcam, Cambridge, MA, USA), LC3 (1: 2000, Cat. #ab192890, Abcam), and ATG5 (1: 1000, Cat. #ab108327, Abcam). Following incubation with the primary antibodies at 4°C overnight, the membranes were treated with appropriate secondary antibodies. Subsequently, the protein bands were visualized by using an enhanced chemiluminescence (ECL) Western blotting detection system (Cell Signaling Technology, Danvers, MA, USA).
Immunofluorescence Analysis
UMUC3 cells were initially fixed with 4% paraformaldehyde, followed by permeabilization and then blocking with a solution containing 0.1% Triton X-100 in 5% bovine serum albumin (BSA) for 30 min. The samples were then incubated with a primary antibody targeting LC3B (1:1000, Cat. #192890, Abcam) and subsequently with a fluorescein isothiocyanate (FITC)-conjugated secondary antibody. Nuclei were stained with 100 μL of 4’-6-diamidino-2-phenylindole (DAPI; 1 μg/mL, Beyotime) as a counterstain. Finally, the cells were imaged under a confocal laser scanning microscope (Olympus, Tokyo, Japan).
Cell Viability Assay
Cell viability was assessed by using a cell counting kit-8 (CCK-8; Dojindo, Kyushu Island, Japan) assay. Briefly, 5000 cells were plated into a 96-well plate and cultured for 48 h. Following this, 100 µL of culture medium containing 10 µL of the CCK-8 solution was added to each well, and the plates were incubated for an additional 2 h. The absorbance at 450 nm was then measured using the BioTek Synergy H1 Microplate Reader (BioTek Instrument Inc., Winooski, VT, USA).
Cell Invasion Assay
Cell invasion was evaluated using Transwell chambers (8-μm pore; Corning Inc., Tewksbury, MA, USA) pre-coated with Matrigel (BD Biosciences, Franklin Lakes, NJ, USA). Serum-starved cells were seeded into the upper chamber, whereas the lower chamber was filled with 500 μL of DMEM supplemented with 20% FBS. Following 48 h of incubation, the invasive cells were fixed and stained with 0.1% crystal violet. The number of invasive cells was quantified by using a microscope (Olympus) at 200× magnification.
Cell Migration Assay
The migratory ability of UMUC3 cells was evaluated using a wound-healing assay. The cells were grown to 80–90% confluence, and a straight scratch was made on the monolayer of cells (designated as time point 0). Following 48 h of incubation, the wound closure was imaged and measured by using an inverted optical microscope (×200 magnification, Olympus).
Immunohistochemistry (IHC)
Tissue samples were fixed in formalin, embedded in paraffin, and excised into 4-μm slices. The slices were then incubated with primary monoclonal antibodies against SCD1 (1: 2000, Cat. #ab236868; Abcam), followed by probing with HRP-labelled secondary antibodies. The cells were stained with 3,3’-diaminobenzidine, and the cell nuclei were counterstained with hematoxylin for histochemical analyses. The expression of SCD1 was determined by multiplying the staining intensity score (3 for strong, 2 for moderate, and 1 for weak staining) by the percentage of positive cells (4 for >75%, 3 for 51–75%, 2 for 25–50%, and 1 for <25%). The final IHC score ranged from 1 to 12.
Enzyme-Linked Immunosorbent Assay (ELISA)
The concentrations of pro-inflammatory cytokines (ie, TNF-α, IL-2, and IL-1β) and anti-inflammatory factors (ie, IL-10, IL-4, and TGF-β) in the cell culture supernatant were determined using ELISA kits (R&D Systems, Minneapolis, MN, USA) as per the manufacturer’s instructions. Validation procedures for reagent kits: ① ELISA kit validation, including standard curve validation: assessment of linear range, sensitivity (limit of detection [LOD]), and precision (intra-/inter-assay coefficient of variation [CV]); recovery test: spiking with known analyte concentrations to calculate the recovery rates (acceptable range: 80–120%); cross-reactivity testing: evaluation of interference from structurally similar substances. ② Antibody validation: specificity verification: confirmed by Western blotting (detection of a single target band) or immunohistochemistry (expected localization); titer determination: serial dilution to determine the optimal working concentration; batch consistency: parallel testing of different antibody batches with the same sample. ③ General validation: positive/negative controls: ensures the detection system’s discriminative capability; stability testing: evaluates performance under different storage conditions.
Statistical Analysis
Statistical analyses were performed using SPSS software version 20.0 (Chicago, IL, USA). Quantitative data were presented as the mean ± standard deviation. Comparison between two groups was conducted using the unpaired Student’s t-test, whereas comparisons among more than two groups were analyzed by one-way analysis of variance (ANOVA). The diagnostic value of SII, CRP, and serum SCD1 for predicting the risk of UTI in BLCA patients was evaluated using ROC curves. OS and PFS of BLCA patients were assessed by using Kaplan–Meier plotter. Univariate and multivariate Cox proportional hazards regression analyses were performed to identify independent risk factors associated with postoperative OS in BLCA patients. The Bonferroni correction method was applied to adjust for multiple comparisons. The correlation among SII, CRP, and serum SCD1 levels was evaluated using Pearson’s correlation analysis. A two-sided p < 0.05 was considered to indicate statistical significance.
Results
Characteristics of SCD1 in BLCA Tissues
Using the GEPIA2 database, box plot analysis showed that SCD1 expression was significantly higher in BLCA tissues (T, 404 cases) than in normal bladder tissues (N, 28 cases, Figure 1A). Stage plot analysis indicated that SCD1 expression in stage IV tumors was slightly higher than that in stage II and III tumors, although the difference was not statistically significant ([Pr(>F) = 0.287; Figure 1B]. Kaplan–Meier survival analysis of BLCA patients (n = 402) revealed that high SCD1 expression was associated with significantly shorter OS than low expression (Log-rank Pi = 0.031; Figure 1C). Additionally, the Kaplan-Meier plots exhibited a hazard ratio (HR) of 1.4 for SCD1 (HR > 1 indicating a risk factor), supporting its role as a significant prognostic marker in BLCA progression. IHC and RT-qPCR results further demonstrated that SCD1 expression was markedly higher in BLCA tissues from patients with UTI than in those from patients without UTI (Figure 1D and E).
 |
Figure 1 Characteristics of SCD1 in BLCA tissues. (A) SCD1 expression was visualized using a box plot, comparing 404 BLCA tissue samples (T) and 28 normal tissue (N) samples. Data derived from the Genotype-Tissue Expression (GTEx) project are represented as the mean ± quartile values. *p < 0.05 by the unpaired t-test. (B) The association between SCD1 expression and tumor pathological stage is illustrated in the pathological stage plot. (C) The relationship between SCD1 expression and OS in patients with BLCA (402 cases) was evaluated using the Kaplan–Meier plot. (D) The expression of SCD1 protein in tumor tissues from BLCA patients with UTI and non-UTI was assessed by IHC staining, with brown color representing positive staining (Scale bars, 50 μm). **p = 0.000 vs tumor tissues of non-UTI patients. (E) The mRNA level of SCD1 was measured using the RT-qPCR assay. **p = 0.007 vs tumor tissues of non-UTI patients. |
SCD1 as a Biomarker for Predicting UTI Risk in BLCA Patients
To evaluate the potential of serum SCD1 as a biomarker for predicting UTI risk in NMIBC and MIBC patients, serum SCD1 levels were first compared between the non-UTI and UTI groups. Patients with UTI had significantly higher serum SCD1 levels than those without UTI (Figure 2A). As shown in Table 1, chi-square analysis revealed that elevated SCD1 expression was correlated with tumor grade (G2–G3), distant metastasis, lymph node metastasis, TNM stage T1, and UTI. Table 2 shows that increased SCD1 expression correlated with papillary tumor morphology, positive pelvic lymph nodes, pathological stage T3–T4, and UTI. Additionally, univariate and multivariate COX proportional hazards regression analyses indicated that distant metastases (odds ratio (OR): 2.180; 95% CI: 1.085–4.377; p = 0.029), lymph node metastases (OR: 3.093; 95% CI: 1.511–6.332; p = 0.002), TNM stage (OR: 2.533; 95% CI: 1.235–5.195; p = 0.011), UTI (OR: 2.171; 95% CI–1.071–4.401; p = 0.031), and SCD1 (OR: 2.461; 95% CI: 1.192–5.082; p = 0.015) were independent risk factors for postoperative OS in NMIBC patients (Table 3). Furthermore, pelvic lymph node positivity (OR: 4.426; 95% CI: 1.734–11.300; p = 0.002), pathological T stage (OR: 3.850; 95% CI: 1.520–9.750; p = 0.004), UTI (OR: 2.587; 95% CI: 1.045–6.405; p = 0.040), and SCD1 (OR: 3.215; 95% CI: 1.280–8.078; p = 0.013) were independent risk factors for postoperative OS in MIBC patients (Table 4).
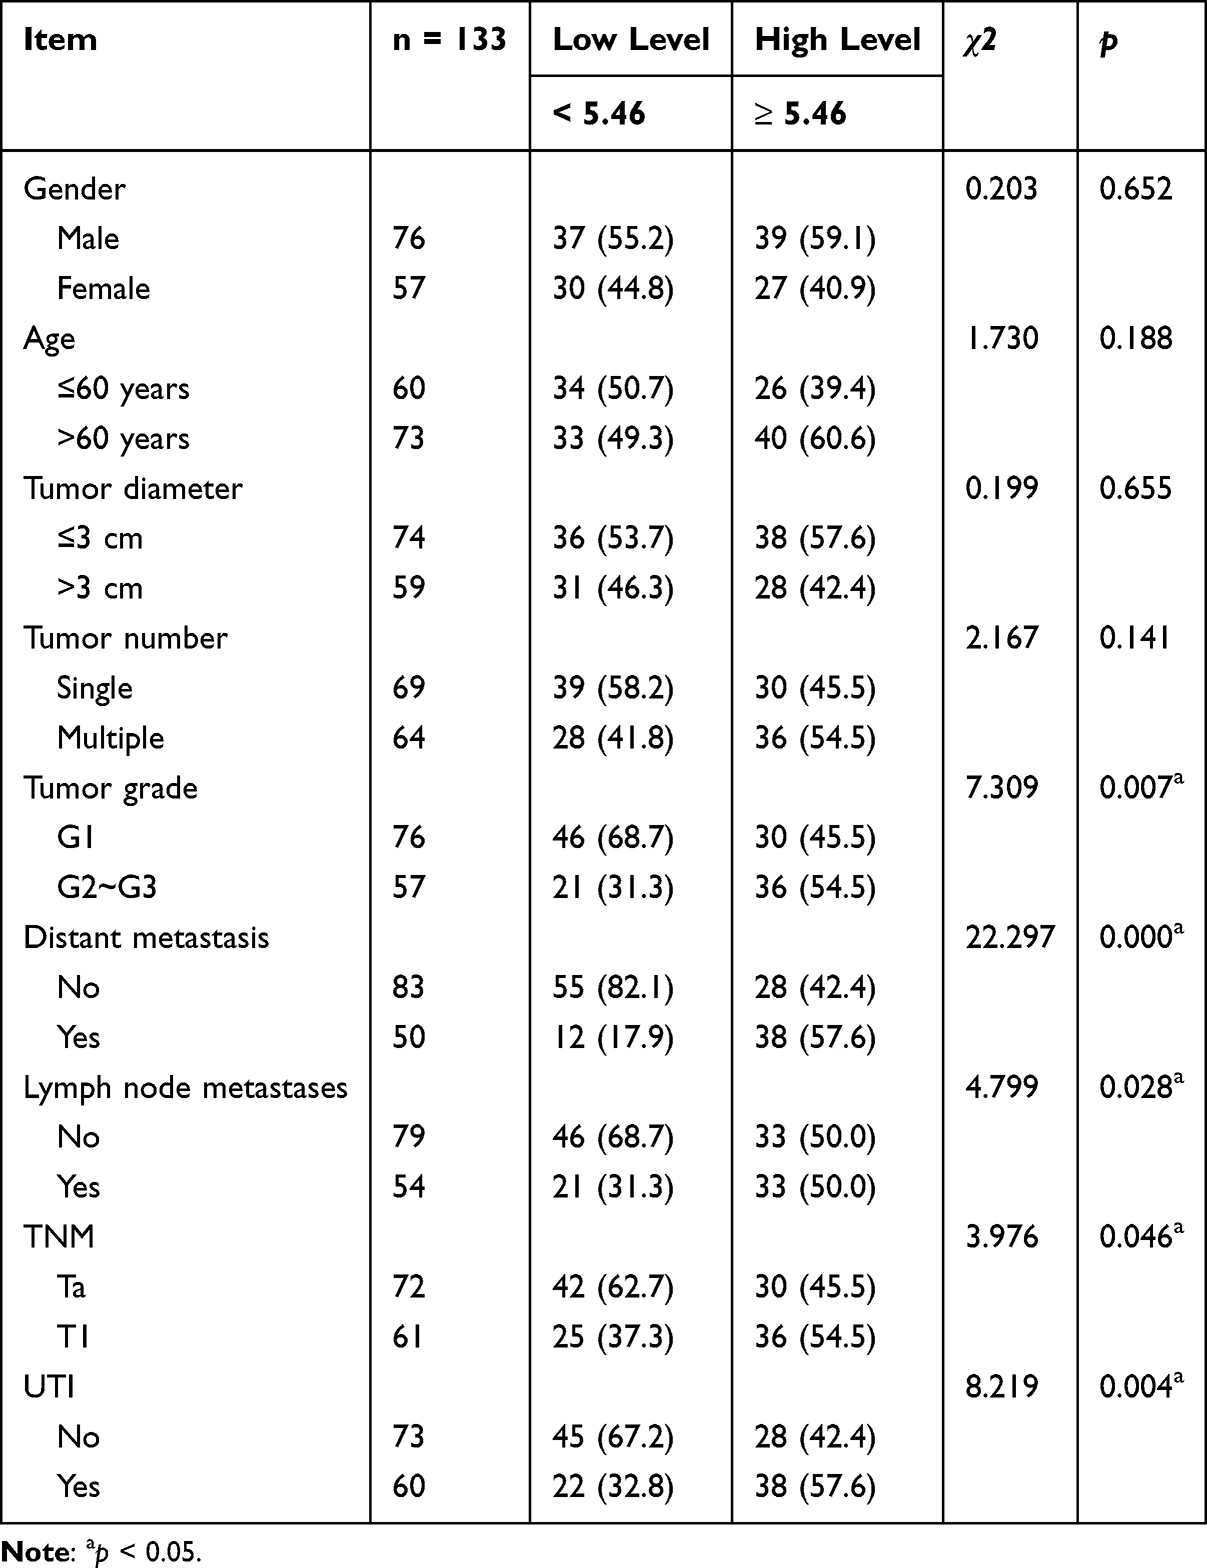 |
Table 1 Analysis of SCD1 and Pathological Characteristics in NMIBC Patients |
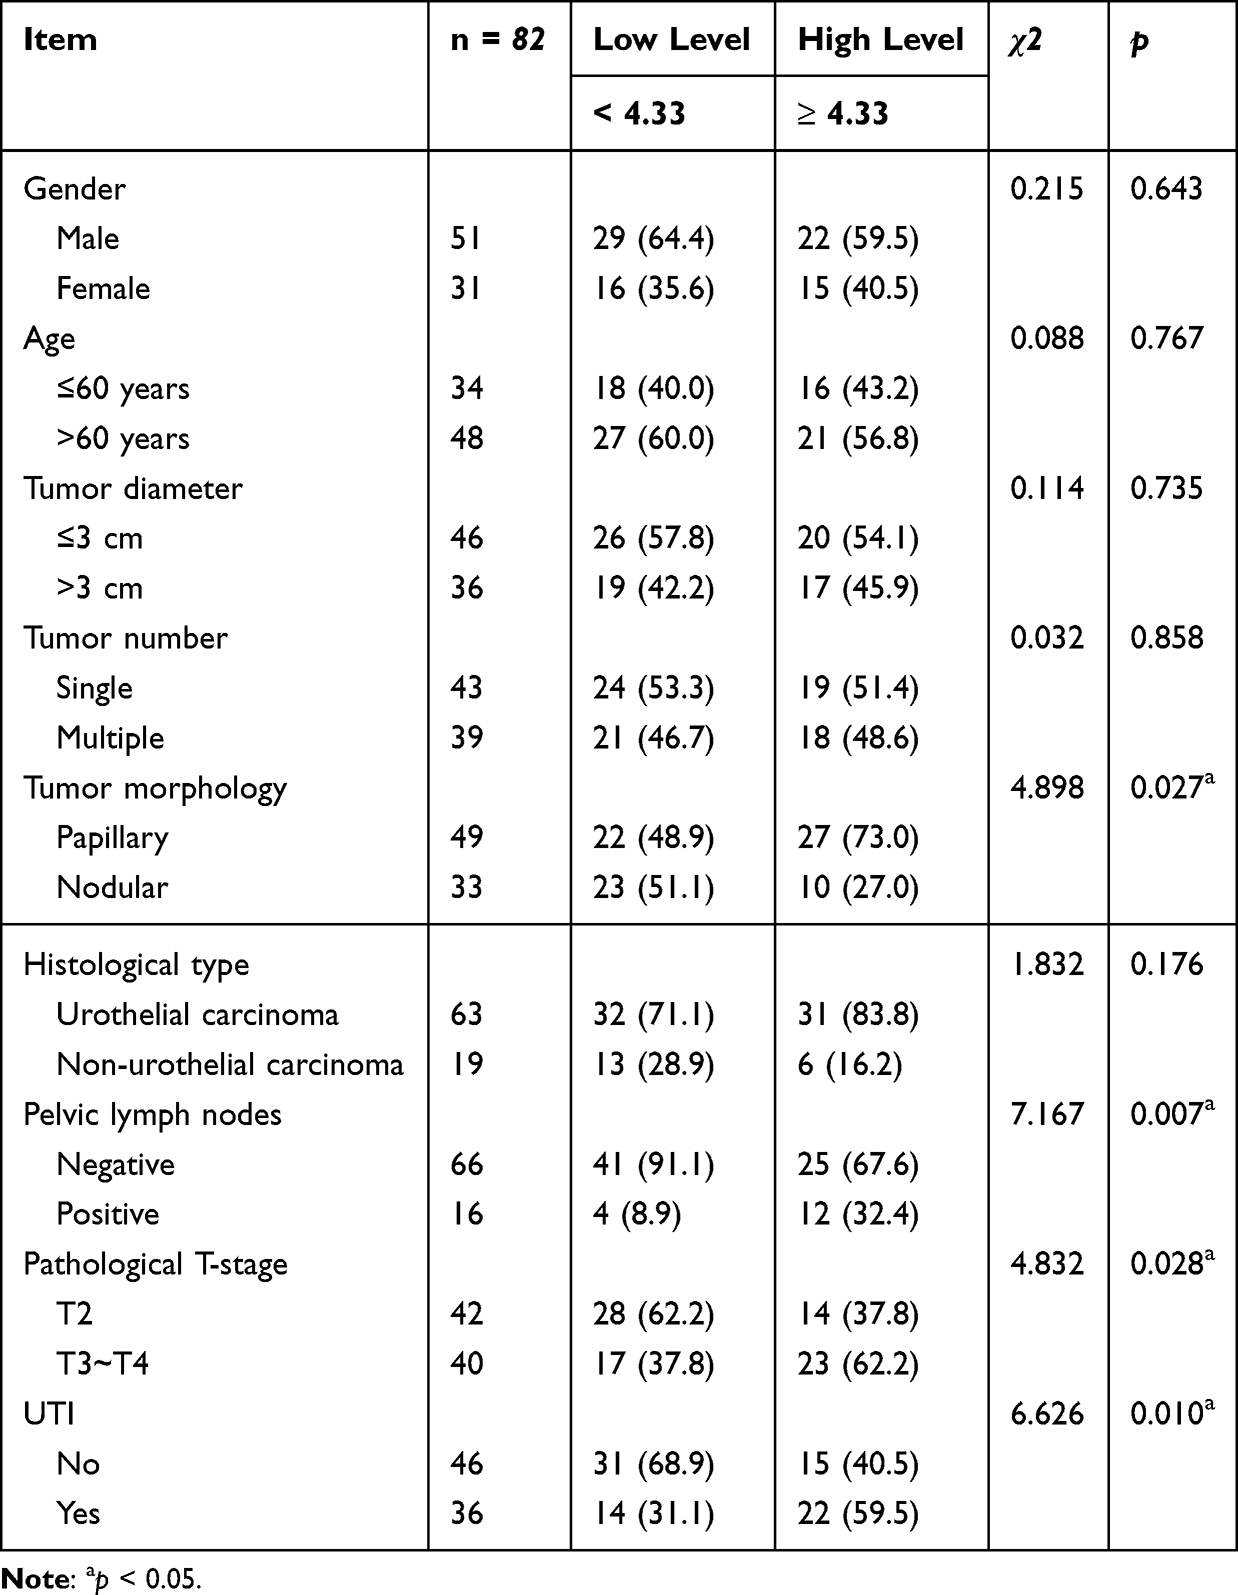 |
Table 2 Analysis of SCD1 and Pathological Characteristics in MIBC Patients |
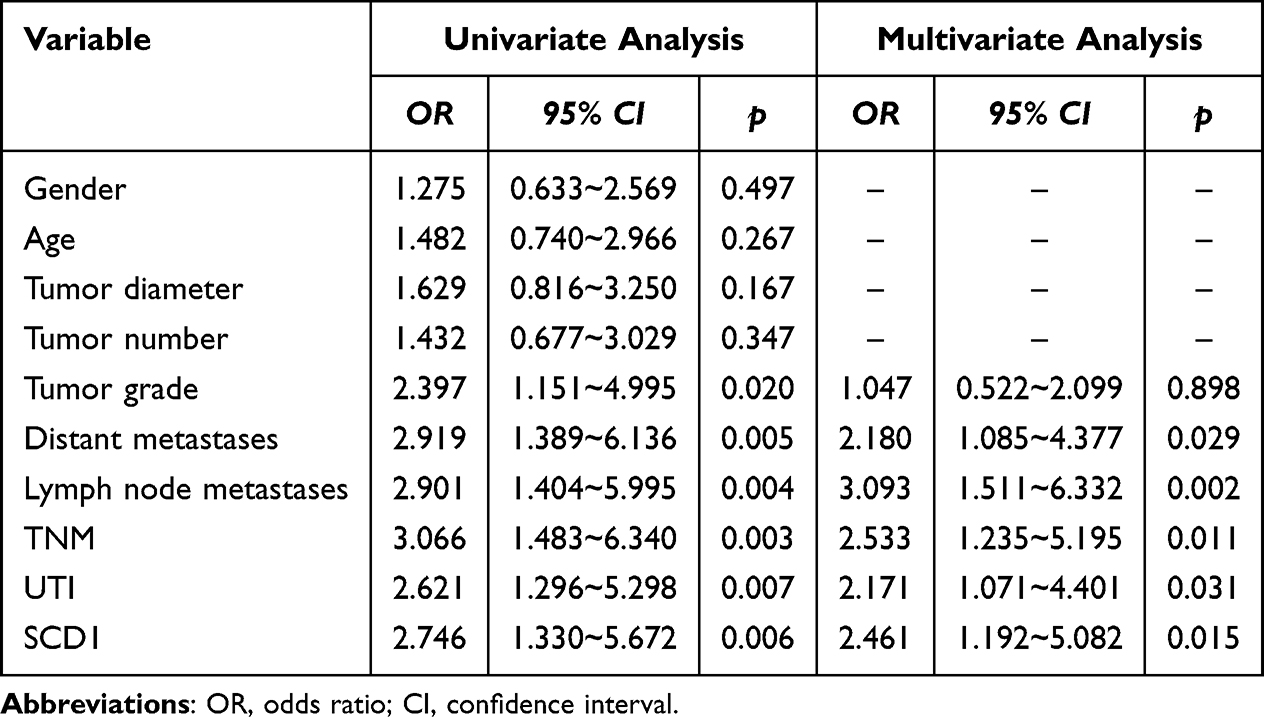 |
Table 3 Univariate and Multivariate COX Regression Analysis of Factors Affecting Postoperative OS in NMIBC Patients |
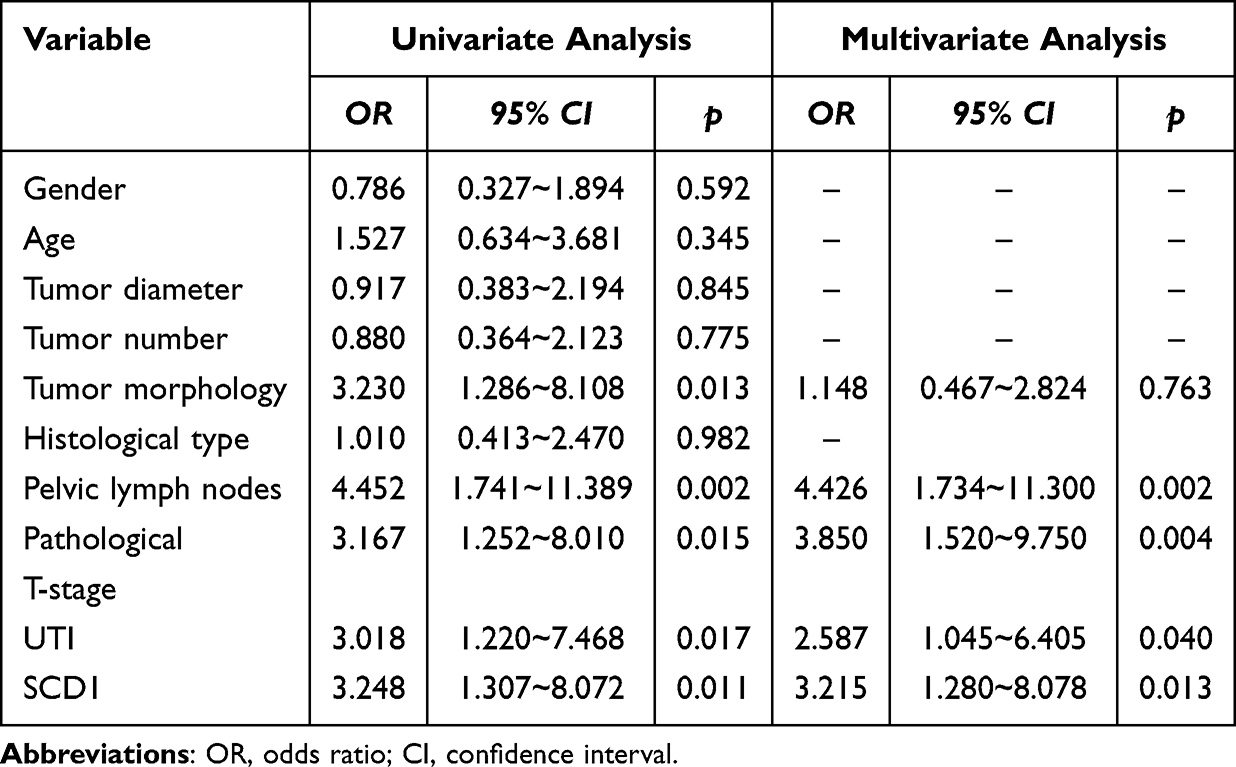 |
Table 4 Univariate and Multivariate COX Regression Analysis of Factors Affecting Postoperative OS in MIBC Patients |
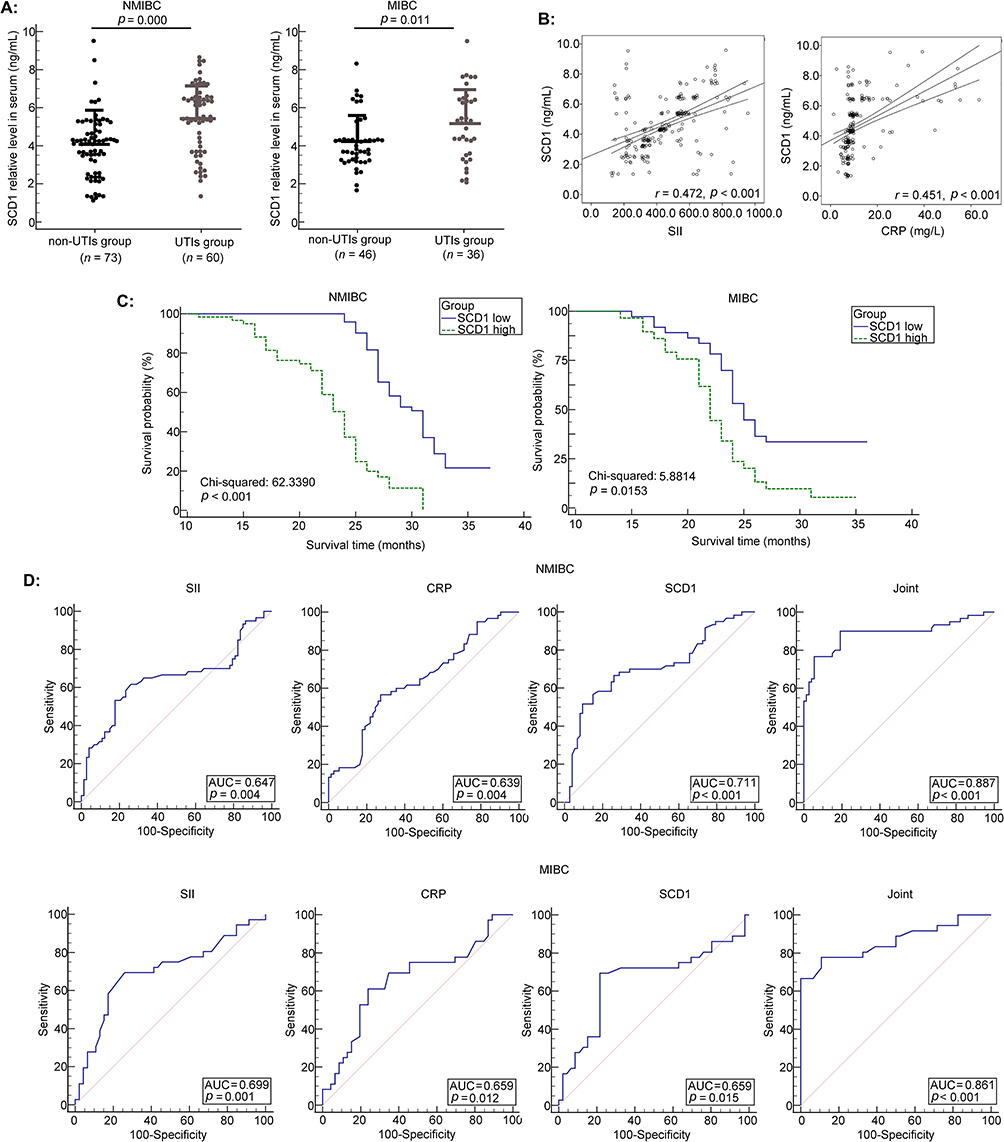 |
Figure 2 The value of SCD1 in evaluating UTI risk in BLCA patients. (A) The serum SCD1 levels were measured by ELISA in BLCA patients (NMIBC, n = 133; MIBC, n = 82). p = 0.000 and 0.011 versus the non-UTI group, respectively. (B) Correlation between SCD1 expression and inflammatory biomarkers (SII and CRP). (C) The Kaplan–Meier plot was employed to evaluate the association between SCD1 expression and PFS in BLCA patients. (D) ROC curve analysis of SCD1, SII, and CRP for distinguishing BLCA patients with UTI from those without UTI. |
Subsequently, correlation analysis revealed that serum SCD1 levels were positively associated with both SII and CRP (r = 0.472 and 0.451, respectively; both p < 0.001; Figure 2B). Survival analysis showed that patients with lower serum SCD1 levels had higher 3-year PFS rates (Figure 2C). Finally, ROC curve analysis (Figure 2D; Tables 5 and 6) indicated that a three-biomarker panel (SII, CRP, and serum SCD1) showed diagnostic performance for UTI risk in NMIBC and MIBC patients. Using the Youden index, we determined the optimal cutoff value, specificity, and sensitivity for UTI risk prediction. For NMIBC patients, the AUC was 0.887; 95% CI: 0.821–0.935; p < 0.001; specificity was 76.67%, and sensitivity was 94.52%. For MIBC patients, the AUC was 0.861; 95% CI: 0.767–0.927; p < 0.001; specificity was 77.78%, and sensitivity was 89.13%. The DeLong test results showed no statistically significant difference between the AUC of SCD1 alone and that of CRP or SII (p = 0.2062, 0.1485, 0.9884, and 0.5131). However, the three-biomarker panel significantly outperformed any single biomarker (SCD1, CRP, or SII) (p = 0.000, 0.000, 0.0032, 0.0090, 0.0374, and 0.0103, Supplementary Figures 1 and 2).
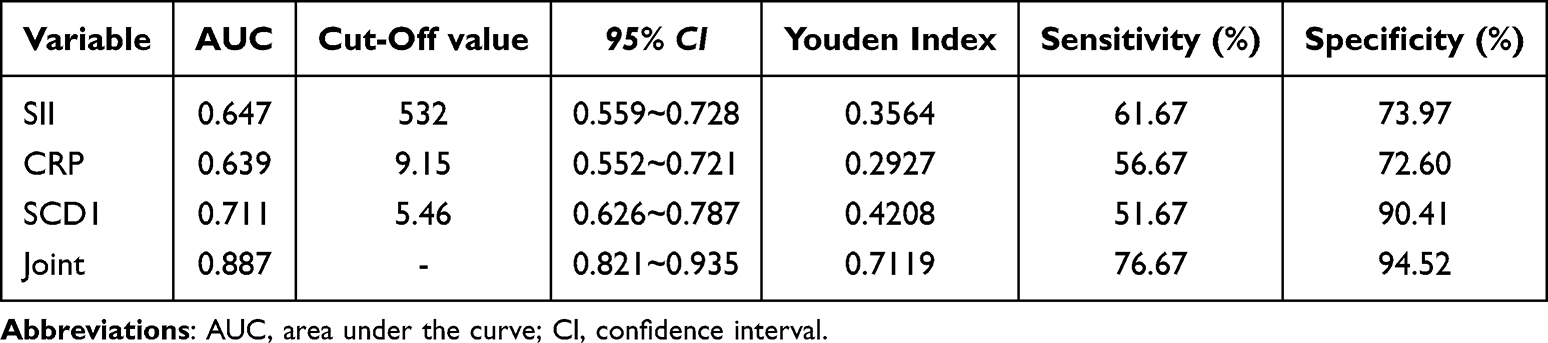 |
Table 5 The Value of SII, CRP and Serum SCD1 in Evaluating UTI Risk of NMIBC Patients |
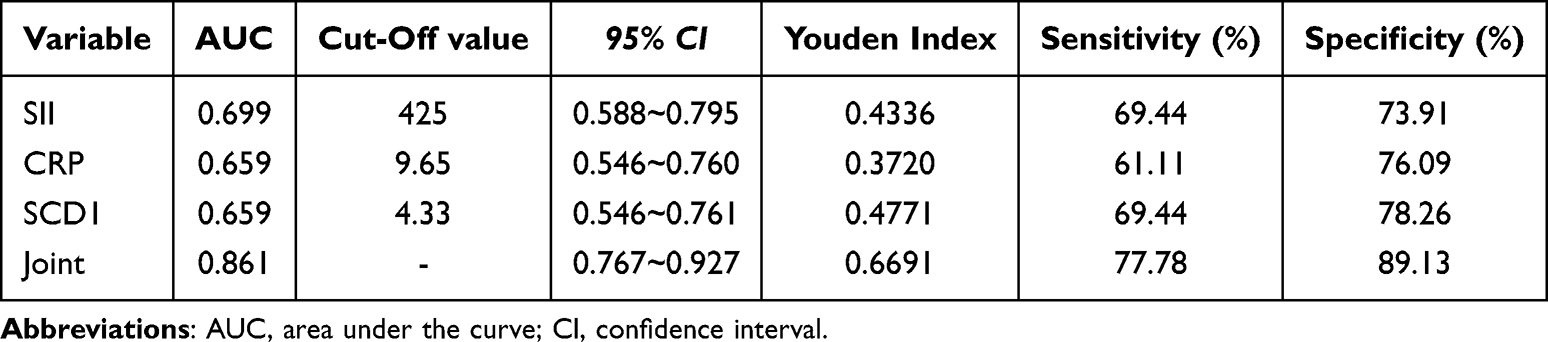 |
Table 6 The Value of SII, CRP and Serum SCD1 in Evaluating UTI Risk of MIBC Patients |
Effect of Autophagy on LPS-Induced Biological Changes in UMUC3 Cells
To investigate whether autophagy contributes to inflammation-induced BLCA progression, we examined the effect of LPS on the expression of autophagy-associated LC3 protein in UMUC3 cells. LC3-II protein expression was significantly higher in the LPS 48 h group than in the mock group (p = 0.029; Figure 3A). FITC-labeled LC3 protein was mainly localized in the cytoplasm of UMUC3 cells after 48 h of LPS exposure, but was minimal after 24 h of LPS exposure (Figure 3B). Compared with the LPS group, UMUC3 cell viability was significantly decreased in the LPS + 3-MA group, whereas significantly increased in the LPS + Rapa group (Figure 3C). Scratch and Transwell assays revealed that, compared with the LPS treatment, the LPS + 3-MA treatment significantly decreased migration and invasion, whereas the LPS + Rapa treatment significantly enhanced them (all p < 0.05; Figure 3D and E).
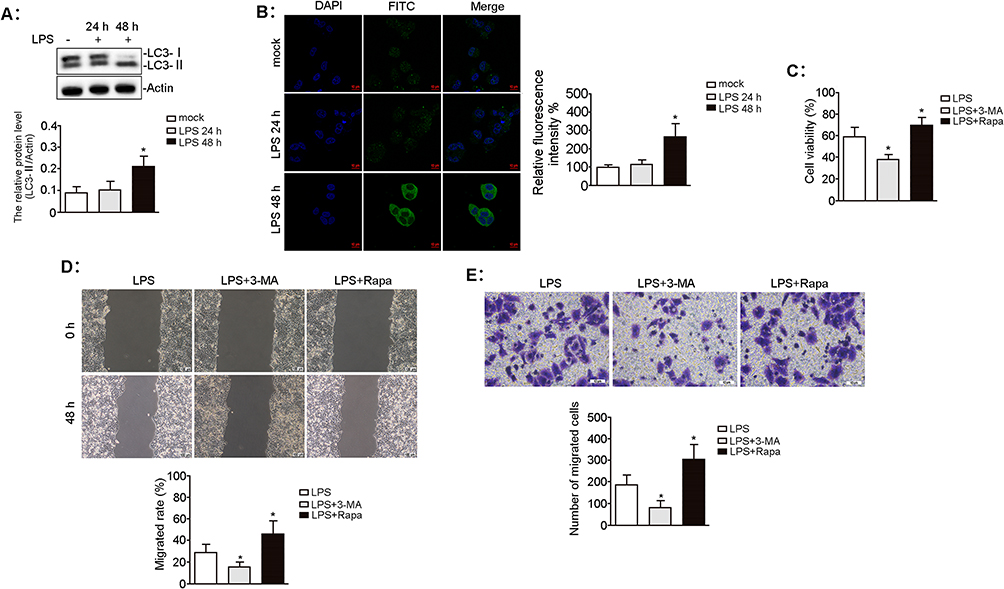 |
Figure 3 Effect of autophagy on LPS-induced biological characteristics of UMUC3 cells. UMUC3 cells were treated with LPS (0.1 μg/mL) for 24 h and 48 h. (A) The autophagy-associated LC3 protein level was determined by Western blotting. The relative expression of proteins was standardized against actin. n = 3, *p = 0.029 vs mock group. (B) FITC-labelled LC3 protein (green) was imaged by laser confocal microscopy, and the nuclei were counterstained with DAPI (blue). Scale bars, 10 μm. n = 3, *p = 0.021 vs mock group. UMUC3 cells were pretreated with 3-MA (5 mM) or Rapa (100 nM) for 1 h before LPS (0.1 μg/mL) treatment for 48 h. (C) The viability of UMUC3 cells was measured using the CCK-8 assay. n = 3, *p = 0.015 and 0.048 vs LPS treatment, respectively. (D) The migratory ability of UMUC3 cells was evaluated using the wound-healing assay. Scale bars, 100 μm. n = 3, *p = 0.016 and 0.046 vs LPS treatment, respectively. (E) The invasion of UMUC3 cells was measured by the transwell assay. Scale bars, 10 μm. n = 3, *p = 0.005 and 0.027 vs LPS treatment, respectively. |
Effect of Autophagy on SCD1-Induced Malignant Phenotypes in UMUC3 Cells
To assess whether autophagy is associated with SCD1-induced malignant UMUC3 cell phenotypes, we first evaluated the effect of SCD1 on autophagy-related protein expression. Western blotting unveiled that SCD1 overexpression significantly upregulated ATG5 expression, whereas SCD1 inhibition markedly downregulated ATG5 expression compared to the mock group (Figure 4A). Immunofluorescence confirmed that pc-SCD1 treatment significantly improved the fluorescence intensity of the FITC-labeled LC3 protein compared to the mock group, whereas SCD1 inhibitor treatment markedly diminished it (Figure 4B). Scratch and Transwell assays revealed that, compared to the mock group, pc-SCD1 treatment significantly increased migration and invasion, whereas co-treatment with the autophagy inhibitor 3-MA significantly abolished these effects (all p < 0.05; Figure 4C and D). These findings indicate that SCD1 promotes malignant phenotypes in UMUC3 cells through an autophagy-dependent mechanism.
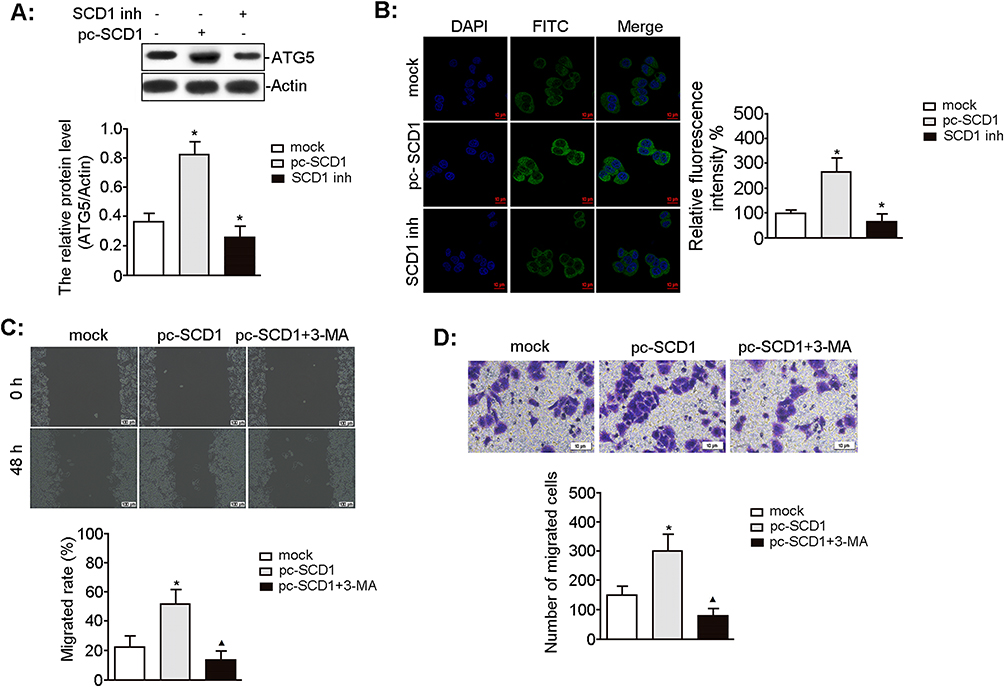 |
Figure 4 Effect of autophagy on SCD1-induced biological characteristics of UMUC3 cells. UMUC3 cells were treated with pc-SCD1 (2.5 μg/mL) and SCD1 inhibitor (CAY10566, 10 nM) for the indicated time. (A) The level of autophagy-associated ATG5 protein was measured by Western blotting. The relative protein expression was standardized with actin as an internal control. n = 3, *p = 0.001 and 0.021 vs mock group, respectively. (B) FITC-labelled LC3 protein (green) was visualized by laser confocal microscopy, and the nuclei were stained with DAPI (blue). Scale bars, 10 μm. n = 3, *p = 0.000 and 0.008 vs mock group, respectively. (C) The migratory potential of UMUC3 cells was analyzed by the wound-healing assay. Scale bars, 100 μm. n = 3, *p = 0.013 vs mock group; ▲p = 0.006 vs pc-SCD1 group. (D) The invasion of UMUC3 cells was evaluated using the transwell assay. Scale bars, 10 μm. n = 3, *p =0.017 vs mock group; ▲p = 0.004 vs pc-SCD1 group. |
The Role of the SCD1 in Inflammation-Induced BLCA Progression
To investigate the role of SCD1 in inflammation-mediated BLCA progression, we first examined the effect of LPS on SCD1 protein expression in UMUC3 cells. SCD1 levels were markedly elevated after 24 h of LPS treatment compared with the mock group and increased significantly further after 48 h (Figure 5A). LPS exposure also markedly enhanced cell viability, whereas co-treatment with 3-MA or the SCD1 inhibitor significantly reduced cell viability compared with LPS alone (Figure 5B). Scratch and Transwell assays revealed that LPS promoted cell migration and invasion relative to the mock group, while co-treatment of LPS with 3-MA or the SCD1 inhibitor suppressed both processes compared with LPS treatment alone (Figure 5C and D). Cytokines play a crucial role in mediating inflammatory responses during BLCA progression. LPS treatment markedly elevated TNF-α, IL-2, and IL-1β levels while reducing IL-10, IL-4, and TGF-β levels compared with the mock group (all p < 0.05). However, co-treatment of LPS with 3-MA or the SCD1 inhibitor decreased TNF-α, IL-2, and IL-1β levels while increasing IL-10, IL-4, and TGF-β levels compared with LPS treatment alone (Figure 5E). These findings suggest that SCD1 promotes LPS-driven BLCA progression in an autophagy-dependent manner.
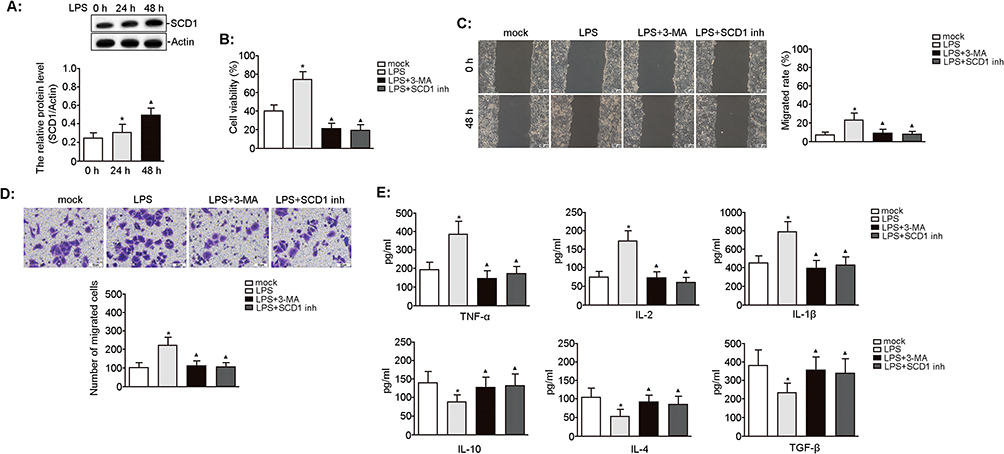 |
Figure 5 Effect of SCD1 on LPS-induced biological characteristics of UMUC3 cells. UMUC3 cells were treated with LPS (0.1 μg/mL) for 24 h and 48 h. (A) The expression of SCD1 protein was analyzed by Western blotting. The relative protein expression was quantified by normalizing to actin. n = 3, *p = 0.037 vs 0 h; ▲p = 0.023 vs 24 h. UMUC3 cells were pretreated with 3-MA (5 mM) or SCD1 inhibitor (10 nM) for 3 h before LPS (0.1 μg/mL) treatment for 48 h. (B) The viability of UMUC3 cells was determined using the CCK-8 assay. n = 3, *p = 0.019 vs mock; ▲p = 0.003 and 0.003 vs LPS treatment, respectively. (C) The migratory capacity of UMUC3 cells was assessed using the wound-healing assay. Scale bars, 100 μm. n = 3, *p = 0.044 vs mock; ▲p = 0.048 and 0.040 vs LPS treatment, respectively. (D) The invasion of UMUC3 cells was analyzed using the transwell assay. Scale bars, 10 μm. n = 3, *p = 0.003 vs mock; ▲p = 0.004 and 0.003 vs LPS, respectively. (E) The level of pro-inflammatory cytokines (ie, TNF-α, IL-2, and IL-1β) and anti-inflammatory factors (ie, IL-10, IL-4, and TGF-β) in the cell culture supernatant was determined using ELISA. n = 3, *p < 0.05 vs mock; ▲p < 0.05 vs LPS, respectively. |
Discussion
This study confirmed that SCD1 expression is significantly higher in BLCA tissues than in adjacent normal tissues. In NMIBC patients, high SCD1 expression was significantly associated with higher tumor grade (G2–G3), distant and lymph node metastases, TNM stage T1, and UTI. In MIBC patients, high SCD1 expression correlated with papillary morphology, pelvic lymph node metastasis, pathological stage T3–T4, and UTI, implicating SCD1 in both initiation and progression of BLCA. BLCA patients with high SCD1 expression had a significantly greater risk of postoperative UTI. Mechanistically, as a key lipid metabolism enzyme, SCD1 may reshape the tumor microenvironment by increasing the release of pro-inflammatory cytokines (TNF-α, IL-2, and IL-1β) and suppressing anti-inflammatory mediators (IL-10, IL-4, and TGF-β), thereby worsening urothelial damage and infection susceptibility. UTI are a common postoperative complication that can promote postoperative tumor recurrence and metastasis, representing a critical risk factor for poor prognosis in BLCA patients. For the first time, this study identifies SCD1 as a potential serological biomarker for predicting postoperative infection risk, offering clinical value for early identification of high-risk populations, timely intervention, and ultimately improving patient outcomes. To model the inflammatory tumor microenvironment, we treated UMUC3 cells with LPS, a gram-negative bacterial outer membrane component widely used to mimic inflammation. LPS has been extensively utilized to establish experimental fever models21 or mimic various inflammatory conditions.22 LPS significantly elevated inflammatory cytokine levels (including TNF-α, IL-2, and IL-1β) while concurrently enhancing UMUC3 cell viability, migration, and invasion, indicating that infection-associated inflammation may exacerbate malignant behaviors in BLCA. Importantly, LPS also activated autophagy and upregulated the expression of LC3, an autophagy-related protein.
Autophagy is an evolutionarily conserved catabolic process that maintains cellular homeostasis by recycling components under stress conditions such as nutrient deprivation,23 organelle damage,24 and exposure to radiotherapy or chemotherapy,25 thereby meeting cellular demands and enhancing survival capacity. Its role in cancer is context-dependent and dualistic: in early tumorigenesis, it primarily suppresses tumor growth by maintaining genomic stability and inhibiting proliferation and inflammation, but in established cancers, it resists cellular stress in harsh microenvironments.26 LPS has been shown to promote tumor progression and metastasis by upregulating NF-κB-dependent autophagy-related genes.27 Similarly, ATG7 is significantly overexpressed in invasive BLCA, and its knockout markedly inhibits cancer cell invasion, indicating ATG7’s critical role in regulating BLCA progression. Our findings reveal that LPS promotes BLCA cell proliferation, invasion, and migration through an autophagy-dependent mechanism. Autophagy regulates lipid metabolism, with dysregulated lipid metabolism being a hallmark of cancer. Tumor cells reprogram lipid metabolism to fuel proliferation, survival, invasion, metastasis, and adaptation to the tumor microenvironment. In hepatocellular carcinoma, inhibiting Unc-51-like autophagy activating kinase 1 (ULK1), a key kinase in autophagy initiation, reduces the SCD1 transcriptional level under lipotoxic conditions, thereby increasing the SFA-to-MUFA ratio, and inducing lipotoxic cell death.28 Given the connection between lipid metabolism and autophagy, and SCD1’s central role in lipid homeostasis, its interaction with autophagy may be critical in BLCA biology.
The SCD1–autophagy connection was first identified in Drosophila, where silencing Desat1, the Drosophila homolog of SCD, inhibited autophagy, indicating that SCD1 participates in autophagic responses by disrupting lipid biosynthesis and/or signal transduction.29 Specifically, reduced SCD1 activity impairs autophagosome–lysosome fusion and autophagy function, triggers ER stress, causes mitochondrial dysfunction, and activates intrinsic apoptotic pathways.30 SCD1 is embedded via four transmembrane domains in the ER membrane and is crucial for lipid metabolism. It also promotes cancer cell proliferation, tumor growth, and metastasis.31 Across multiple cancer types, high SCD1 expression is significantly correlated with increased tumor aggressiveness, poor prognosis, and cancer stem cell traits (such as chemoresistance and self-renewal capacity).32 In gastric cancer research, co-overexpression of the RNA-editing enzyme ADAR1 and SCD1, or elevated SCD1 editing/ADAR1 mRNA signature scores, both indicate worse prognosis.33 Our findings show that LPS significantly upregulates SCD1 expression and that SCD1-mediated autophagy promotes BLCA cell invasion, migration, and pro-inflammatory cytokine production. Applying the autophagy inhibitor 3-MA or the SCD1 inhibitor effectively reverses these LPS-induced effects; these findings are consistent with those of previous studies.
Currently, the diagnosis and prognostic evaluation of BLCA primarily rely on cystoscopy and urine cytology. While cystoscopy is invasive and costly, urine cytology—despite its high specificity and minimal invasiveness—has limited sensitivity for detecting low-grade tumors. This limitation has fueled interest in developing detection methods that combine high specificity, high sensitivity, and minimal invasiveness. Inflammation-related genes have shown potential as biomarkers for lymph node metastasis and prognostic management in BLCA, but their efficacy in assessing UTI risk remains suboptimal.7 Analysis of the GEPIA2 database unveiled significantly elevated SCD1 expression in BLCA tissues, with higher expressions associated with markedly shorter OS, underscoring its role as a risk factor for disease progression. Studies have identified SCD1 as both a prognostic biomarker and therapeutic target in KRAS/STK11/KEAP1 co-mutated lung adenocarcinoma,34 a finding that has shaped mechanistic research and guided novel therapeutic strategies for lung cancer. Our Cox regression analysis demonstrated that both UTI and SCD1 expression are independent risk factors affecting postoperative OS in patients with NMIBC and MIBC BLCA. ROC curve analysis further showed that combining SCD1 with CRP and SII markers achieved superior diagnostic performance compared with any individual marker alone. For NMIBC patients, the combined model yielded an AUC of 0.887 (95% CI: 0.821–0.935) with 76.67% specificity and 94.52% sensitivity; for MIBC patients, the AUC was 0.861 (95% CI: 0.767–0.927) with 77.78% specificity and 89.13% sensitivity.
Conclusion
This study highlights the dual role of SCD1 in BLCA progression (simultaneously promoting both tumor advancement and infection). These findings offer preclinical and observational evidence supporting the development of novel molecular biomarkers to predict and prevent postoperative UTI in BLCA patients, with potential translational application from bench to bedside. However, three major limitations should be noted: ① single-center design, which may be influenced by regional variations in clinical practice; ② the absence of an external validation cohort, which limits the generalizability of the findings; ③ the use of a monotypic cellular model (exclusive use of UMUC3 cells), which may not capture the full diversity of BLCA molecular subtypes. Therefore, future research should focus on multicenter, prospective external validation studies (target sample size ≥ 500 cases to (a) systematically evaluate the prognostic value of SCD1 across diverse populations, and (b) establish clinically applicable quantitative standards to facilitate translational implementation). Furthermore, functional studies using multiple cell lines and in vivo models are required to clarify the molecular mechanisms underlying SCD1-mediated BLCA progression and to assess its potential as a therapeutic target.
Declaration of Generative AI in Scientific Writing
The authors did not use generative AI or AI-assisted technologies in the development of this manuscript.
Data Sharing Statement
The data generated in the present study are included in the figures of this article.
Ethics Approval
This study was performed in line with the principles of the Declaration of Helsinki. Approval was granted by the Medical Ethics Committee of Hongqi Hospital Affiliated to Mudanjiang Medical University (No. 2009-22).
Consent to Participate
Informed consent was obtained from all individual participants included in the study.
Informed Consent
Written informed consent was obtained from all participants prior to enrollment.
Author Contributions
All authors made a significant contribution to the work reported, whether that is in the conception, study design, execution, acquisition of data, analysis and interpretation, or in all these areas; took part in drafting, revising or critically reviewing the article; gave final approval of the version to be published; have agreed on the journal to which the article has been submitted; and agree to be accountable for all aspects of the work.
Funding
This work was supported by the National Natural Science Foundation of China (Grant No. 81272872).
Disclosure
The authors have no relevant financial or non-financial interests to disclose for this work.
References
1. Flaig TW, Spiess PE, Abern M, et al. NCCN guidelines insights: bladder cancer, version 3.2024. J Natl Compr Canc Netw. 2024;22(4):216–225. doi:10.6004/jnccn.2024.0024
2. Bray F, Laversanne M, Sung H, et al. Global cancer statistics 2022: GLOBOCAN estimates of incidence and mortality worldwide for 36 cancers in 185 countries. CA Cancer J Clin. 2024;74(3):229–263. doi:10.3322/caac.21834
3. Lopez-Beltran A, Cookson MS, Guercio BJ, et al. Advances in diagnosis and treatment of bladder cancer. BMJ. 2024;384:e076743. doi:10.1136/bmj-2023-076743
4. Michel F, Cancrini F, Cancel-Tassin G, et al. A study of the immunohistochemical profile of bladder cancer in neuro-urological patients by the French association of urology. World J Urol. 2022;40(8):1939–1947. doi:10.1007/s00345-022-03942-3
5. Bayne CE, Farah D, Herbst KW, et al. Role of urinary tract infection in bladder cancer: a systematic review and meta-analysis. World J Urol. 2018;36(8):1181–1190. doi:10.1007/s00345-018-2257-z
6. Wang M, Chen S, He X, et al. Targeting inflammation as cancer therapy. J Hematol Oncol. 2024;17(1):13. doi:10.1186/s13045-024-01528-7
7. Wang Y, Tang Y, Liu Z, et al. Identification of an inflammation-related risk signature for prognosis and immunotherapeutic response prediction in bladder cancer. Sci Rep. 2024;14(1):1216. doi:10.1038/s41598-024-51158-9
8. Ke J, Zhang CJ, Wang LZ, et al. Lipopolysaccharide promotes cancer cell migration and invasion through METTL3/PI3K/AKT signaling in human cholangiocarcinoma. Heliyon. 2024;10(8):e29683. doi:10.1016/j.heliyon.2024.e29683
9. Hamza S, Garanina EE, Shkair L, et al. Implications of NLRP3 suppression using glibenclamide and miR-223 against colorectal cancer. Pharmaceuticals. 2024;17(3):299. doi:10.3390/ph17030299
10. Hamza S, Garanina EE, Alsaadi M, et al. Blocking the hormone receptors modulates NLRP3 in LPS-primed breast cancer cells. Int J Mol Sci. 2023;24(5):4846. doi:10.3390/ijms24054846
11. Chen Z, Liu Q, Zhu Z, et al. Ursolic acid protects against proliferation and inflammatory response in LPS-treated gastric tumour model and cells by inhibiting NLRP3 inflammasome activation. Cancer Manag Res. 2020;12:8413–8424. doi:10.2147/CMAR.S264070
12. Murakami K, Kamimura D, Hasebe R, et al. Rhodobacter azotoformans LPS (RAP99-LPS) is a TLR4 agonist that inhibits lung metastasis and enhances TLR3-mediated chemokine expression. Front Immunol. 2021;12:675909. doi:10.3389/fimmu.2021.675909
13. Pan X, Sun Y, Liu J, et al. A bacterial RING ubiquitin ligase triggering stepwise degradation of BRISC via TOLLIP-mediated selective autophagy manipulates host inflammatory response. Autophagy. 2025;21(6):1353–1372. doi:10.1080/15548627.2025.2468140
14. Yang S, Fan L, Yin L, et al. Ginseng exosomes modulate M1/M2 polarisation by activating autophagy and target IKK/IB/NF-B to alleviate inflammatory bowel disease. J Nanobiotechnology. 2025;23(1):198. doi:10.1186/s12951-025-03292-3
15. Gupta S, Cassel SL, Sutterwala FS, et al. Regulation of the NLRP3 inflammasome by autophagy and mitophagy. Immunol Rev. 2025;329(1):e13410. doi:10.1111/imr.13410
16. Liu S, Zhai J, Li D, et al. Identification and validation of molecular subtypes’ characteristics in bladder urothelial carcinoma based on autophagy-dependent ferroptosis. Heliyon. 2023;9(11):e21092. doi:10.1016/j.heliyon.2023.e21092
17. Valko A, Perez-Pandolfo S, Sorianello E, et al. Adaptation to hypoxia in Drosophila melanogaster requires autophagy. Autophagy. 2022;18(4):909–920. doi:10.1080/15548627.2021.1991191
18. Igal RA. Death and the desaturase: implication of stearoyl-CoA desaturase-1 in the mechanisms of cell stress, apoptosis, and ferroptosis. Biochimie. 2024;225:156–167. doi:10.1016/j.biochi.2024.05.023
19. Twumasi S, Ansah RO, Essien-Baidoo S, et al. Haemato-urological profile and asymptomatic urinary tract infection in ghanaian steady-state sickle cell disease patients: a case-control study. Health Sci Rep. 2025;8(4):e70643. doi:10.1002/hsr2.70643
20. Livak KJ, Schmittgen TD. Analysis of relative gene expression data using real-time quantitative PCR and the 2(-Delta Delta C(T)) Method. Methods. 2001;25(4):402–408. doi:10.1006/meth.2001.1262
21. Trajano IP, Costa LHA, Passaglia P, et al. Fluoxetine mitigates hypothermia and inflammatory responses in lipopolysaccharide-induced systemic inflammation: insights into serotonergic and hypothalamic thermoregulatory mechanisms. Cytokine. 2025;189:156909. doi:10.1016/j.cyto.2025.156909
22. He Y, Chen X, Zhong J, et al. Glucocorticoid reduces mortality in LPS-induced sepsis mouse model by inhibiting JAK1/STAT3-mediated inflammatory response and restoring tricarboxylic acid cycle. Life Sci. 2025;375:123744. doi:10.1016/j.lfs.2025.123744
23. Ding X, Zhu C, Wang W, et al. SIRT1 is a regulator of autophagy: implications for the progression and treatment of myocardial ischemia-reperfusion. Pharmacol Res. 2024;199:106957. doi:10.1016/j.phrs.2023.106957
24. Shariq M, Khan MF, Raj R, et al. PRKAA2, MTOR, and TFEB in the regulation of lysosomal damage response and autophagy. J Mol Med. 2024;102(3):287–311. doi:10.1007/s00109-023-02411-7
25. Chai W, Ye F, Zeng L, et al. HMGB1-mediated autophagy regulates sodium/iodide symporter protein degradation in thyroid cancer cells. J Exp Clin Cancer Res. 2019;38(1):325. doi:10.1186/s13046-019-1328-3
26. Wen W, Ertas YN, Erdem A, et al. Dysregulation of autophagy in gastric carcinoma: pathways to tumor progression and resistance to therapy. Cancer Lett. 2024;591:216857. doi:10.1016/j.canlet.2024.216857
27. Kim MJ, Choi B, Kim JY, et al. USP8 regulates liver cancer progression via the inhibition of TRAF6-mediated signal for NF-kappaB activation and autophagy induction by TLR4. Transl Oncol. 2022;15(1):101250. doi:10.1016/j.tranon.2021.101250
28. Liu HH, Xu Y, Li CJ, et al. An SCD1-dependent mechanoresponsive pathway promotes HCC invasion and metastasis through lipid metabolic reprogramming. Mol Ther. 2022;30(7):2554–2567. doi:10.1016/j.ymthe.2022.03.015
29. Köhler K, Brunner E, Guan XL, et al. A combined proteomic and genetic analysis identifies a role for the lipid desaturase Desat1 in starvation-induced autophagy in Drosophila. Autophagy. 2009;5(7):980–990. doi:10.4161/auto.5.7.9325
30. Pinkham K, Park DJ, Hashemiaghdam A, et al. Stearoyl CoA desaturase is essential for regulation of endoplasmic reticulum homeostasis and tumor growth in glioblastoma cancer stem cells. Stem Cell Reports. 2019;12(4):712–727. doi:10.1016/j.stemcr.2019.02.012
31. Sun Q, Xing X, Wang H, et al. SCD1 is the critical signaling hub to mediate metabolic diseases: mechanism and the development of its inhibitors. Biomed Pharmacother. 2024;170:115586. doi:10.1016/j.biopha.2023.115586
32. Xuan Y, Wang H, Yung MM, et al. SCD1/FADS2 fatty acid desaturases equipoise lipid metabolic activity and redox-driven ferroptosis in ascites-derived ovarian cancer cells. Theranostics. 2022;12(7):3534–3552. doi:10.7150/thno.70194
33. Wong TL, Loh JJ, Lu S, et al. ADAR1-mediated RNA editing of SCD1 drives drug resistance and self-renewal in gastric cancer. Nat Commun. 2023;14(1):2861. doi:10.1038/s41467-023-38581-8
34. Noto A, Raffa S, De Vitis C, et al. Stearoyl-CoA desaturase-1 is a key factor for lung cancer-initiating cells. Cell Death Dis. 2013;4(12):e947. doi:10.1038/cddis.2013.444
 © 2025 The Author(s). This work is published and licensed by Dove Medical Press Limited. The
full terms of this license are available at https://www.dovepress.com/terms
and incorporate the Creative Commons Attribution
- Non Commercial (unported, 4.0) License.
By accessing the work you hereby accept the Terms. Non-commercial uses of the work are permitted
without any further permission from Dove Medical Press Limited, provided the work is properly
attributed. For permission for commercial use of this work, please see paragraphs 4.2 and 5 of our Terms.
© 2025 The Author(s). This work is published and licensed by Dove Medical Press Limited. The
full terms of this license are available at https://www.dovepress.com/terms
and incorporate the Creative Commons Attribution
- Non Commercial (unported, 4.0) License.
By accessing the work you hereby accept the Terms. Non-commercial uses of the work are permitted
without any further permission from Dove Medical Press Limited, provided the work is properly
attributed. For permission for commercial use of this work, please see paragraphs 4.2 and 5 of our Terms.