Back to Journals » International Journal of Chronic Obstructive Pulmonary Disease » Volume 16
Influence of Cell Quality on Inflammatory Biomarkers in COPD Sputum Supernatant
Authors Pedersen F, Trinkmann F ![]() , Abdo M
, Abdo M ![]() , Kirsten AM
, Kirsten AM ![]() , Rabe KF
, Rabe KF ![]() , Watz H, Baraldo S
, Watz H, Baraldo S ![]() , Saetta M
, Saetta M ![]() , Hohlfeld JM
, Hohlfeld JM ![]() , Holz O
, Holz O
Received 4 November 2020
Accepted for publication 7 February 2021
Published 1 March 2021 Volume 2021:16 Pages 487—493
DOI https://doi.org/10.2147/COPD.S284938
Checked for plagiarism Yes
Review by Single anonymous peer review
Peer reviewer comments 2
Editor who approved publication: Prof. Dr. Richard Russell
Frauke Pedersen,1,2 Frederik Trinkmann,3 Mustafa Abdo,2 Anne-Marie Kirsten,1 Klaus F Rabe,2 Henrik Watz,1 Simonetta Baraldo,4 Marina Saetta,4 Jens M Hohlfeld,5,6 Olaf Holz5
1Pulmonary Research Institute at LungenClinic Grosshansdorf, Airway Research Center North (ARCN), German Center for Lung Research (DZL), Grosshansdorf, Germany; 2LungenClinic Grosshansdorf, Airway Research Center North (ARCN), German Center for Lung Research (DZL), Grosshansdorf, Germany; 3Pneumology and Critical Care Medicine, Thoraxklinik at University Hospital Heidelberg, Translational Lung Research Center Heidelberg (TLRC), German Center for Lung Research (DZL), Heidelberg, Germany; 4Department of Cardiac, Thoracic, Vascular Sciences and Public Health, Respiratory Diseases Clinic, University of Padova, Padova, Italy; 5Fraunhofer ITEM, Clinical Airway Research - Biomedical Research in End-Stage and Obstructive Lung Disease Hannover (BREATH), German Center for Lung Research (DZL), Hannover, Germany; 6Department of Respiratory Medicine, Hannover Medical School (MHH), Biomedical Research in End-Stage and Obstructive Lung Disease Hannover (BREATH), German Center for Lung Research (DZL), Hannover, Germany
Correspondence: Frauke Pedersen
Pulmonary Research Institute at LungenClinic Grosshansdorf, Wöhrendamm 80, Grosshansdorf, D-22927, Germany
Tel +49-4102-6016845
Fax +49-4102-8881114
Email [email protected]
Purpose: We recently introduced a sputum cell quality score to rate how cell morphology, cellular debris and squamous cell contamination influence inflammatory cell identification during microscopic evaluation. However, sputum cell quality is generally not considered for the interpretation of sputum fluid phase biomarkers. Therefore, we compared the soluble protein concentrations between sputum samples with different cell quality. The impact of cell quality was compared to other factors potentially affecting soluble biomarker concentrations.
Methods: A comprehensive sputum dataset from 154 clinically stable COPD patients was used to analyse the differences and the variability of sputum supernatant concentrations for 23 proteins between low, medium, and high sputum cell quality samples. A model was developed and tested to compare the impact of different factors on sputum supernatant protein levels.
Results: Mean percentages of sputum macrophages, neutrophils, eosinophils, monocytes and lymphocytes showed no significant differences between low, medium and high cell quality levels. The mean percentage of squamous cells were lower, while total cell count/mL sputum and cell viability were significantly higher in sputum samples with higher cell quality. The concentrations of Interleukin-6, Interleukin-8 and Tumor Necrosis Factor Receptor 2 were significantly increased in sputum samples of higher cell quality. The variability of most protein concentrations declined with increasing cell quality levels. Sixteen proteins showed significantly negative correlations with the percentage of squamous cells. For 14 proteins we observed a positive correlation with cell number/mL sputum. Multiple regression analysis shows that generally less than 30% of the protein variability can be explained by the included factors.
Conclusion: Sputum cell quality has a significant impact on some soluble biomarker concentrations in sputum supernatant. Sputum samples with low sputum cell quality show a higher variability of fluid phase proteins in comparison to medium and high sputum cell quality levels.
Keywords: sputum cell quality score, soluble biomarkers, sputum supernatant
Introduction
Analysis of induced sputum is widely used to assess airway inflammation and efficacy of anti-inflammatory substances.1,2 We have recently demonstrated that excluding low-quality samples based on a sputum cell quality score reduces inter-evaluator variability of differential cell count results.3
The sputum fluid phase or supernatant contains soluble proteins, which can provide important additional information and support the cellular analysis. Patients with airway diseases like COPD show increased neutrophil concentrations in their sputum, but also increased levels of inflammatory cytokines like Interleukin-8 (IL8), Myeloperoxidase (MPO) and Neutrophil Elastase (NE).4 The experimental challenge of healthy volunteers with either ozone or LPS is capable to mimic these disease related processes and induce both a neutrophilic inflammatory response and increase inflammatory cytokines in sputum supernatant.5,6 In asthma or allergic airway diseases were eosinophilic airway inflammation predominates, sputum supernatant contains higher levels of cytokines like Interleukin-4 or Interleukin-5.7 Therefore, sputum supernatant proteins are considered as biomarkers for airway inflammation or target engagement markers for drug interventions.
The sputum supernatant concentration of inflammatory proteins is determined by disease processes, but also by other factors related to the cell quality of the available sputum sample and the processing method. With the recently introduced cell quality score some of these factors can be estimated.3 Cell morphology, the amount of debris and squamous cells reflect the quality of the produced sputum sample and of the sputum plug selection process. The latter can also affect the density of the sputum sample, which is expressed by the cell count per sample volume. Sputum viability is a factor that also needs to be considered. Viability is unlikely to depend on the underlying disease process and is generally lower in spontaneously produced than in induced sputum samples.8,9 There is also evidence that sputum processing affects the viability.10
Sputum cell quality, squamous cell contamination and cell viability could impact the level of proteins in sputum supernatant, but these factors are generally not considered for the interpretation of sputum biomarker data. Therefore, we analyzed the impact of sputum cell quality and the above-mentioned factors on sputum supernatant biomarker results.
Methods
154 baseline sputum samples of clinically stable patients with moderate to severe COPD (post-bronchodilator FEV1% predicted 30–80%, FEV1/FVC ratio ≤ 70%) from 12 European clinical research centers were included into our retrospective data analysis.11 Patients received no anti-inflammatory therapy and had no respiratory tract infection/exacerbation within four weeks preceding the sputum collection. Sputum samples were obtained at baseline using a standardized protocol.11 The study was approved by the ethics committee at each participating center (De Videnskabsetiske Komiteer for Region Hovedstaden, Hillerod, Denmark; Ethik-Kommission der Ärztekammer Schleswig-Holstein, Bad Segeberg, Germany; Bioethics Committee of the Jagiellonian University; Krakow, Poland; Regionala etikprövningnämnden I Lund, Lund, Sweden; NRES Committee East of England, Nottingham, United Kingdom; Ethik-Kommission der Landesärztekammer Rheinland-Pfalz, Mainz, Germany; Ethik-Kommission der Ärztekammer Niedersachsen, Hannover, Germany; Ethik-Kommision der Landesärztekammer Hessen, Frankfurt, Germany), registered at clinicaltrials.gov (NCT01509677) and all patients gave written informed consent. The study was conducted in accordance with the Declaration of Helsinki.
Patients inhaled 0.9% and 3% nebulized saline solution for two consecutive periods of 5 min each.11 Selected sputum cell plugs of all induction periods were pooled, weighed, and processed with four volumes of 0.1% dithiothreitol (DTT, Sputolysin®; Calbiochem, Bad Soden, Germany) and four volumes of 1x phosphate buffered saline (PBS) in accordance with published standard operating procedures.12 The sputum samples were incubated for 15 min at room temperature and subsequently filtered through a 53 µm nylon mesh and centrifuged (600g, 10 min, 4°C). Supernatants were frozen immediately at −80°C. The remaining cell pellets were re-suspended in PBS. Cell counts were performed in a hemocytometer and viability was determined using trypan blue (Sigma, Deisenhofen, Germany). Sputum cell slides were prepared and fixed at each site according to harmonized procedures. Cell staining with Diff Quick (LT-SYS Diagnostika, Berlin; Germany), differential cell count analysis and cell quality determination were assessed centrally. The 5-point cell quality scale (0–2) considers cell morphology, amount of cellular debris, and percentages of squamous cells only if it influences inflammatory cell identification.3 The sputum cell quality levels (low: <0.75, medium: 0.75–1.25, high: >1.25) were based on the mean cell quality score of two evaluators.3
The concentrations of 46 inflammatory biomarkers were analyzed in sputum supernatants by Myriad RBM using the Human Inflammation Multi Analyte Profile ® V. 1.0 (https://myriadrbm.com/products-services/humanmap-services/inflammationmap/) as previously described.12
Sputum cell percentages and soluble biomarker concentrations were expressed as geometric means and geometric standard deviation (GSD). Kruskal Wallis ANOVA was performed to test differences between cell quality levels (low, medium, high). We tested the homogeneity of variance by Levene-Test, computed linear correlations and listed Pearson’s r correlation coefficients in Table 1 (Statistica 64, TIBCO Software Inc. (2017), Version 13). Multiple regression analysis was performed using the lm function in R (version 3.6). The gvlma function and vif function in R were used for global model validation and to test for multicollinearity. An alpha error of less than 5% was considered statistically significant.
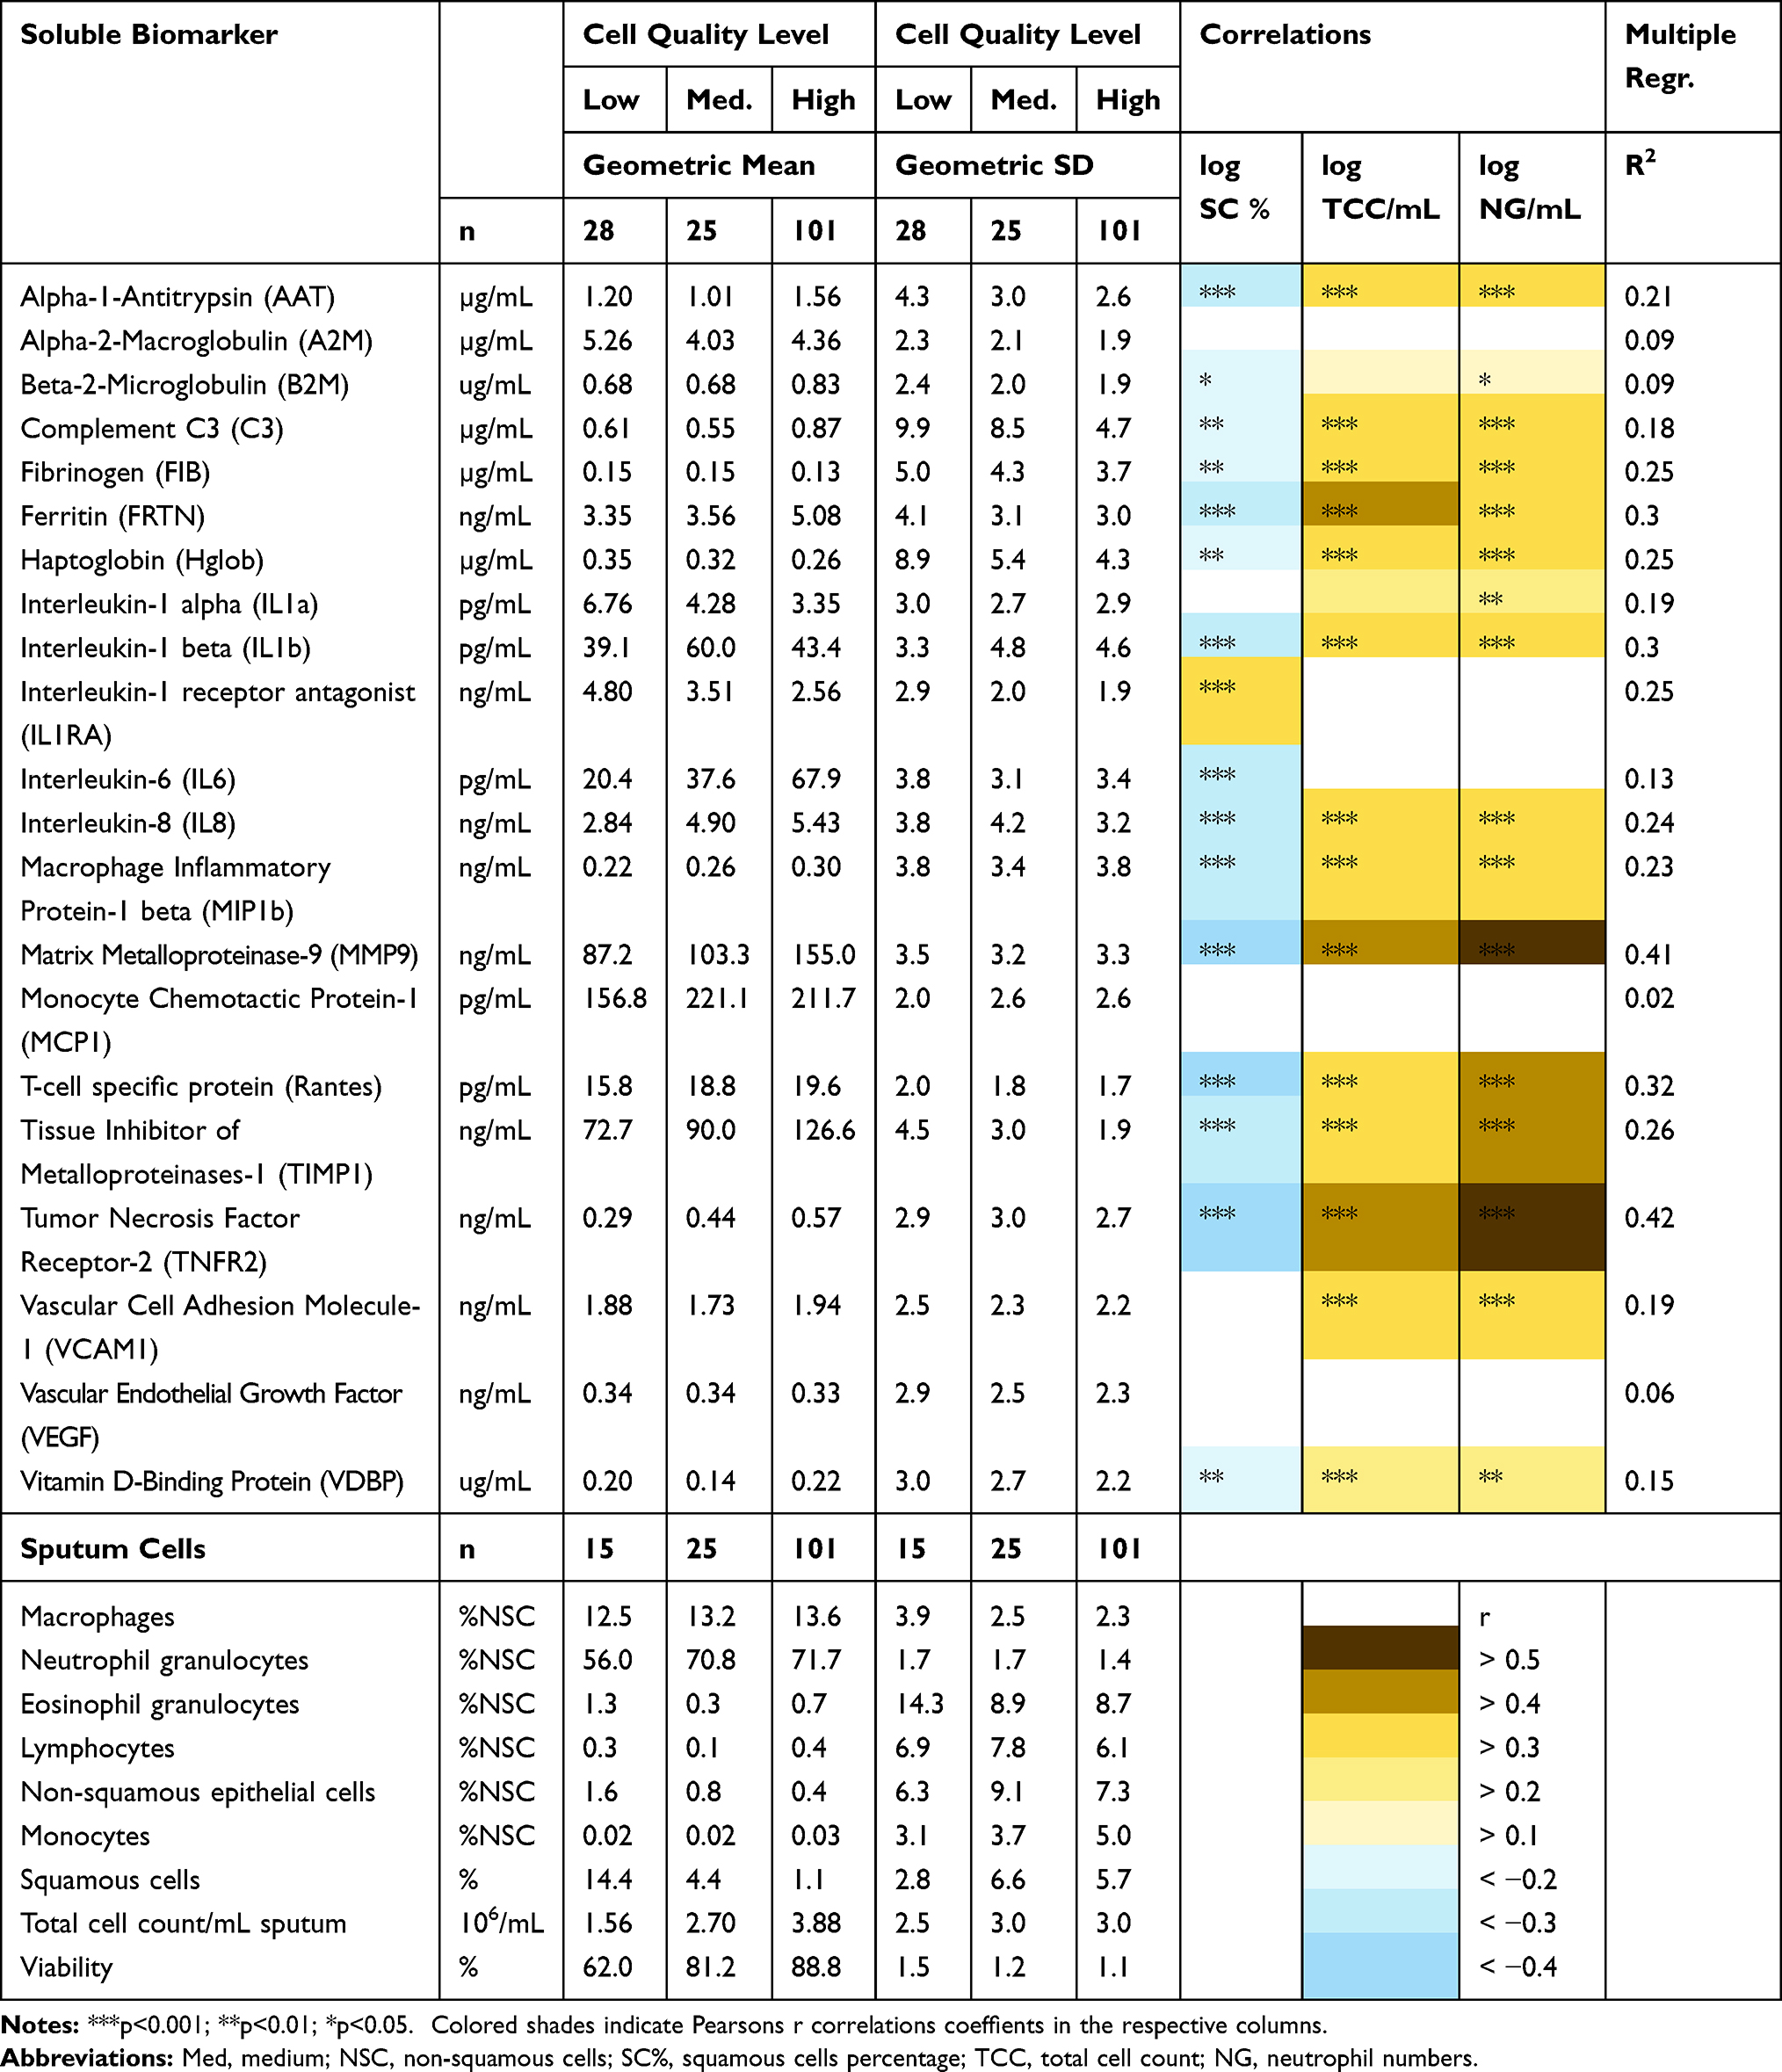 |
Table 1 Influence of Cell Quality Level on Sputum Soluble Biomarker Concentrations, Variability and Cellular Characteristics |
Results
In total, 23 soluble biomarkers of the panel were detectable in the sputum supernatant samples. ICAM-1 and TNF-α could be detected in less than 50% of the samples and were excluded from data analysis. Multiplex biomarker analysis was done for 154 patients. For 13 patients we were able to collect sputum supernatant, but the sputum cell quality was rated 0, therefore differential cell count analysis is only available for 141 patients. Soluble biomarker concentrations, differential cell counts, total cell count/mL (TCC/mL) and viability are listed separately for each cell quality level (Table 1).
As shown in Table 1 we observed similar mean percentages of sputum macrophages, neutrophils, eosinophils, lymphocytes, and monocytes between the different cell quality levels. The mean percentage of non-squamous epithelial cells (p=0.008) and squamous cells (SC%; p= 0.001) as well as total cell count/mL (TCC/mL; p=0.006) and cell viability (p=0.001) differed significantly between the cell quality levels. SC% and non-squamous epithelial cells decreased with increasing cell quality, whereas TCC/mL and cell viability increased with the cell quality level.
As for biomarkers, the concentrations of IL6 (p=0.002), IL8 (p=0.015), and TNFR2 (p=0.020) were significantly increased in samples of higher cell quality. In fact, for the important inflammatory biomarker IL6 we observed almost 3-fold higher levels in high cell quality sputum samples. For MMP9 there was a trend (p=0.060) for an increase and for IL-1ra a trend (p=0.070) for a decline in concentration with increasing cell quality. Sixteen biomarkers showed no statistically significant difference between cell quality levels, but most of these had their highest values in high cell quality sputum samples.
As indicated by the decreasing GSD the variability of biomarker concentrations declined for most biomarkers with increasing cell quality levels (Table 1). For six biomarkers this was statistically significant (AAT (p=0.002), Complement C3 (p=0.0028), Haptoglobin (p=0.014), IL-1ra (p= 0.001), RANTES (p=0.011), TIMP-1 (p<0.001)). We calculated the total variability (GSD) for the biomarkers for samples with all cell quality levels as well as for medium and high cell quality samples only. On average, the variability was 6% lower after excluding the 28 low cell quality samples.
Out of the 21 biomarkers examined, 16 showed significantly negative correlations with the percentage of squamous cells, only IL-1ra was positively correlated. For 14 biomarkers we observed a positive correlation with cell density (TCC/mL) in the respective sputum samples and for 16 markers with the concentration of sputum neutrophils (NG/mL). No significant correlations were observed with cell viability.
As a final step, we used multiple regression analysis to test the impact of different factors on biomarker concentrations in sputum supernatant. The cell quality score, squamous cells percentage and viability were included into the model as well as total cell count and neutrophil percentage; the respective R2 values are listed in Table 1. These indicate that generally about 30% of the variability can be explained by the included factors. Figure 1 summarizes the model and list the different biomarkers that showed significant effects for the respective factors. Most biomarkers were influenced by cell density and some by the percentage of squamous cells. MMP9 as a marker of neutrophilic inflammation was also affected by neutrophil percentages. In our model the sputum cell quality score had a significant influence on a limited number of sputum fluid phase proteins. The viability appears to have no influence on biomarker concentrations.
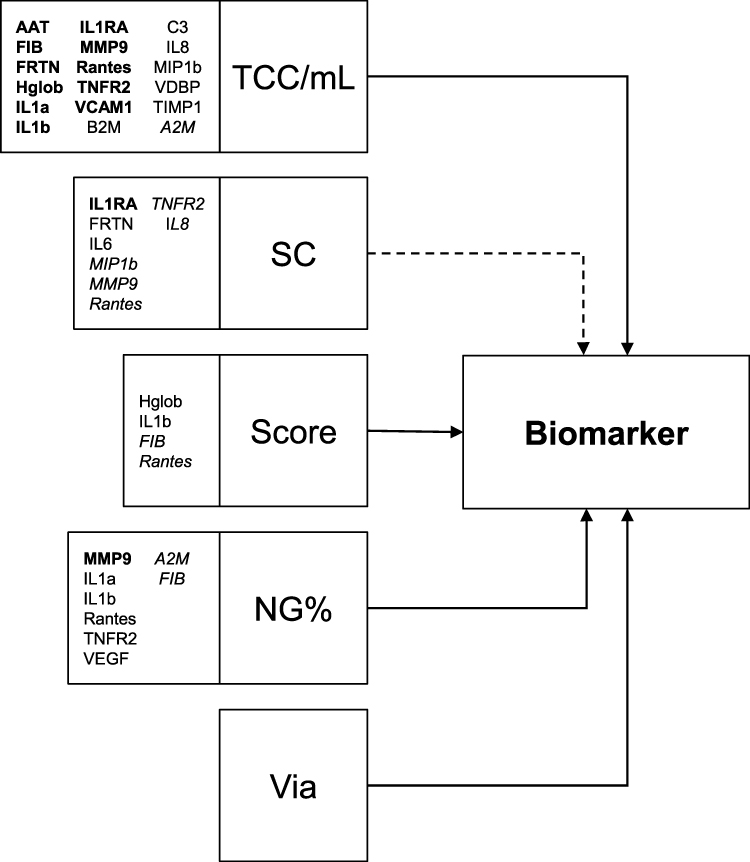 |
Figure 1 Multiple Regression model (Biomarker ~ NG% + SC + TCC/mL + via + Score). The model includes total cell count/mL (TCC/mL), squamous cell contamination (SC), the cell quality score (Score), the percentage of neutrophils in sputum (NG%) and the viability (via). The arrows illustrate the model. The effect of squamous cell contamination (SC) is likely to be indirect, via TCC/mL and/or the cell quality score, indicated by dotted arrow. The biomarkers which were significant with respect to the included factors are listed and the respective format indicates the level of significance (p<0.001; p<0.01; p<0.05). Abbreviations of biomarkers, please see Table 1. |
Discussion
The question how induced sputum cell quality affects the level of biomarkers in the fluid phase of sputum needs to be answered for each biomarker individually and requires the consideration of other potentially influencing factors. The sputum induction and processing protocol, especially differences in the treatment with DTT, the assays used for biomarker analysis and storage time before processing are known to affect absolute biomarker concentration.13 These factors, however, were carefully controlled, as all sites in this multicenter study used the same protocol and all those involved in sputum processing were trained before the study start. Despite this, a certain level of individual processor related variability cannot be finally controlled for.
Patient diagnosis and severity of airway inflammation will have a major impact on biomarker levels, if these are related to the specific disease activity. In this study we included COPD patients and therefore biomarkers related to sputum neutrophilia are likely to be increased. Since the patient cohort was rather homogeneous, which can be seen by the moderate variability of the percentage of neutrophils, we would not expect a major impact of disease severity or neutrophil levels. The current status of airway inflammation in COPD will also affect the density of sputum, which is generally described by the total cell count per mg selected sputum plugs. We included this measure instead of the number of neutrophils/mg sputum, as the latter is naturally very closely related to neutrophil percentage. It should be kept in mind that sputum cell density is likely to be affected by the way the sputum plugs are selected from the saliva out of the total expectorate. Saliva contamination of the sputum plugs can be estimated by the level of squamous cells in the sample. A median (IQR) squamous cell percentage of 2.4 (0.6; 7.0) % and just 24 samples with >10% is close to the achievable optimum in a multicenter study. Nevertheless, a clear relationship can be observed between the squamous cell percentage and the cell density (r=0.58, p<0.001). Therefore, squamous cell contamination indirectly affects the biomarker concentration by contributing to the dilution of the sputum supernatant (Figure 1). While for markers with a major lung origin an inverse relationship is expected and observed, IL-1ra showed a positive relationship. Interestingly, the major mRNA expression of IL-1ra is in the larynx and on the tongue (http://bioinfo.wilmer.jhu.edu/tiger/db_gene/IL1RN-index.html). Therefore, an increase of saliva in sputum supernatant could potentially be responsible for an increase in the level of this protein.
Previously, we were able to show that the sputum cell quality assessed during differential cell counts affects the variability between evaluators for the major cell types and should be considered as further quality measure in sputum analysis (3). Our current analysis demonstrates a lower variability in higher cell quality samples for most fluid phase markers. Moreover, the overall exclusion of lower cell quality samples in this study would reduce the variability between samples.
To estimate the contribution of individual factors with respect to the biomarker concentration in sputum supernatant we performed a multiple regression analysis including the markers listed in Table 1. Besides the sputum cell quality level, which was the focus of this study, we included the squamous cell contamination, the percentage of neutrophils as an indicator of airway inflammatory status of the COPD patients, the total cell count, and the viability of sputum cells. Sputum cell viability could also be a factor influencing certain protein biomarkers, when dead cells release mediators from intracellular sources. Overall, the contribution of these factors explaining the total variability of sputum fluid phase biomarker concentrations is low to moderate as indicated by the R2 levels provided in Table 1. Therefore, other factors like inter-individual differences in inflammatory status might account for a major proportion of variability.14
In summary, the sputum cell quality score appears to have a moderate impact on some soluble biomarkers. The number of proteins influenced by squamous cell contamination is higher, while cell viability had a limited effect. Nearly all tested sputum biomarkers are affected by total cell density and some by neutrophil percentages. Our biomarker panel demonstrates that there is no general model that fits all compounds and an individual evaluation and adaptation especially for novel proteins need to be performed.
Conclusion
Besides other factors, sputum cell quality has an impact on biomarker concentration in sputum supernatants. More importantly, samples with low sputum cell quality increase the variability of fluid phase biomarkers. Currently we do not have any evidence that the exclusion of low cell quality samples improves the discrimination eg between treatment groups in clinical trials, but we strongly recommend considering and to test this option for available or future sputum supernatant biomarker data.
Data Sharing Statement
The data that support the findings of this study are available on request from the corresponding author. The data are not publicly available due to restrictions eg their containing information that could compromise the privacy of research participants.
Disclosure
Dr Frederik Trinkmann reports personal fees from Actelion, Berlin Chemie, Boehringer Ingelheim, Chiesi, Novartis, Mundipharma, TEVA, AstraZeneca, Bristol-Myers Squibb, GlaxoSmithKline, Roche, and Sanofi Aventis, outside the submitted work. Prof. Dr. Klaus F Rabe reports personal fees from Boehringer Ingelheim, AstraZeneca, Novartis, Chiesi, Teva, Sanofi & Regeneron, Berlin Chemie, GSK, and Orion Menarini, outside the submitted work. Prof. Dr. Marina Saetta reports grants from Chiesi Farmaceutici, outside the submitted work. Prof. Dr. Jens M Hohlfeld reports personal fees from Boehringer Ingelheim for consultancy and HAL for lecture fee, grants to my institution from AstraZeneca AB, Novartis, Janssen Pharmaceutica NV, ALK, Boehringer Ingelheim, LETI, GlaxoSmithKline, GSK, Astellas Pharma, Allergopharma, and Sanofi-Aventis, personal fees for consultancy from Merck & Co, Inc., lecture fee from Novartis, outside the submitted work. The authors report no other conflicts of interest in this work.
References
1. Guo C, Sun X, Diao W, Shen N, He B. Correlation of clinical symptoms and sputum inflammatory markers with air pollutants in stable COPD patients in Beijing area. Int J Chron Obstruct Pulmon Dis. 2020;15::1507–1517. doi:10.2147/COPD.S254129
2. Watz H, Uddin M, Pedersen F, et al. Effects of the CXCR2 antagonist AZD5069 on lung neutrophil recruitment in asthma. Pulm Pharmacol Ther. 2017;45:121–123. doi:10.1016/j.pupt.2017.05.012
3. Pedersen F, Zissler U, Watz H, et al. Rating sputum cell quality in clinical trials for asthma and COPD treatment. Int J Chron Obstruct Pulmon Dis. 2019;14:195–198. doi:10.2147/COPD.S188033
4. Hoenderdos K, Condliffe A. The neutrophil in chronic obstructive pulmonary disease too little, too late or too much, too soon? Am J Respir Cell Mol Biol. 2013;48(5):531–539. doi:10.1165/rcmb.2012-0492TR
5. Holz O, Khalilieh S, Ludwig-Sengpiel A, et al. SCH527123, a novel CXCR2 antagonist, inhibits ozone-induced neutrophilia in healthy subjects. Eur Respir J. 2010;35:564–570. doi:10.1183/09031936.00048509
6. Leaker BR, Barnes PJ, O’Connor B. Inhibition of LPS-induced airway neutrophilic inflammation in healthy volunteers with an oral CXCR2 antagonist. Respir Res. 2013;14:137. doi:10.1186/1465-9921-14-137
7. Walsh MG. Biologics targeting IL-5, IL-4 or IL-13 for the treatment of asthma - an update. Expert Rev Clin Immunol. 2017;13(2):143–149. doi:10.1080/1744666X.2016.1216316
8. D’silva L, Hassan N, Wang HY, et al. Heterogeneity of bronchitis in airway diseases in tertiary care clinical practice. Can Respir J. 2011;18(3):144–148. doi:10.1155/2011/430317
9. Bhowmik A, Seemungal TA, Sapsford RJ, Devalia JL, Wedzicha JA. Comparison of spontaneous and induced sputum for investigation of airway inflammation in chronic obstructive pulmonary disease. Thorax. 1998;53(11):953–956. doi:10.1136/thx.53.11.953
10. Ronchi MC, Galli G, Zonefrati R, et al. Sputum processing: a new method to improve cytospin quality. Clin Exp Allergy. 2002;32(5):674–680. doi:10.1046/j.1365-2222.2002.01387.x
11. Rabe KF, Watz H, Baraldo S, et al. Anti-inflammatory effects of roflumilast in chronic obstructive pulmonary disease (ROBERT): a 16-week, randomised, placebo-controlled trial. Lancet Respir Med. 2018;6(11):827–836. doi:10.1016/S2213-2600(18)30331-X
12. Pedersen F, Holz O, Lauer G, et al. Multi-analyte profiling of inflammatory mediators in COPD sputum – the effects of processing. Cytokine. 2015;71:401–404. doi:10.1016/j.cyto.2014.10.008
13. Kelly MM, Keatings V, Leigh R, et al. Analysis of fluid-phase mediators. Eur Respir J Suppl. 2002;37:24–39.
14. Röpcke S, Holz O, Lauer G, et al. Repeatability of and relationship between potential COPD biomarkers in bronchoalveolar lavage, bronchial biopsies, serum, and induced sputum. PLoS One. 2012;7(10):e46207. doi:10.1371/journal.pone.0046207
 © 2021 The Author(s). This work is published and licensed by Dove Medical Press Limited. The
full terms of this license are available at https://www.dovepress.com/terms
and incorporate the Creative Commons Attribution
- Non Commercial (unported, 3.0) License.
By accessing the work you hereby accept the Terms. Non-commercial uses of the work are permitted
without any further permission from Dove Medical Press Limited, provided the work is properly
attributed. For permission for commercial use of this work, please see paragraphs 4.2 and 5 of our Terms.
© 2021 The Author(s). This work is published and licensed by Dove Medical Press Limited. The
full terms of this license are available at https://www.dovepress.com/terms
and incorporate the Creative Commons Attribution
- Non Commercial (unported, 3.0) License.
By accessing the work you hereby accept the Terms. Non-commercial uses of the work are permitted
without any further permission from Dove Medical Press Limited, provided the work is properly
attributed. For permission for commercial use of this work, please see paragraphs 4.2 and 5 of our Terms.