Back to Journals » International Journal of Nanomedicine » Volume 18
Indocyanine Green-Loaded Nanobubbles Targeting Carbonic Anhydrase IX for Multimodal Imaging of Renal Cell Carcinoma
Authors Zhong C, Chen J, Ling Y, Liu D, Xu J ![]() , Wang L
, Wang L ![]() , Ge C, Jiang Q
, Ge C, Jiang Q ![]()
Received 18 February 2023
Accepted for publication 15 May 2023
Published 23 May 2023 Volume 2023:18 Pages 2757—2776
DOI https://doi.org/10.2147/IJN.S408977
Checked for plagiarism Yes
Review by Single anonymous peer review
Peer reviewer comments 2
Editor who approved publication: Dr Yan Shen
Chengjie Zhong,1,* Jiajiu Chen,2,* Yi Ling,3 Deng Liu,3 Jing Xu,2 Luofu Wang,2 Chengguo Ge,4 Qing Jiang4
1The Second Clinical Medical College, Chongqing Medical University, Chongqing, 400016, People’s Republic of China; 2Department of Urology, Daping Hospital, Army Medical University, Chongqing, 400038, People’s Republic of China; 3Department of Ultrasound, Southwest Hospital, Army Medical University, Chongqing, 400042, People’s Republic of China; 4Department of Urology, The Second Affiliated Hospital, Chongqing Medical University, Chongqing, 400010, People’s Republic of China
*These authors contributed equally to this work
Correspondence: Chengguo Ge; Qing Jiang, Department of Urology, the Second Affiliated Hospital, Chongqing Medical University, Chongqing, 400010, People’s Republic of China, Tel +86 13883510963 ; +86 13508346066, Email [email protected]; [email protected]
Background and Purpose: The early diagnosis and differential diagnosis of renal cell carcinoma (RCC) has always been a clinical difficulty and a research focus. Carbonic anhydrase IX (CA IX) is highly expressed on the cell membrane of RCC but is not expressed in normal renal tissues. In this study, nanobubbles (NBs) targeting CA IX with ultrasound and photoacoustic multimodal imaging capabilities were prepared to explore a new method for the diagnosis and differential diagnosis of RCC.
Methods: Indocyanine green (ICG)-loaded lipid NBs (ICG-NBs) were prepared by using the filming rehydration method, and anti-CA IX polypeptides (ACPs) were attached to their surfaces to prepare CA IX-targeted NBs (ACP/ICG-NBs). The particle size, zeta potential and ICG encapsulation efficiency of these nanobubbles were measured, and their specific targeting and binding abilities to RCC cells were determined. The in vitro and in vivo ultrasound, photoacoustic and fluorescence imaging characteristics of these nanobubbles were also assessed.
Results: The particle size of the ACP/ICG-NBs was 475.9 nm in diameter, and their zeta potential was − 2.65 mV. Laser confocal microscopy and flow cytometry both confirmed that ACP/ICG-NBs had specific binding activity and ideal affinity to CA IX-positive RCC cells (786-O) but not to CA IX-negative RCC cells (ACHN). The intensities of the in vitro ultrasound, photoacoustic and fluorescence imaging were positively correlated with the concentrations of ACP/ICG-NBs. In in vivo ultrasound and photoacoustic imaging experiments, ACP/ICG-NBs exhibited specific enhanced ultrasound and photoacoustic imaging effects in 786-O xenograft tumors.
Conclusion: The ICG- and ACP-loaded targeted nanobubbles that we prepared had the capability of ultrasound, photoacoustic and fluorescence multimodal imaging and could specifically enhance the ultrasound and photoacoustic imaging of RCC xenograft tumors. This outcome has potential clinical application value for the diagnosis of RCC at the early stage and the differential diagnosis of benign and malignant kidney tumors.
Keywords: contrast-enhanced ultrasound imaging, photoacoustic imaging, renal cell carcinoma, carbonic anhydrase IX, targeted nanobubble, fluorescence imaging
Introduction
Renal cell carcinoma (RCC) originates from renal tubular epithelial cells and is responsible for approximately 90% of all renal malignancies.1,2 However, due to the deep location of the kidney, the early clinical manifestations of RCC are insidious, and the patients exhibit no obvious symptoms. More than 16% of patients develop distant metastasis at the time of the initial diagnosis.3 At present, the diagnosis of RCC mainly relies on imaging examinations, including color Doppler ultrasound, computerized tomography (CT, including enhanced CT) and magnetic resonance imaging (MRI).4 In fact, it is not difficult to detect renal tumors via imaging examinations; however, the differentiation between benign and malignant tumors (especially small renal tumors) often makes it difficult to provide clear conclusions due to the lack of specificity. It is not uncommon for benign tumors to be misdiagnosed as RCC, and nephrectomy is subsequently performed.5,6 Therefore, the early and accurate diagnosis of RCC and differential diagnosis of benign and malignant renal tumors are still clinical difficulties and research priorities.
Color Doppler ultrasonography is the preferred method for the diagnosis of renal space-occupying lesions.7 It has the characteristics of high resolution, a lack of radiation and real-time dynamic observations. However, conventional color Doppler ultrasonography is not ideal for tumor characterization. Contrast-enhanced ultrasound examination that is performed on the basis of conventional ultrasound examination enhances the blood flow scattering signal of the human body via the intravenous injection of ultrasound contrast agent. Moreover, the technique can be used to dynamically observe the microvascular perfusion information of tumor tissue in real time, which obviously makes up for the deficits of color Doppler ultrasound and two-dimensional ultrasound, improves the detection rate of tumors and possesses good clinical application prospects for the differential diagnosis of benign and malignant renal tumors.8,9 However, the particle size of the ultrasound contrast agent that is currently used in the clinical setting is the micron size, which cannot pass through the tumor blood vessels and enter the tumor tissue and is only used for blood pool imaging. Relevant studies have confirmed that nanoscale ultrasound contrast agents with a particle size less than 700 nm can utilize the enhanced permeability and retention (EPR) effect of tumor blood vessels to achieve ultrasound imaging of extravascular tumor tissue in malignant tumors.10–12 In a study completed by our group, nanobubbles (NBs) specifically targeting breast cancer cells were prepared. The imaging duration of the NBs in the xenograft model were significantly better than those of the nontargeted NBs, thus achieving specific targeted imaging of breast cancer and providing research methods and a basis for targeted ultrasonic molecular imaging of tumors.13 However, with more in-depth research, we found that targeted contrast-enhanced imaging was a single grayscale enhancement, and the image display method was relatively simple, which is not conducive to rapid clinical diagnosis and assessment.
Hypermetabolism is an important characteristic of tumors, which leads to changes in hemoglobin concentration, blood oxygen concentration and oxygen metabolism rates in tumor tissues. Photoacoustic imaging can quantitatively analyze biological parameters such as hemoglobin concentration, blood oxygen concentration and oxygen metabolism rates in tumor tissues, thereby realizing the functional imaging of tumor tissue.14,15 Indocyanine green (ICG) has a strong binding ability to plasma proteins in the vasculature and is the first optical contrast agent approved by the United States Food and Drug Administration for clinical use, with this agent possessing photoacoustic and fluorescence imaging abilities.16–18 On the basis of ultrasound molecular imaging combined with the advantages of tumor photoacoustic imaging, the construction of multimodal targeted NBs can better take advantage of ultrasound and photoacoustic molecular imaging, which is conducive to the accurate diagnosis and real-time evaluation of tumors.
Carbonic anhydrase IX (CA IX) protein, as a member of the carbonic anhydrase family, catalyzes the reversible conversion of carbon dioxide to bicarbonate and protons. It is a transmembrane glycoprotein. Relevant studies have shown that CA IX is highly expressed on the cell membrane of RCC (but is not expressed in normal renal tubular epithelium).19 Thus, CA IX is known as an RCC associated antigen and has become a target for RCC treatment and/or diagnosis. Therefore, the design and construction of ultrasonic molecular probes targeting CA IX can realize targeted molecular imaging of RCC. Polypeptides are compounds composed of α-amino acids linked by peptide bonds. These compounds have simple chemical structures, small molecular weights, and stable properties; in addition, they have been widely used in medical diagnosis and drug development. Rana et al selected an anti-CA IX polypeptide known as PGLR-P1 (amino acid sequence: NMPKDVTTRMSS) by using phage display library technology, and this compound could specifically bind to the extracellular domain of CA IX.20 Zhu et al further confirmed that NBs carrying PGLR-P1 polypeptides could specifically target and bind tumor cells with a positive expression of CA IX.21 At present, there are no reports on the construction of photoacoustic and ultrasonic multimodal NBs carrying anti-CA IX polypeptides to target RCC for molecular imaging.
Therefore, based on our previous research, we intended to prepare targeted NBs carrying anti-CA IX polypeptides (ACPs) with ICG encapsulated in their lipid shell and to perform in vitro and in vivo experiments on ultrasound and photoacoustic imaging of RCC (Scheme 1). We aimed to provide a new ultrasound and photoacoustic multimodal contrast agent for the accurate diagnosis and differential diagnosis of RCC. In view of the fact that ICG is also a fluorescence imaging agent with near-infrared fluorescence imaging ability that can help operators in determining the tumor boundary and in tracing the lymph nodes, we also investigated the fluorescent properties of ICG encapsulated in targeted NBs.
 |
Scheme 1 Illustration of the targeted NBs (ACP/ICG-NBs) that bind specifically to RCC cells expressing CA IX antigen and enhance the ultrasound, photoacoustic and fluorescence imaging of RCC xenograft. Abbreviations: C3F8, perfluoropropane; ICG, indocyanine green; US, ultrasound; NIR, near infrared ray; PAI, photoacoustic imaging. |
Materials and Methods
Cell Culture, Animal Feeding and Establishment of Subcutaneous Xenograft Tumors in Nude Mice
The human RCC cell lines 786-O and ACHN were kindly provided by the Stem Cell Bank, Chinese Academy of Sciences. 786-O is a CA IX-positive cell line, whereas ACHN is CA IX-negative. 786-O cells were maintained in 1640 medium (Thermo Fisher Scientific, USA) containing 10% fetal bovine serum (Thermo Fisher Scientific, USA). ACHN cells were maintained in MEM (Thermo Fisher Scientific, USA) containing 10% fetal bovine serum. All of the cells were cultured at 37 °C in a 5% CO2 incubator.
BALB/c-nu nude mice (Beijing Weitong Lihua Animal Technology Co., Ltd., China) were approximately 4–5-weeks-old and weighed 15–20 g.
One hundred microliters of 786-O and ACHN cell suspensions at a concentration of 1×10⁷/mL were subcutaneously injected into nude mice to establish subcutaneous xenograft tumors.
In this study, the animal experiments were conducted according to the NC3Rs ARRIVE guidelines and were approved by the Laboratory Animal Welfare and Ethics Committee of Third Military Medical University (reference No. AMUWEC20210922). All of the animals were raised according to the animal welfare guidelines of the Third Military Medical University.
Preparation of Nanobubbles
NBs were prepared by using filming rehydration method. According to the mass ratio 3:3:3:1:1, a total of 11 mg of 1,2-dipalmitoyl-sn-glycero-3-phosphocholine (DPPC), 1,2-dipalmitoyl-SN-glycero-3-phosphoethanolamine (DPPE), 1,2-dipalmitoyl-sn-glycero-3-phosphoglycerol (DPPG), 1,2-dipalmitoyl-sn-glycero-3-phosphate (DPPA) (Corden Pharma, Switzerland), biotinylated 1,2-distearoyl-sn-glycero-3-phosphoethanolamine-PEG2000 (DSPE-PEG2000-Biotin, NANOCS, Boston, USA) and 0.5 mg of ICG (MedChemExpresss (MCE) were dissolved in 1 mL PBS/glycerol solution (PBS:glycerol=9:1). After the agents were completely dissolved, the solution was transferred into an airtight vial. The air in the vial was replaced with perfluoropropane (C3F8, Tianjin Institute of Physical and Chemical Engineering of Nuclear Industry, China), and the vial was mechanically shaken at 3600 rpm for 90s in an amalgamator (Model HL-AH[G8], Hangzhou Zhongrun Medical Instrument Co., Ltd, China). After being maintained at 4 °C for 1 hour, the solution was transferred to a 1.5 mL EP tube and centrifuged at 300 rpm for 3 min. After centrifugation, the green emulsion in the middle layer, which contained ICG-loaded NBs (ICG-NBs), was collected. The concentration of ICG-NBs was counted on a cell counting plate, and streptavidin (Solarbio Science & Technology Co. Ltd., Beijing, China) was added to the solution at a ratio of 3 μg/107 ICG-NBs, incubated at 4 °C for 1 h and washed 3 times with PBS (300 rpm). Afterwards, biotin-labeled anti-CA IX polypeptide (ACP) PGLR-P120 (sequence: NMPKDVTTRMSSK-biotin, synthesized by Sangon Biotech, Shanghai, China) was added at a ratio of 0.32 μg/107 ICG-NBs and incubated at 4 °C for 1 hour. The NBs were washed three times with PBS and centrifuged to obtain targeted NBs carrying ACP and ICG, which were referred to as ACP/ICG-NBs. The abovementioned procedure was performed in the dark.
Basic Characteristics of ACP/ICG-NBs
Observation and Detection of the Morphology, Particle Size and Zeta Potential of ACP/ICG-NBs
The prepared NBs were diluted 400 times with PBS, and 10 μL was removed into a cell counting plate. The morphology of the NBs was observed and photographed with an optical microscope (Olympus, Japan). NBs were counted, and concentrations were calculated by using ImageJ software (ImageJ, National Institutes of Health). The ultrastructure of the NBs was observed via transmission electron microscopy (JEOL, Japan). The ACP/ICG-NB particle size and zeta potential were measured with a Zetasizer Nano ZS90 particle size analyzer (Malvern Instruments Inc., UK).
Stability of ACP/ICG-NBs
The concentration of the prepared NBs was measured, after which the NBs were divided into 7 parts and stored at 4 °C. One aliquot was randomly taken every day to measure the concentration of the NBs.
Verification of Whether the ACPs Were Connected to the Surface of ICG-NBs
When preparing the NBs, 5 μL of 1,1′-dioctadecyl-3,3,3′,3′-tetramethylphthalocyanine perchlorate (DiI, Beyotime Biotechnology, Shanghai, China), which is a fluorescent cell membrane dye, was added in the dark before shaking the mixture in the amalgamator. The ACPs that were used in this process were labeled with FITC (sequence: FITC-NMPKDVTTRMSSK-biotin, synthesized by Sangon Biotech, Shanghai, China). The NBs were observed under an inverted fluorescence microscope (Leica DMi8, Leica, Germany).
CCK-8 Assay to Detect the Potential Cytotoxicity of ACP/ICG-NBs on RCC Cells
Logarithmically growing 786-O and ACHN cells were cultured in 96-well plates at a density of 5000 cells/well under 5% CO2 at 37 °C for 24 h before the addition of different concentrations of ACP/ICG-NBs. The cells were cultured for 48 h, after which 10 μL of CCK-8 solution (Beyotime Biotechnology Company, China) was added to each well. The plates were incubated in an incubator for 1 h, and the absorbance at 450 nm was measured by using a microplate reader (SpectraMax iD3, Molecular Devices, USA).
Encapsulation Efficiency and Drug Loading Efficiency of ICG in ACP/ICG-NBs
The absorbance at 780 nm of unencapsulated ICG in the supernatant was measured with a microplate reader (SpectraMax iD3, Molecular Devices, USA). The mass of the entrapped ICG was equal to the mass of the total ICG minus the nonentrapped mass. The encapsulation efficiency (EE) and drug loading efficiency (LE) of ICG were calculated using the following formulas: EE = amount of ICG entrapped in NBs/total amount of added ICG × 100%; LE = amount of ICG entrapped in NBs/total lipid used to prepare NBs × 100%. This process was repeated three times to obtain the average values.
Detection of ICG Absorption Spectra
The absorbance values of the ICG solution, ICG-NBs and ACP/ICG-NBs were measured with a multifunction microplate reader (SpectraMax iD3, Molecular Devices, USA).
In vitro Cell Experiments to Detect the Targeted Binding Ability of ACP/ICG-NBs to RCC Cells
Cell Binding Assay
786-O and ACHN cells in logarithmic growth phases at a concentration of 5×10⁴/mL were seeded on a 24-well plate and incubated overnight. The two types of cells were divided into three groups, fixed with 4% paraformaldehyde for 15 min and subsequently blocked with 5% BSA-PBS for 1 h at 37 °C. Afterwards, 100 μL of 3,3’-dioctadecyloxacarbocyanine perchlorate (DiO, Beyotime Biotechnology, Shanghai, China) working solution (5 μM) was added, incubated at 37 °C for 10 minutes and washed 3 times with cell culture medium. DiI was added as a marker for NBs during the preparation of the NBs. The first group was incubated with 30 μL of ACP/ICG-NBs (1×10⁷/mL), the second group was incubated with equal concentrations of ICG-NBs and the third group was incubated with 200nM ACP 100 μL at 37 °C for 1 h, followed by incubation with 30 μL of ACP/ICG-NBs (1×10⁷/mL) for 1 h at 37 °C. After rinsing with PBS, the cells were counterstained with 4′,6-diamidino-2-phenylindole (DAPI, Beyotime Biotechnology, Shanghai, China) for 10 min and rinsed three times. Finally, the targeted binding of the two NBs to the two cells was observed via confocal laser scanning microscopy (CLSM, LSM 880, ZEISS, Germany).
Flow Cytometry
Flow cytometry was used to further verify the target-specific binding ability of ACP/ICG-NBs to RCC cells. 786-O and ACHN cells in logarithmic growth phases were trypsinized and transplanted into 6-well plates after centrifugation. Subsequently, ICG-NBs and ACP/ICG-NBs containing DiI were prepared. Each type of cells were divided into three groups. After the cells were incubated for 24 h, the first group was used as a control, and 500 μL of PBS was added. The second group was treated with 500 μL ICG-NBs at a concentration of 2×10⁷, and the third group was treated with equal concentrations of ACP/ICG-NBs. The mixture was incubated at 37 °C for 40 min. After being trypsinized and centrifuged, the supernatant was discarded, and the cells were resuspended in 200 μL PBS after being washed 3 times with PBS. The affinity of the two types of NBs to the cells was measured by using a FACSCalibur flow cytometer (BD Biosciences, USA).
In vitro Imaging of ACP/ICG-NBs
In vitro Ultrasound Imaging
Two hundred microliters of different concentrations (1.0×10⁸/mL, 5.0×10⁷/mL, 1.0×10⁷/mL, 5.0×10⁶/mL and 1.0×10⁶/mL) of ACP/ICG-NBs were placed in a cavity model made of 2% agarose gel. A Vevo 2100 small animal ultrasound imaging system (VisualSonics Inc., Canada) was used to acquire B-mode ultrasound images, after which the imaging mode was adjusted to contrast-enhanced mode (mechanical index = 0.12, frequency of the probe = 18 MHz). The images were quantitatively analyzed by using a DFY ultrasonic image quantitative analysis and diagnostic instrument (Chongqing Institute of Ultrasound Molecular Imaging, Chongqing Medical University, China), and the gray values were statistically calculated and analyzed.
In vitro Photoacoustic Imaging
Two hundred microliters of 1.0×10⁸/mL ACP/ICG-NBs were placed in a cavity model made of 2% agarose gel, and the optimal photoacoustic excitation wavelength was determined via full wavelength scanning by using a preclinical PA scanner (Vevo LAZR, Fujifilm VisualSonics Inc., Canada). Subsequently, photoacoustic images of ACP/ICG-NBs at concentrations of 1.0×10⁸/mL, 5.0×10⁷/mL, 1.0×10⁷/mL, 5.0×10⁶/mL and 1.0×10⁶/mL were acquired by using the best photoacoustic excitation wavelength. Photoacoustic image analysis was performed with the VevoLAB software package (VisualSonics Inc., Canada). The signal intensity within the regions of interest (ROIs) was reported as a photoacoustic signal.
In vitro Fluorescence Imaging
Two hundred microliters of the prepared ACP/ICG-NBs, which were diluted with PBS to 5 different concentrations (1.0×10⁸, 5.0×10⁷, 1.0×10⁷, 5.0×10⁶ and 1.0×10⁶/mL), were added to a 1.5 mL EP tube and placed in the IVIS Spectrum small animal in vivo imaging system (PerkinElmer, USA). Under irradiation conditions at an excitation wavelength of 780 nm and emission wavelength of 800 nm, the EP tubes were scanned, and their fluorescence intensities were quantified. According to the encapsulation efficiency, the amount of ICG contained in ACP/ ICG-NBs was calculated, and the same amount of ICG was taken to make an aqueous solution. The ICG concentration of ACP/ ICG-NBs and ICG solution was adjusted to be similar, and the fluorescence intensity was observed and calculated.
In vivo Imaging of ACP/ICG-NBs
When the subcutaneous xenograft tumors that had formed in nude mice reached a measurement of 100 mm3, ultrasound, photoacoustic and fluorescence imaging procedures were performed.
In vivo Ultrasound Imaging
After anesthesia with 2% isoflurane, nude mice were fixed in the prone position, and the tumor surface was covered with coupling agent for transduction. The Vevo 2100 small animal ultrasound imaging system and S250 high-frequency probe were used for scanning. The probe was fixed on the largest cross-section of the xenograft tumor. After collecting two-dimensional grayscale images, the imaging mode was adjusted to contrast-enhanced imaging mode (mechanical index=0.12, frequency of the probe=18 MHz), and the focal center was located in the center of the xenograft tumor. After randomly injecting 200 μL of ACP/ICG-NBs or ICG-NBs at a concentration of 1×10⁸/mL into nude mice via the tail vein, ultrasound images of the xenograft tumors were continuously and dynamically collected. After the in vivo ultrasound enhancement effect subsided, the “burst” key was used to blast the residual contrast agent. Afterwards, another of the abovementioned NBs was injected through the tail vein, and ultrasound images were again collected. The intensity (dB value) of the collected images was analyzed by using dedicated software (Vevo 2100 onboard software, VisualSonics), and a time-intensity curve was drawn to calculate the area under the curve (AUC).
In vivo Photoacoustic Imaging
In vivo photoacoustic imaging was performed by using a Vevo LAZR system (Fujifilm VisualSonics Inc., Canada). After anesthesia with 2% isoflurane, the nude mice were fixed in the prone position, and the imaging parameters were adjusted (laser wavelength: 770 nm; central frequency of the probe: 21 MHz; gain: 40 dB). The photoacoustic image of the tumor was collected before injection of the NBs. Afterwards, 200 μL of ACP/ICG-NBs or ICG-NBs with a concentration of 1×10⁸/mL was randomly injected through the tail vein. The photoacoustic images of the xenograft tumor were continuously and dynamically collected. After the in vivo photoacoustic signal disappeared, another type of nanobubble was injected, and photoacoustic images were collected in the same manner. Quantitative analysis of the photoacoustic signal in the region of interest was performed.
In vivo Fluorescence Imaging
After isoflurane anesthesia, the nude mice were fixed in the lateral position, the parameters of the IVIS small animal in vivo imager were set (the excitation and emission wavelengths were set to 780 nm and 800 nm, respectively) and the fluorescent images of the nude mice before the injection of the NBs were collected. After injection of 200 μL of ACP/ICG-NBs or ICG-NBs at a concentration of 1×10⁸/mL into nude mice via the tail vein, fluorescence images were collected at different time periods (5 s, 5 min, 10 min, 30 min, 60 min and 90 min) for quantitative analysis.
Detection of Localization of ACP/ICG-NBs in Tumor Tissues via Immunohistochemistry
Five 786-O and ACHN tumor-bearing nude mice were randomly selected. After anesthesia, 100 μL of ACP/ICG-NBs (DiI containing) at a concentration of 1×10⁸/mL was injected into the tumor-bearing nude mice through the tail vein. Nude mice were sacrificed 3 min later, and the hearts were perfused with normal saline to remove blood and NBs in the circulation. Xenograft tumor tissues were collected to be embedded with paraffin wax to make paraffin sections. Then the sections were fixed with paraformaldehyde, washed three times with PBS and blocked with 3% BSA. Rabbit anti-mouse CD31 antibody (ABeam, UK) (1:2000) was added, followed by an overnight incubation at 4 °C. After washing the sections with PBS, 100 μL of FITC-labeled goat anti-rabbit secondary antibody (Beyotime Biotechnology Company) (1:200) was added, incubated for 2 h and counterstained with DAPI staining solution for 5 min. Sections were observed under CLSM after rinsing.
Statistical Analysis
One-way ANOVA and paired t-tests were performed by using R programming language, and measurement data were expressed as the mean ± standard deviation. P<0.05 was considered to be significant for the statistical analysis, and lines and histograms were drawn by using GraphPad Prism 6.0.
Results
Characterization of Targeted Nanobubble ACP/ICG NBs
NBs without ICG were milky white, and the ICG-loaded targeted nanobubble ACP/ICG-NBs were pale green emulsions (Figure 1A), thus indicating that ICG could effectively be encapsulated in targeted NBs. Under an optical microscope, ACP/ICG-NBs exhibited uniform size and shape and no aggregation (Figure 1B). Under the transmission electron microscope (TEM), the ACP/ICG-NBs showed a regular spherical shape with a clear and smooth surface (Figure 1C). The concentration of ACP/ICG-NBs was approximately (3.21±0.64) ×109/mL, and the concentration of ICG-NBs was approximately (3.74±0.67) ×10 9/mL. The particle size of ICG-NBs (as measured by using Zetasizer Nano ZS90) was 427.4±17.1 nm, and the polydispersity coefficient was 0.142 (Figure 1D). The particle size of ACP/ ICG-NBs was 475.9±48.1 nm, and the polydispersity coefficient was 0.198 (Figure 1E). We measured the TEM size of the nanobubbles with ImageJ software, and the particle size of ICG-NBs and ACP/ICG-NBs were (414.65±19.46) nm and (448.24±24.50) nm. Moreover, the zeta potentials of ACP/ICG-NBs and ICG-NBs were −2.65±0.34mV and −3.00±0.51 mV, respectively. The negative zeta potential of the two NBs was an important factor for the NBs to maintain stability and to not aggregate. When the ACP/ICG-NBs were stored at 4 °C until Day 2, there was no significant difference in concentration compared with Day 0 (P>0.05). However, on Day 3, there was a significant difference in concentration compared with Day 0 (P<0.05), thus indicating that some of the NBs had decomposed (Figure 1F). These results indicated that the concentration of the targeted NBs changed with time but remained basically stable in the first 3 days.
 |
Figure 1 Basic characteristics of ACP/ICG-NBs. (A) The appearance of ACP/ICG-NBs. The left EP tube contains NBs without ICG and the right EP tube contains ACP/ ICG-NBs. (B) Morphology of ACP/ICG-NBs under light microscopy. (C) Morphology of ACP/ICG-NBs under transmission electron microscopy. (D) Particle size distribution of Blank ICG-NBs. (E) Particle size distribution of ACP/ICG-NBs. (F) Changes of the concentration in 7 days of ACP/ICG-NBs. (G) Absorption spectra of ICG solution, ICG-NBs, ACP/ICG-NBs. (H) The potential cytotoxicity of ACP/ICG-NBs on RCC cells (786-O and ACHN) detected by CCK-8 assay. (*Indicates P<0.05). |
The absorption spectra showed that the ACP/ICG-NBs had obvious absorption peaks at approximately 780 nm (Figure 1G), thus indicating that the optical properties of the ICG entrapped in the NBs did not change. In addition, via calculations, the encapsulation efficiency of ICG in ACP/ICG-NBs was 80.2±0.64%, and the drug loading efficiency was 5.0±0.29%.
The cytotoxicity of ACP/ICG-NBs on human 786-O and ACHN cells was detected by using the CCK-8 assay (Figure 1H). ACP/ICG-NBs did not significantly affect the viability of RCC cells at concentrations ranging from 1.6×10⁶ mL to 1 × 10⁹/mL, compared with the control (P > 0.05). The effect of ICG-NBs on cell viability was similar to that of ACP/ICG-NBs.
The ACPs (PGLR-P1) were coupled to the surface of the NBs by using the biotin-streptavidin bridging method. Streptavidin has four subunits: one subunit was linked to biotinylated DSPE-PEG2000 embedded in the lipid layer of the NBs, and the remaining subunits could combine with multiple biotinylated ACPs. Under an inverted fluorescence microscope, NBs showed red fluorescence (Figure 2A), and FITC-labeled ACPs showed green fluorescence (Figure 2B). The two types of fluorescence completely overlapped (Figure 2C), thus indicating that ACPs were attached to the surface of the NBs.
 |
Figure 2 Verification of the coupling of ACPs to the surface of ACP/ICG-NBs. (A) Under the confocal laser scanning microscope, the NBs encapsulated with DiI showed red fluorescence. (B) FITC-labeled ACPs showed green fluorescence. (C) The overlap of the two types of fluorescence showed yellow fluorescence. |
Specific Binding Ability of ACP/ICG NBs to Target RCC Cells
The binding of the NBs to RCC cells was observed under CLSM. ACP/ICG-NBs were observed to bind to 786-O cells in large numbers (red fluorescence around the membranes) (Figure 3A), but no obvious binding to ACHN was observed (Figure 3D). In addition, there was no obvious binding of ICG-NBs to 786-O or ACHN cells (Figure 3B and E). When 786-O and ACHN cells were blocked with ACPs, ACP/ICG-NBs did not bind to either of these cells (no red fluorescence around the membranes of the cells) (Figure 3C and F). These results demonstrated that targeted nanobubble ACP/ICG-NBs can specifically bind to CA IX-expressing RCC cells.
 |
Figure 3 Binding capacity of ACP/ICG-NBs and ICG-NBs to 786-O and ACHN. Under CLSM, the nuclei of the tumor cells were stained in blue, and the NBs showed red. (A) Aggregation of ACP/ICG-NBs was observed around the membranes of 786-O cells. (B) No obvious aggregation of ICG-NBs was found around the 786-O cells. (C) When 786-O cells were pre-treated with ACP, no obvious ACP/ICG-NBs could be found around the cells. (D and E) No obvious aggregation of ACP/ICG-NBs or ICG-NBs was observed around the membranes of ACHN. (F) When ACHN cells were pre-treated with ACP, no obvious ACP/ICG-NBs could be found around the cells. |
Flow cytometry was also used to detect the binding ability of ICG-NBs and ACP/ICG-NBs to 786-O and ACHN cells. ACP/ICG-NBs bound to 786-O in large amounts, whereas ICG-NBs rarely bound to 786-O cells (Figure 4A). ACP/ICG-NBs and ICG-NBs rarely bound to ACHN cells (Figure 4B). Furthermore, the affinity of ACP/ICG-NBs and ICG-NBs to 786-O cells was 12.27±0.69% and 3.51±0.39%, respectively and there was a significant difference between the affinities (P<0.05) (Figure 4C), whereas there was no significant difference in the affinity of both NBs to ACHN cells (P > 0.05) (Figure 4D).
 |
Figure 4 Identification of the binding ability of ACP/ICG-NBs and ICG-NBs to the RCC cells by flow cytometry. (A) 786-O cells bound many ACP/ICG-NBs and a few ICG-NBs. (B) ACHN cells bound a few ACP/ICG-NBs or ICG-NBs. (C and D) Quantification of the affinities of the two types of NBs to two types of tumor cells. (***Indicates P<0.001). |
In vitro Imaging of ACP/ICG-NBs
In the in vitro agarose model, the ultrasound signal intensity was related to the concentrations of ACP/ICG-NBs; as the concentration increased, the ultrasound signal intensity increased (Figure 5A and B). Photoacoustic images of ACP/ICG-NBs at different concentrations were acquired by using the best photoacoustic excitation wavelength (770 nm), and the value of the photoacoustic signal intensity was quantitatively analyzed. The in vitro photoacoustic signal intensity of ACP/ICG-NBs was also related to its concentration, and the photoacoustic signal intensity increased with increasing concentration (Figure 5A and C).
 |
Figure 5 In vitro ultrasound, photoacoustic, and fluorescence imaging of ACP/ICG-NBs. (A) Ultrasound (US) and photoacoustic (PA) imaging of ACP/ICG-NBs at different concentrations. (B) Quantification of US signal intensities at different ACP/ICG-NBs concentrations. (C) Quantification of PA signal intensities at different ACP/ICG-NBs concentrations. (D) In vitro fluorescence imaging of ACP/ICG-NBs at different concentrations. (E) Quantification of fluorescence signal intensity at different ACP/ICG-NBs concentrations. (F) In vitro fluorescence imaging of ddH2O (double distilled water), ICG solution and ACP/ICG-NBs. The ICG solution and ACP/ICG-NBs contained the similar amount and concentration of ICG. (G) Quantification of fluorescence signal intensity of ddH2O, ICG solution and ACP/ICG-NBs (*Indicates P<0.05). |
The EP tubes with different concentrations of ACP/ICG-NBs were scanned by using the IVIS small animal in vivo imager. Each EP tube had a fluorescent signal, and the fluorescent signal intensity increased with increasing nanobubble concentration (Figure 5D and E). According to the encapsulation efficiency of ICG (80.2±0.64%), we calculated that the prepared ACP/ ICG-NBs solution contained 0.4 mg of ICG. So, 0.4 mg ICG was taken and dissolved in double distilled water (ddH2O) and adjusted the volume equal to that of ACP/ICG-NBs solution. Two hundred microliters of the two types of solution were taken and added to 1.5 mL EP tubes. The EP tubes with ACP/ICG-NBs, ICG solution and ddH2O were scanned and photographed (Figure 5F), and the fluorescence intensity of ACP/ICG-NBs was significantly higher than that of the ICG solution (P<0.05, Figure 5G).
The abovementioned ultrasound, photoacoustic and fluorescence in vitro model imaging results indicated that ACP/ICG-NBs possessed the ability of ultrasound, photoacoustic and fluorescence multimodal imaging.
In vivo Ultrasound Imaging of ACP/ICG-NBs
Before nanobubble injection, all of the tumor tissues were hypoechoic. After the injection of targeted nanobubble ACP/ICG-NBs or nontargeted nanobubble ICG-NBs, the tumor tissues immediately demonstrated enhanced imaging, thus indicating that both types of NBs could pass through the tumor blood vessels and enhance the imaging of tumor tissues. Within 15 minutes, continuous dynamic images were subsequently acquired (Figure 6A), and time-intensity curves were plotted (Figure 6B and C). The time to peak, peak intensity, duration of enhancement and area under the curve (AUC) were calculated. In 786-O xenograft tumors, the duration time of enhancement and AUC significantly differed between the ACP/ICG-NBs and ICG-NBs (P<0.05), whereas the time to peak and peak intensity were not significantly different between the two types of NBs (P>0.05). In ACHN xenograft tumors, there was no significant difference in the time to peak, peak intensity, duration time of enhancement and AUC between the two types of NBs (P>0.05) (Figure 6D and E, Table 1). The abovementioned results showed that compared with ICG-NBs, ACP/ICG-NBs could significantly enhance the ultrasound imaging of xenograft tumors with the positive expression of CA IX, whereas there was no significant difference in the enhanced imaging of xenograft tumors with the negative expression of CA IX between them.
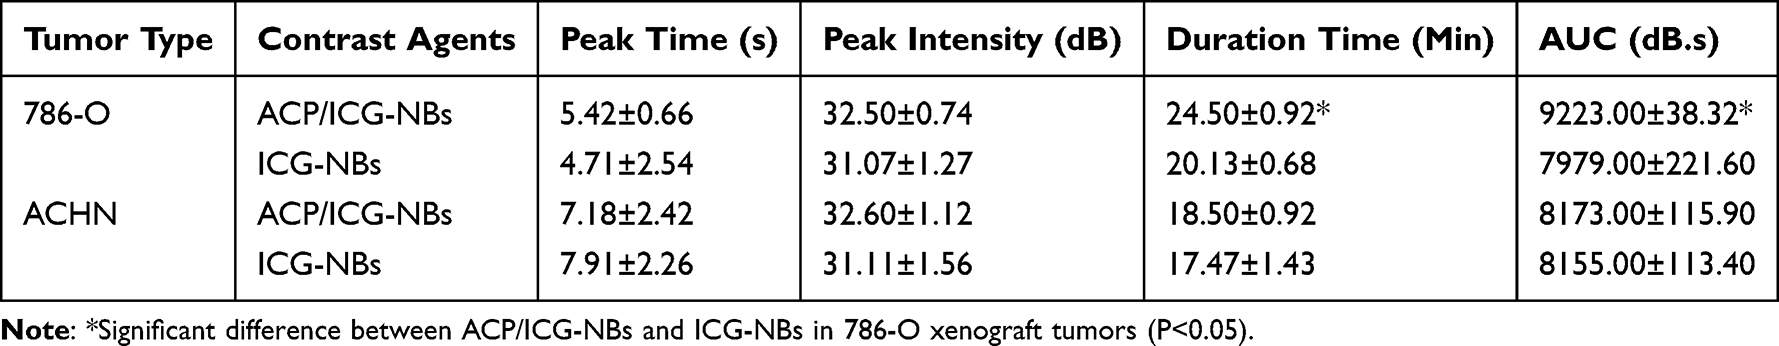 |
Table 1 Ultrasound Signal Characteristics of the Two Types of NBs in the Two Types of Xenograft Tumors |
 |
Figure 6 In vivo ultrasound imaging of ACP/ICG-NBs and ICG-NBs. (A) The ultrasound imaging of xenograft tumors before and after injection of the two types of NBs (the yellow circles indicate the region of xenograft tumors). (B and C) The time-intensity curves of ultrasound imaging of each xenograft tumor after injection of two types of NBs. (D) AUC of the time-intensity curve (*Indicates P<0.05). (E) Duration time of the ultrasound signal in each type of xenograft tumor after injection of the two types of NBs (*Indicates P<0.05). |
In vivo Photoacoustic Imaging of ACP/ICG-NBs
In nude mice possessing 786-O and ACHN xenografts, after injections of ICG-NBs or ACP/ICG-NBs, the photoacoustic signal was obviously enhanced compared with that before injection. According to the time-intensity curves, after the injection of ACP/ICG-NBs, the photoacoustic signal in the 786-O xenograft tumor area gradually increased, and the intensity reached its highest level at 12.5 minutes after the injection. The enhanced photoacoustic signal was still visible in the xenograft tumor area at 30 minutes after injection; however, after the injection of ICG-NBs, the photoacoustic signal rapidly decreased after a transient enhancement (Figure 7A and Table 2). By analyzing the time-intensity curves of ICG-NBs and ACP/ICG-NBs in 786-O and ACHN xenografts and calculating the AUC, it was found that ACP/ICG-NBs had a higher photoacoustic signal intensity than ICG-NBs in CA IX-positive 786-O xenografts (P<0.05); however, there was no significant difference in the photoacoustic signal intensity between ACP/ICG-NBs and ICG-NBs in CA IX-negative ACHN xenografts (P>0.05) (Figure 7B–D and Table 2). In addition, the duration time of ACP/ICG-NBs in 786-O xenografts was significantly higher than that of ICG-NBs (P<0.05), whereas the duration time of ACP/ICG-NBs and ICG-NBs in ACHN was not significantly different (P>0.05) (Figure 7E and Table 2). The abovementioned results indicated that the ICG-loaded targeted NBs have stronger and longer-lasting photoacoustic signals than nontargeted NBs.
 |
Table 2 Photoacoustic Signal Characteristics of the Two Types of NBs in the Two Types of Xenograft Tumors |
 |
Figure 7 In vivo photoacoustic imaging of the two types of NBs. (A) Photoacoustic signal in the two types of xenograft tumors before and after injection of the two types of NBs (the yellow circles indicate the region of xenograft tumors). (B and C) The time-intensity curves of photoacoustic imaging of each xenograft tumor after injection of the two types of NBs. (D) AUC of the time-intensity curve (**Indicates p<0.01). (E) Duration time of photoacoustic signal in each type of xenograft tumor after injection of the two types of NBs (*Indicates P<0.05). |
In vivo Fluorescence Imaging of ACP/ICG-NBs
Obvious fluorescence signals could be observed in the liver and tumor regions within 1 min after the injection of ACP/ICG-NBs into nude mice bearing 786-O xenograft tumors, and the fluorescence signals began to decay after 5 min; however, a small amount of fluorescence signals could still be observed at 60 min. When ICG-NBs were injected into the same nude mice, fluorescence imaging of the tumor site was not obvious. After injections of ACP/ICG-NBs or ICG-NBs into nude mice bearing ACHN xenograft tumors, fluorescence imaging of the tumor site was also not obvious. The time-fluorescence intensity curve was plotted, and the AUC was calculated. The AUC of ACP/ICG-NBs was significantly larger than that of ICG-NBs for 786–0 xenograft tumors (P<0.05), whereas there was no significant difference between the AUC of ACP/ICG-NBs and ICG-NBs for ACHN xenograft tumors (P>0.05) (Figure 8 and Table 3). These results indicated that ACP/ICG-NB-targeted NBs could enhance the fluorescence imaging of CA IX-positive xenograft tumors, and the imaging time is prolonged due to the presence of targeted binding.
 |
Table 3 Area Under the Time-Fluorescence Intensity Curves of ACP/ICG NBs and ICG NBs in Xenograft Tumors |
 |
Figure 8 In vivo fluorescence imaging of the two types of xenograft tumors after injecting the two types of NBs. (A) Small-animal live fluorescence imaging of the two types of xenograft tumors (inside the blue circles) before and after injection of the two types of NBs. (B and C) The time-fluorescence intensity curves of the two types of tumors. |
Tissue Localization of ACP/ICG-NBs
The results are shown in Figure 9. NBs were observed in the interstitial space of the two types of xenograft tumors, which provided strong evidence that NBs could penetrate the tumor blood vessels. A large number of NBs were observed in the 786-O xenograft tumor tissues (A–D), and a small number of NBs were observed outside of the blood vessels in the ACHN xenograft tumor tissues (E-H); however, almost no NBs could be observed in the normal muscle tissues (I-L). These results suggested that targeted NBs aggregated by binding to tumor cells expressing CA IX after penetrating the blood vessels, with little or no binding to cells that do not express CA IX.
 |
Figure 9 The localization of the ACP/ICG-NBs in xenograft tumor tissues by immunofluorescence. The nuclei of the two types of tumor cells were stained in blue, the blood vessels were stained in green and the ACP/ICG-NBs showed red. (A–D) A large number of ACP/ICG-NBs were observed in the intercellular spaces of 786-O xenograft tumors. (E–H) A relatively smaller number of ACP/ICG-NBs were observed in the intercellular spaces of ACHN xenograft tumors. (I–L) Few ACP/ICG-NBs were observed in the intercellular spaces of the normal muscle tissues. |
Discussion
The diagnosis and differential diagnosis of renal tumors mainly rely on imaging examinations. The problems and deficiencies of current imaging examinations mainly include the following aspects. (1) It is difficult to make a definite diagnosis of small renal tumors. With the improvement of medical conditions and the widespread development of physical examinations, more than 60% of patients are diagnosed with asymptomatic early-stage renal tumors, including a large number of tumors with a size of 0.5–2 cm. For this type of tumor, imaging examinations (ultrasound, enhanced CT or MRI) often cannot determine their benign or malignant properties.4,22,23 (2) In solid renal tumors, the MRI appearance of renal angiomyolipoma with a lower fat component may be similar to that of RCC, which makes them difficult to distinguish.24 (3) Although benign lesions are more common in renal cystic lesions, there are also rare cystic RCCs, which are easily misdiagnosed or missed in conventional imaging diagnosis.25 For patients with the abovementioned conditions, if the operations are hastily performed and the postoperative pathology demonstrates benign lesions, the patients will not only suffer from pain but also may lose their kidneys. According to Rossi SH, 20% of patients underwent unnecessary surgery.26 If watchful observation is adopted, the opportunity for surgery may be lost because of the metastasis of malignant tumors. Therefore, research on the early diagnosis of RCC and the differential diagnosis of benign and malignant renal tumors has outstanding clinical value and significance. Thus, the search for a safe and accurate imaging diagnostic method has become the focus of clinical attention.
Compared with MRI and CT, ultrasound imaging has the advantages of being convenient, nontraumatic and nonradiating and can dynamically display lesions of the kidney and its surrounding tissues in real time.7 Contrast-enhanced ultrasound technology can display the microblood perfusion of the tumor in real time on the basis of conventional ultrasound.8,9,27 It has good clinical value and application prospects in the differential diagnosis of benign and malignant renal tumors. Currently, the particle size of ultrasound contrast agents that are used in clinical practice is more than 2 μm, which can effectively realize tumor microcirculation perfusion imaging. However, due to the fact that these ultrasound contrast agents cannot pass through the tumor blood vessels, they belong to blood pool imaging and cannot truly realize ultrasound molecular imaging for cells in the tumor tissue. For renal tumors that are not rich in blood vessels and that are in the early stage of small renal tumors, enhanced imaging is often not obvious, and the value of differential diagnosis is limited.
Studies have confirmed that nanoscale ultrasound contrast agents with particle sizes less than 700 nm can take advantage of the EPR effect of tumor blood vessels through the tumor blood vessels into the tumor tissue space and can achieve ultrasound molecular targeted imaging of extravascular tumor tissues.10–12,28 On this basis, the advent of targeted ultrasound molecular imaging provides a new research direction for the early diagnosis of tumors. In our previous studies, we constructed and prepared prostate-specific membrane antigen (PSMA) antibody-, nanobody- and aptamer-loaded targeted NBs with a particle size of approximately 400–600 nm, which can pass through blood vessels and bind to PSMA in the prostate cancer cell membrane.29–31 The targeted molecular imaging of prostate cancer was achieved. Further studies found that the ultrasound molecular imaging mode was the grayscale enhancement mode, and the imaging effect was not intuitive. Quantitative analysis software was needed to clarify the difference between targeted and nontargeted NBs, and image analysis needs to be completed after the performance, which is not conducive to rapid diagnosis and accurate intraoperative guidance. Therefore, we considered the construction of a targeted multimodal imaging method combined with photoacoustic imaging on the basis of targeted ultrasound molecular imaging to provide a new method and strategy for the early diagnosis and differential diagnosis of RCC.
Multimodal imaging technology uses two or more imaging modalities to image the same object to obtain comprehensive information, which is conducive to the differential diagnosis of tumors.18,32,33 Photoacoustic imaging is an emerging biomedical imaging technology that has become an innovative method in the field of biomedical imaging in recent years due to its advantages of being nonionizing and noninvasive, as well as possessing high penetration and low cost. Photoacoustic imaging technology can provide high-contrast and high-resolution images for the early detection of tumors and can also monitor the treatment process and efficacy of tumors.34 The rapid growth of tumors is inseparable from the rich vascular system. Previous studies have shown that tumors are closely related to angiogenesis. Photoacoustic imaging utilizes the imaging mechanism of photoinduced ultrasound to select specific laser wavelengths to detect chemical components in tumor tissues, thereby enabling high-contrast structural imaging of tumor tissue. ICG has a strong binding ability to plasma proteins in the vasculature and is widely used for tumor photoacoustic imaging.16–18 On the basis of ultrasound molecular imaging combined with the advantages of tumor photoacoustic imaging, the construction of multimodal targeted NBs can better utilize the advantages of ultrasound and photoacoustic molecular imaging, which is conducive to the accurate diagnosis and real-time evaluation of tumors.
In this study, ICG was encapsulated in the lipid layer of gas-containing NBs, which not only enhanced ultrasound imaging but also utilized the ability of ICG for photoacoustic imaging. In vitro experiments confirmed that the NBs that we prepared had a multimodal imaging ability, and a higher concentration corresponded to a greater imaging intensity. To enhance tumor imaging in vivo, in addition to taking advantage of abundant tumor vascularity, it is necessary to allow more NBs to enter the interstitial space to bind to tumor cells and to allow the NBs to remain in the interstitial space as much as possible. Therefore, we must endow NBs with the ability to target and bind to tumor cells. In this study, CA IX, which is a membrane antigen that is highly expressed by RCC cells, was used to achieve targeted binding.
CA IX, which is a transmembrane glycoprotein, is a membrane antigen that is highly expressed in RCC (but not in normal renal tissues).19 It plays an important role in the diagnosis, prognosis and treatment of RCC. Jiang et al reported of 62 cases of RCC, in which CA IX mRNA was detected in 82.3% of the tumor tissues, and the positive rate of CA IX mRNA was 98% in the tumor tissues of patients with renal clear cell carcinoma.35 Additionally, Bui et al studied 224 cases of renal clear cell carcinoma and found that 208 cases (93%) had CA IX expression, 180 cases (80%) had high CA IX expression and the expression was mainly located in the tumor area. CAIX expression did not correlate with tumor TMN stage, Fuhrman grade or metastasis.36 Moreover, RCC in the T1 stage (early stage) usually highly expresses CA IX,37 thus making CA IX very valuable for early diagnosis of RCC. The 786-O cell line that was used in this study (which is a human RCC cell line) expresses CA IX, whereas ACHN (which was used as a control and is derived from RCC pleural effusion metastases) does not express CA IX. Soluble form of carbonic anhydrase IX could be detected in the serum by ELISA,38 but the content is very low and does not affect the targeted molecular imaging of tumor tissue.
Substances that can specifically bind to antigens include antibodies, nanobodies, polypeptides and aptamers. Monoclonal antibodies, polyclonal antibodies and nanoantibodies possess the weakness of strong immunogenicity. While polypeptide molecules have the advantages of a low molecular mass, high selectivity and specificity, strong cell permeability, easy modifications without affecting their characteristics and low immunogenicity, so polypeptides are ideal ligands in molecular imaging. Rana et al selected a polypeptide molecule known as PGLR-P1 (sequence: NMPKDVTTRMSS) targeting the CAIX proteoglycan region by using phage display library technology and evaluated its binding ability with the CA IX protein molecule.20 Zhu et al further confirmed that the PGLR-P1 polypeptide can specifically target and bind to CAIX-expressing tumor cells (786-O, HeLa), and NBs carrying the polypeptides can specifically target and bind to CAIX-positive tumor cells.21 Based on these findings, PGLR-P1 was directly selected as a ligand of CA IX, and ICG-loaded NBs carrying PGLR-P1 were confirmed to bind specifically to 786-O cells.
This study overcomes the shortcomings of the micrometer-scale bubbles that are currently used in clinical practice through an ingenious design. Microbubbles cannot pass through the tumor blood vessels into the tissue space and cannot directly combine with tumor cells; therefore, they can only realize blood pool imaging. The targeted nanobubble ACP/ICG-NBs that we prepared (with a particle size of 475.9 nm) can use the EPR effect to pass through the microvessels of the tumor into the tumor tissue space and bind to the tumor cells so that they can remain in the tumor tissue for a long period of time. However, ICG-NBs, which are nontargeted NBs, have a short retention time in the tissue space due to their inability to bind to tumor cells. Immunohistofluorescence confirmed the presence and enrichment of the targeted NBs in the interstitial space. This provided us with the possibility for enhanced ultrasound imaging, photoacoustic imaging and fluorescence imaging. In our experiments, ultrasound, photoacoustic and fluorescence imaging of subcutaneous xenograft tumors in nude mice validated our experimental design and assumptions. First, in the in vivo ultrasound study, for CA IX-expressing RCC xenografts, the duration time of enhancement and AUC of targeted NBs were significantly higher than those of nontargeted NBs, which was apparently inseparable from the targeted NBs binding to RCC cells and retention in tumor tissue space in large numbers. Targeted NBs and nontargeted NBs have no significant difference in the duration time of enhancement and AUC for ultrasound-enhanced imaging of RCC xenograft tumors that do not express CA IX, which also confirmed that targeted NBs mainly enhanced imaging by binding to CA IX. Second, in the in vivo photoacoustic imaging, for RCC xenograft tumors expressing CA IX, the photoacoustic intensity of targeted NBs was stronger and lasted longer than that of nontargeted NBs, whereas for CA IX-negative xenograft tumors, there was no difference in photoacoustic imaging between the two types of NBs. In this study, a nanobubble contrast agent was used to achieve ultrasound and photoacoustic imaging. Both imaging methods can be used to identify benign and malignant renal tumors. Furthermore, the combination of the two methods is more helpful for making a clear diagnosis. If the tumor is malignant, it will enhance the ultrasound or photoacoustic imaging due to its expression of CA IX. On the contrary, if the ultrasound or photoacoustic imaging of a tumor is enhanced, it can be preliminarily judged that the possibility of malignancy is high.
The targeted NBs that we prepared possessed fluorescence imaging ability, and the fluorescence originated from the ICG encapsulated in the NBs. ICG is a bottle green substance that is soluble in water. In addition, it has been clinically used in hepatobiliary surgery and ophthalmic angiography for many years.39,40 The principle of infrared fluorescence imaging is that after ICG enters the blood, it combines with hemoglobin, flows with the blood to various organs of the body and is finally taken up and metabolized in the liver. ICG in organs and blood vessels can be identified by infrared light waves and imaged on an infrared fluorescent display, thus providing navigation for clinical operations. In recent years, infrared fluorescence technology using ICG as a contrast agent has been clinically applied in urology. This type of fluorescence imaging technology is mainly used in kidney surgery, prostate cancer lymphatic dissection and ureteral stricture surgery.41,42 In this study, ICG encapsulated in the NBs can enter the tumor tissue space from the blood vessels, enhance the fluorescence imaging of tumors and prolong the imaging time. Moreover, it has potential application value for the observation and confirmation of surgical resection margins and lymph node tracing during tumor resection.
From the results of this study, the three imaging methods have their own advantages and disadvantages. Enhanced ultrasound imaging is simple to operate, the tissue contrast is clear, and the lesion tissue and its microvascular perfusion can be dynamically observed in real time. However, it has the disadvantage of not being intuitive enough, and some lesion images need to be quantitatively analyzed later. Photoacoustic imaging has high sensitivity and clear tissue contrast images. The red fluorescence of ICG can directly determine the signal intensity, which is more intuitive and conducive to the accurate diagnosis and localization of tumors. However, it has the disadvantage of low image resolution. Fluorescence imaging is more intuitive than those of other methods, but the spatial information is much worse than those of the other two methods. Therefore, the diagnosis and differential diagnosis of RCC mainly rely on ultrasound and photoacoustic imaging, and the organic combination of the two can improve the diagnostic efficiency.
The main components of the nanobubbles are lipids and ICG. In vivo, nanobubbles will eventually be decomposed into ICG and lipids after rupture. ICG is mainly metabolized in the liver, taken up by hepatocytes in the hepatic sinusoids, and secreted into the bile in a free form. ICG does not participate in chemical reactions in the body, has no enterohepatic circulation, no lymphatic reflux, and is not excreted from the kidney and other extrahepatic organs. The plasma half-life of ICG is 3 to 4 min. The ICG in this study was encapsulated in the lipid of the nanobubbles, and its metabolism time was longer than that of ICG injected directly into the blood. ICG is the only cyanine dye approved by the US Food and Drug Administration. It is safe and non-toxic and has been widely used in clinical practice. Lipids are also metabolized by the liver and are non-toxic and harmless. Therefore, the nanobubbles we prepared could ensure the safety of use in vivo.
Conclusion
The ICG- and ACP-loaded targeted nanobubbles that we prepared have the capability of ultrasound, photoacoustic and fluorescence multimodal imaging and can specifically enhance the ultrasonic and photoacoustic imaging of RCC xenograft tumors, which has potential clinical application value for the diagnosis of RCC at the early stage and the differential diagnosis of benign and malignant kidney tumors.
Acknowledgments
Many thanks to Professor Pan Li and his team from Chongqing Institute of Ultrasound Imaging for their support of the photoacoustic part of this study.
Disclosure
The authors report no conflicts of interest in this work.
References
1. Siddiqi A, Rani M, Bansal P, Rizvi MMA. Renal cell carcinoma management: a step to nano-chemoprevention. Life Sci. 2022;308:120922. doi:10.1016/j.lfs.2022.120922
2. Gray RE, Harris GT. Renal cell carcinoma: diagnosis and management. Am Fam Physician. 2019;99(3):179–184.
3. Bahadoram S, Davoodi M, Hassanzadeh S, Bahadoram M, Barahman M, Mafakher L. Renal cell carcinoma: an overview of the epidemiology, diagnosis, and treatment. G Ital Nefrol. 2022;39(3):1.
4. Abou Elkassem AM, Lo SS, Gunn AJ, et al. Role of imaging in renal cell carcinoma: a multidisciplinary perspective. Radiographics. 2021;41(5):1387–1407. doi:10.1148/rg.2021200202
5. Nishikawa M, Miyake H, Kitajima K, et al. Preoperative differentiation between benign and malignant renal masses smaller than 4 cm treated with partial nephrectomy. Int J Clin Oncol. 2015;20(1):150–155. doi:10.1007/s10147-014-0673-7
6. Erman M, Benekli M, Basaran M, et al. Renal cell cancer: overview of the current therapeutic landscape. Expert Rev Anticancer Ther. 2016;16(9):955–968. doi:10.1080/14737140.2016.1222908
7. Chen M, Fu X, Shen Y. Evaluation of multimode color Doppler flow imaging in the diagnosis of solid renal tumor. Contrast Media Mol Imaging. 2021;2021:6656877. doi:10.1155/2021/6656877
8. Liu H, Cao H, Chen L, et al. The quantitative evaluation of contrast-enhanced ultrasound in the differentiation of small renal cell carcinoma subtypes and angiomyolipoma. Quant Imaging Med Surg. 2022;12(1):106–118. doi:10.21037/qims-21-248
9. Geyer T, Schwarze V, Marschner C, et al. Diagnostic performance of Contrast-Enhanced Ultrasound (CEUS) in the evaluation of solid renal masses. Medicina. 2020;56(11):624. doi:10.3390/medicina56110624
10. Tong HP, Wang LF, Guo YL, et al. Preparation of protamine cationic nanobubbles and experimental study of their physical properties and in vivo contrast enhancement. Ultrasound Med Biol. 2013;39(11):2147–2157. doi:10.1016/j.ultrasmedbio.2013.05.016
11. Yin T, Wang P, Zheng R, et al. Nanobubbles for enhanced ultrasound imaging of tumors. Int J Nanomedicine. 2012;7:895–904. doi:10.2147/IJN.S28830
12. Yu Z, Hu M, Li Z, et al. Anti-G250 nanobody-functionalized nanobubbles targeting renal cell carcinoma cells for ultrasound molecular imaging. Nanotechnology. 2020;31(20):205101. doi:10.1088/1361-6528/ab7040
13. Fang K, Wang L, Huang H, et al. Construction of nucleolin-targeted lipid nanobubbles and contrast-enhanced ultrasound molecular imaging in triple-negative breast cancer. Pharm Res. 2020;37(7):145. doi:10.1007/s11095-020-02873-1
14. Steinberg I, Huland DM, Vermesh O, Frostig HE, Tummers WS, Gambhir SS. Photoacoustic clinical imaging. Photoacoustics. 2019;14:77–98. doi:10.1016/j.pacs.2019.05.001
15. Sivasubramanian M, Lo LW. Assessment of nanoparticle-mediated tumor oxygen modulation by photoacoustic imaging. Biosensors. 2022;12(5):336. doi:10.3390/bios12050336
16. Morales-Conde S, Licardie E, Alarcón I, Balla A. Indocyanine green (ICG) fluorescence guide for the use and indications in general surgery: recommendations based on the descriptive review of the literature and the analysis of experience. Cir Esp. 2022;100(9):534–554. doi:10.1016/j.cireng.2022.06.023
17. Fu Q, Zhu R, Song J, Yang H, Chen X. Photoacoustic imaging: contrast agents and their biomedical applications. Adv Mater. 2019;31(6):e1805875. doi:10.1002/adma.201805875
18. Hannah A, Luke G, Wilson K, Homan K, Emelianov S. Indocyanine green-loaded photoacoustic nanodroplets: dual contrast nanoconstructs for enhanced photoacoustic and ultrasound imaging. ACS Nano. 2014;8(1):250–259. doi:10.1021/nn403527r
19. Uemura H, Nakagawa Y, Yoshida K, et al. MN/CA IX/G250 as a potential target for immunotherapy of renal cell carcinomas. Br J Cancer. 1999;81(4):741–746. PMID: 10574265. doi:10.1038/sj.bjc.6690757
20. Rana S, Nissen F, Lindner T, et al. Screening of a novel peptide targeting the proteoglycan-like region of human carbonic anhydrase IX. Mol Imaging. 2013;12(8):
21. Zhu L, Guo Y, Fan X, et al. Synthesis of anti-CAIX proteoglycan-like region peptide and evaluation of its target binding ability. J Third Milit Med Univ. 2016;38(17):1905–1909.
22. Bray F, Ferlay J, Soerjomataram I, Siegel RL, Torre LA, Jemal A. Global cancer statistics 2018: GLOBOCAN estimates of incidence and mortality worldwide for 36 cancers in 185 countries. CA Cancer J Clin. 2018;68(6):394–424. doi:10.3322/caac.21492
23. Rossi SH, Prezzi D, Kelly-Morland C, Goh V. Imaging for the diagnosis and response assessment of renal tumours. World J Urol. 2018;36(12):1927–1942. doi:10.1007/s00345-018-2342-3
24. Flum AS, Hamoui N, Said MA, et al. Update on the diagnosis and management of renal angiomyolipoma. J Urol. 2016;195(4 Pt 1):834–846. doi:10.1016/j.juro.2015.07.126
25. Zeng SE, Du MY, Yu Y, et al. Ultrasound, CT, and MR imaging for evaluation of cystic renal masses. J Ultrasound Med. 2022;41(4):807–819. doi:10.1002/jum.15762
26. Rossi SH, Newsham I, Pita S, et al. Accurate detection of benign and malignant renal tumor subtypes with MethylBoostER: an epigenetic marker-driven learning framework. Sci Adv. 2022;8(39):eabn9828. doi:10.1126/sciadv.abn9828
27. Aggarwal A, Goswami S, Das CJ. Contrast-enhanced ultrasound of the kidneys: principles and potential applications. Abdom Radiol. 2022;47(4):1369–1384. doi:10.1007/s00261-022-03438-z
28. Ravi Kiran AVVV, Kusuma Kumari G, Krishnamurthy PT, Khaydarov RR. Tumor microenvironment and nanotherapeutics: intruding the tumor fort. Biomater Sci. 2021;9(23):7667–7704. doi:10.1039/d1bm01127h
29. Wang L, Li L, Guo Y, et al. Construction and in vitro/in vivo targeting of PSMA-targeted nanoscale microbubbles in prostate cancer. Prostate. 2013;73(11):1147–1158. doi:10.1002/pros.22663
30. Fan X, Guo Y, Wang L, Xiong X, Zhu L, Fang K. Diagnosis of prostate cancer using anti-PSMA aptamer A10-3.2-oriented lipid nanobubbles. Int J Nanomedicine. 2016;11:3939–3950. doi:10.2147/IJN.S112951
31. Fan X, Wang L, Guo Y, et al. Ultrasonic nanobubbles carrying anti-PSMA nanobody: construction and application in prostate cancer-targeted imaging. PLoS One. 2015;10(6):e0127419. doi:10.1371/journal.pone.0127419
32. Wang S, Zhao Y, Xu Y. Recent advances in applications of multimodal ultrasound-guided photoacoustic imaging technology. Vis Comput Ind Biomed Art. 2020;3(1):24. doi:10.1186/s42492-020-00061-x
33. Bang JI, Kim JY, Choi MC, Lee HY, Jang SJ. Application of multimodal imaging biomarker in the differential diagnosis of ovarian mass: integration of conventional and molecular imaging. Clin Nucl Med. 2022;47(2):117–122. doi:10.1097/RLU.0000000000004008
34. Lin L, Wang LV. Photoacoustic imaging. Adv Exp Med Biol. 2021;3233:147–175. doi:10.1007/978-981-15-7627-0_8
35. Jiang Y, Ren F, Zheng S. The expression of carbonic anhydrase IX (CA IX/G250) mRNA in patients with renal cell carcinoma. Chin J Clin. 2012;6(8):2112–2114.
36. Bui MH, Visapaa H, Seligson D, et al. Prognostic value of carbonic anhydrase IX and KI67 as predictors of survival for renal clear cell carcinoma. J Urol. 2004;171(6 Pt 1):2461–2466. doi:10.1097/01.ju.0000116444.08690.e2
37. Wang Y, Yin L, Cui Y, et al. Prognostic significance of membranous carbonic anhydrase IX expression in patients with nonmetastatic clear cell renal cell carcinoma of different tumor stages. Cancer Biother Radiopharm. 2022;37(6):494–502. doi:10.1089/cbr.2020.3948
38. Závada J, Závadová Z, Zat’ovicová M, et al. Soluble form of carbonic anhydrase IX (CA IX) in the serum and urine of renal carcinoma patients. Br J Cancer. 2003;89(6):1067–1071. doi:10.1038/sj.bjc.6601264
39. Cassinotti E, Boni L, Baldari L. Application of indocyanine green (ICG)-guided surgery in clinical practice: lesson to learn from other organs-an overview on clinical applications and future perspectives. Updates Surg. 2023;75(2):357–365. doi:10.1007/s13304-022-01361-y
40. Mahendradas P, Maruyama K, Mizuuchi K, Kawali A, Kitaichi N. Multimodal imaging in ocular sarcoidosis. Ocul Immunol Inflamm. 2020;28(8):1205–1211. doi:10.1080/09273948.2020.1751210
41. Esposito C, Autorino G, Coppola V, et al. Technical standardization of ICG near-infrared fluorescence (NIRF) laparoscopic partial nephrectomy for duplex kidney in pediatric patients. World J Urol. 2021;39(11):4167–4173. doi:10.1007/s00345-021-03759-6
42. Petrut B, Bujoreanu CE, Porav Hodade D, et al. Indocyanine green use in urology. J BUON. 2021;26(1):266–274.
 © 2023 The Author(s). This work is published and licensed by Dove Medical Press Limited. The
full terms of this license are available at https://www.dovepress.com/terms
and incorporate the Creative Commons Attribution
- Non Commercial (unported, 3.0) License.
By accessing the work you hereby accept the Terms. Non-commercial uses of the work are permitted
without any further permission from Dove Medical Press Limited, provided the work is properly
attributed. For permission for commercial use of this work, please see paragraphs 4.2 and 5 of our Terms.
© 2023 The Author(s). This work is published and licensed by Dove Medical Press Limited. The
full terms of this license are available at https://www.dovepress.com/terms
and incorporate the Creative Commons Attribution
- Non Commercial (unported, 3.0) License.
By accessing the work you hereby accept the Terms. Non-commercial uses of the work are permitted
without any further permission from Dove Medical Press Limited, provided the work is properly
attributed. For permission for commercial use of this work, please see paragraphs 4.2 and 5 of our Terms.