Back to Journals » Drug Design, Development and Therapy » Volume 13
In vitro comparative quality assessment of different brands of norfloxacin tablets available in Jimma, Southwest Ethiopia
Authors Hambisa S ![]() , Belew S, Suleman S
, Belew S, Suleman S ![]()
Received 2 October 2018
Accepted for publication 10 February 2019
Published 17 April 2019 Volume 2019:13 Pages 1241—1249
DOI https://doi.org/10.2147/DDDT.S189524
Checked for plagiarism Yes
Review by Single anonymous peer review
Peer reviewer comments 3
Editor who approved publication: Dr Qiongyu Guo
Solomon Hambisa,1 Sileshi Belew,2,3 Sultan Suleman2,4
1Department of Pharmacy, College of Health Sciences, Mizan-Tepi University, Mizan-Teferi, Ethiopia; 2Jimma University Laboratory of Drug Quality (JuLaDQ), Jimma University, Jimma, Ethiopia; 3School of Veterinary Medicine, Jimma University, Jimma, Ethiopia; 4School of Pharmacy, Jimma University, Jimma, Ethiopia
Background: Pharmaceuticals play a pivotal role in maintaining human health and promoting well-being. However, safety, efficacy, and quality of the drugs should be ascertained to provide a desired pharmacological effect.
Aim: The aim of the present study was to determine the quality as well as the physicochemical equivalence of nine brands of norfloxacin tablets marketed in Jimma, Ethiopia.
Methods: Nine norfloxacin brands were subjected to in vitro tests associated with quality of tablet dosage form, and the tests were conducted according to procedures described in the United States Pharmacopeia (USP).
Results: This study indicated that all brands of norfloxacin complied with the USP for uniformity of weight, friability, hardness, and assay of active ingredient. However, two of the nine brands evaluated failed to release 80% of their drug contents within 30 minutes as outlined in the USP. Correspondingly, all of the brands studied were within the specification for hardness test. Furthermore, different dissolution profile comparison methods have proven the similarity in dissolution profile of Negaflox and Norcin with the comparator product (Trizolin). Mathematical models-dependent approaches have shown that the drug release data fit well to the Weibull release model.
Conclusion: The physicochemical evaluation showed that all the norfloxacin brands met the quality specification with respect to uniformity of weight, hardness, friability, and assay. With regard to dissolution test, two brands of norfloxacin were found to be out of the specified pharmacopeial requirement. The study also revealed the similarity in the dissolution profile of two brands of norfloxacin with the comparator product.
Keywords: norfloxacin, assay, uniformity of weight, hardness, friability, dissolution profile, Jimma
Background
Norfloxacin is a synthetic antibacterial agent belonging to the group of fluoroquinolones,1,2 and it is the first fluoroquinolone that obtained approval from United States Food and Drug Administration (USFDA) for use in clinical settings in 1984.3 This drug is chemically known as 1-ethyl-6-fluoro-1,4-dihydro-4-oxo-7-(1-piperazinyl)–3-quinolinecarboxylicacid1,2 and commonly prescribed for the treatment of urinary, respiratory, and gastrointestinal tracts infections.4 It is also active against clinically relevant pathogens responsible for causing sexually transmitted diseases, sinuses, and prostate infections.5,6
Pharmaceuticals play a pivotal role in maintaining human health and promoting well-being. However, safety, efficacy, and quality of the drugs should be ascertained to provide a desired pharmacological effect.7 On the other hand, pharmaceuticals must fulfill regulatory requirements to claim it is a quality drug.8 Moreover, to ensure safety and efficacy of pharmaceutical products, the quality of pharmaceuticals must be reliable.9 Therefore, in order to obtain the required quality drugs, manufacturers should undertake routine laboratory testing at various intervals during and post production process of the drugs.10
World Health Organization (WHO) encourages the practice of prescribing generic drugs in order to decrease health care costs and improve the overall healthcare delivery systems.11 Thus, the quality, safety, and efficacy of multisource products should be demonstrated together with their possible interchangeability.12 However, the availability of multisource drugs have been accompanied by the widespread distribution of counterfeit and substandard drug products.13 This is a serious public health problem that is significantly higher in poor and emerging economies.14,15 Furthermore, the consumption of poor quality drugs is characterized by numerous consequences including treatment failure, drug resistance, increased morbidity and mortality.14 Similarly, the absence of strong drug regulatory authorities and poor quality control practices in some countries have resulted in the availability of poor-quality drugs.16,17
A study conducted by WHO by reviewing published papers of 88 of the 194 WHO Member States found that from total 48,218 samples tested, 11.8% of samples were substandard and falsified exclusively for antimalarial.18 Also, the existing data suggest that anti-infectives and anti-parasites are the two leading classes of medicines counterfeited in developing countries,19 and another WHO study finding revealed that 28% of antibiotic examined failed to pass quality requirements.20 A recent nationwide survey carried out in Ethiopia by Suleman et al on quality of medicines commonly used in the treatment of soil-transmitted helminths and giardia (mebendazole, albendazole, and tinidazole) found that 45.3% of the sampled medicines did not fulfilled pharmacopoeial quality specifications.21 These facts directed all concerned parties to conduct quality assessment studies on available drug products circulating in the market to expose substandard drug products. Hence, the objective of the present study was to determine the quality as well as physicochemical equivalence of imported and locally manufactured norfloxacin tablets marketed in Jimma town, Ethiopia.
Materials and methods
Collection of samples
All available nine brands of norfloxacin tablets, each with a label claim of 400 mg were purchased from licensed drug retail outlets and hospital pharmacy that are located in Jimma town, Ethiopia. Regarding sampling strategies, WHO Guidelines on the Conduct of Surveys of the Quality of Medicines were used for this purpose. Accordingly, a convenience sampling technique was used for sample collection sites while overt sampling technique was considered for sample collection. The experimental part of the work was undertaken at Jimma University drug quality laboratory (JuLaDQ), and the study was performed before product expiration dates. Due to unavailability of norfloxacin innovator product in Ethiopian drug market, from examined brands, one product (N9) was selected as the comparator product. Selection of comparator product was based on National Pharmaceutical Regulatory Agency comparator products list on inaccessibility of innovator and Guidance on the Selection of Comparator Pharmaceutical Products for Equivalence Assessment of Interchangeable Multisource (Generic) Products, which reveal selection of product that has been granted approval in an ICH-associated country.12,22 Detailed information on norfloxacin tablets included in the study is given in Table 1. The products were coded randomly for purposes of the research.
 | Table 1 Label information of different brands of norfloxacin tablets evaluated in the study |
Instruments
HPLC (Agilent 1260 Series, Darmstadt, Germany), Analytical Balance (Mettler Toledo, Greifensee, Switzerland), RC-6D Dissolution Apparatus (Apparatus 2; Tian Jin Optical Instruments, Tianjin, China), UV–Vis Spectrophotometer (Cecil Instruments, Cambridge, United Kingdom), Hardness Tester (Pharma Test, Hainburg, Germany), Friability Tester (Pharma Test), and Water Purification System (Thermo Scientific, Model-7143, Waltham, MA, USA) were used for the study.
Chemicals and reagents
Acetonitrile (CARLO ERBA Reagents), sodium hydroxide (UniChem chemical reagent, Hinxton, United Kingdom), phosphoric acid (Reagent Chemical Service Ltd, Runcorn, United Kingdom), monobasic sodium phosphate (Sigma-Aldrich, Hamburg, Germany), glacial acetic acid (Reagent Chemical Service Ltd), and Ultra-pure water (JuLaDQ) were used for the study, and United States Pharmacopeia (USP) norfloxacin reference standard (RS) was kindly obtained from Cadila Pharmaceuticals Plc (Addis Ababa, Ethiopia).
Methods
The quality of the norfloxacin tablets was assessed according to procedures outlined in the USP. Similarly, the following in vitro quality control parameters were considered for the products under the investigation.
Weight variation
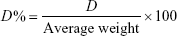
Twenty tablets of each brand were randomly selected and weighed individually on an analytical balance and their average weight was determined. Then, the percentage deviation from the average was calculated using the following formula.23
|
|

|
|
As stated in the USP-2015, the tablet passes the test if not more than two of the individual weights deviate from the average weight by >5% and none deviated by 10%.23
Friability
Twenty tablets from each brand were randomly selected and weighed initially before undergoing friability test on an analytical balance. The tablets were then placed in the drum of the friability tester and rotated at 100 revolutions for 4 minutes. After the procedure was completed, the tablets were dedusted and reweighed. The percent loss in weight was calculated as friability. According to USP for friability, the weight loss should not be more than 1%. Percentage of weight loss is calculated as follows:23
|
|

Hardness test
The crushing strength was determined with tablet hardness tester. Ten tablets were randomly selected from each brand and the pressure at which each tablet crushed was recorded. Tablets that have hardness >50 Newton (N) are generally considered acceptable.24
Assay of the active ingredients23
Chromatographic system
HPLC equipped with a 275-nm detector and a 3.9 mm ×30-cm column packed with a stationary phase of 5-μm particle size was used. Column preconditioning was performed for 8 hours with degassed 0.01 M monobasic sodium phosphate adjusted with phosphoric acid to a pH 4.0. A mixture of filtered and degassed phosphoric acid solution (1 in 1,000) and acetonitrile (850:150) was employed as a mobile phase. The flow rate used for preconditioning and assay was 0.5 and 2 mL/minute, respectively. The injection volume used was 10 μL.
Preparation of samples
Twenty tablets from each brand of norfloxacin were weighed and finely powdered. A portion of powder equivalent to about 100 mg of norfloxacin was transferred to a 200 mL volumetric flask and dissolved with 80 mL of mobile phase. This solution was sonicated for 10 minutes and diluted with phosphoric acid solution (1 in 1,000) to volume and mixed. Ten mL of the solution was transferred to a 25 mL volumetric flask and diluted with mobile phase to volume and mixed. Finally, this solution was filtered through a filter having a porosity of 0.4 μm.
On the other hand, an accurately weighed 20 mg of USP norfloxacin RS was dissolved and diluted quantitatively in mobile phase to obtain RS solution having a known concentration of about 0.2 mg/mL.
The quantity, in mg, of norfloxacin in the portion of tablets was calculated using the following formula:
|
|

where C is the concentration, in mg/mL, of USP norfloxacin RS in the standard preparation, and r u and r s are norfloxacin peak responses obtained from the assay preparation and the standard preparation, respectively.
Construction of calibration curve
Various concentrations of the RSs of norfloxacin were prepared by dissolving RSs in mobile phase and their respective peak areas were determined chromatographically. Peak areas were determined at the following concentration levels: 160, 180, 200, 220, and 240 μg/mL. Then, concentrations of norfloxacin against peak area were plotted to obtain the calibration curves. The linear regression equations were also derived as shown in Figure 1. The regression equation is: y=34.425x+3,923.5, where y is the peak response and x is the concentration in μg/mL. Also, the value of correlation coefficient (r2) 0.9904 indicates a good linear correlation between the concentration of the test sample and the response (peak area).
 | Figure 1 Calibration curve of norfloxacin reference standard in the concentration range of 160–240 μg/mL. |
System suitability test
The system suitability was checked by analyzing capacity factor, column efficiency, tailing factor (symmetricity of the peak), and precision. The precision of the method was evaluated through intra-day repeatability of responses after triplicate injections of three levels of norfloxacin RS solution. For the three levels of norfloxacin RS solution, relative standard deviation was calculated from the peak area obtained from replicate injections. The system is found suitable in respect of all of these system suitability tests (SSTs) as per requirements of USP.22 The SST results are listed in Table 2.
 | Table 2 System suitability test results for chromatographic method of assay of norfloxacin tablets |
Dissolution studies
The dissolution test was conducted according to the USP monograph on six tablets of each brand using dissolution tester equipped with rotary paddles (USP Apparatus 2) operated at 50 revolutions per minute. The dissolution medium was 750 mL acetate buffer (pH 4.0) maintained at 37°C±0.5°C. Five milliliters of dissolution medium was sampled at 5, 10, 15, 20, 30, 35, and 45 minutes with replacement of 5 mL of fresh dissolution medium for every withdrawal. After filtration and appropriate dilution, the corresponding absorbance readings of diluted filtrates were taken by UV-Vis spectrophotometer at a wavelength of 278 nm.23
Calibration curve for dissolution test method
A stock solution was prepared by dissolving 10 mg of norfloxacin USP RS in 100 mL of acetate buffer, pH 4.0. The six concentration levels 1, 2, 3, 4, 5, 6 μg/mL were then prepared from the stock by diluting 1, 2, 3, 4, 5, and 6 mL of the stock solution to 100 mL with acetate buffer. Their absorbances were determined spectrophotometrically. Besides, concentrations of norfloxacin against absorbance were plotted to obtain the calibration curves (Figure 2).
 | Figure 2 Calibration curve of norfloxacin reference standard in the concentration range of 1–6 μg/mL. |
As revealed on the calibration curve, a linear regression equation is Y=0.102X+0.2917, where Y is the absorbance and X is the concentration in μg/mL. Using the equation obtained from the calibration curve, the percentage release values of samples taken at times 5, 10, 15, 20, 30, 35, and 45 minutes were calculated. Additionally, this curve showed a strong linear relationship between the concentration of the tested samples and the absorbance values over the concentration range of 1–6 μg/mL (r2=0.9994).
Data analysis
Microsoft Excel 2010 and SPSS version 20 software program were used for statistical and graphical evaluations of analytical data obtained from the experimental part of the investigation. Statistically significant differences were considered when P<0.05, and one-way ANOVA was also carried out for the weight variation and assay.
The dissolution profiles of various brands of norfloxacin were compared by using ANOVA, model independent, and dissolution efficiency (DE). Model independent methods involve comparison of the two profiles only at the observed time points. This approach includes difference factor (f1 factor) and similarity factor (f2 factor). The difference factor (f1) calculates the percentage difference between the two curves (reference and test drug) at each time point and is a measurement of the relative error between the two curves. The similarity factor (f2) is a logarithmic reciprocal square root transformation of the sum of squared error and is a measurement of the similarity in the percent (%) dissolution between the two curves. The following equations were used to calculate difference factor (f1) and similarity factor (f2).25
|
|

|
|

Where n is the number of time points, Rt is the dissolution value of the reference product at time t, and Tt is the dissolution value of the test product at time t.
DE is the area under the dissolution curve within a time range, and it was calculated by using the following equation:26
|
|

where y is the drug percent dissolved at time t.
Drug release kinetics
To explain the kinetics and mechanism of drug release from the tablets, some of the most commonly used mathematical models-dependent approaches such as zero-order, first-order, Higuchi, Hixson–Crowell, and Weibull describing the dissolution curves were also employed. Different kinetic equations are given below.27
| (8) |

|
|

| (10) |

| (11) |

| (12) |

where Qt is the amount of drug dissolved in time t, Q0 is the initial amount of drug in the solution, k0 is the zero-order release constant, k1 is the first-order release constant, Kh is the Higuchi rate constant, m is accumulated fraction of the drug, β is shape parameter, Ti is location parameter, α is the scale parameter, w0 is the initial amount of drug in the pharmaceutical dosage form, wt is the remaining amount of drug in the pharmaceutical dosage form at time t, ks is a constant incorporating the surface–volume relation.
Results and discussion
Among nine brands of norfloxacin tablets included in this study, six brands were imported from foreign countries while three were manufactured locally. Furthermore, all norfloxacin brands were subjected to different quality control tests in order to assess their dissolution profile along with other quality parameters like weight variation, friability, hardness, and assay.
Weight variation
Weight variation was used to show the uniformity of content of the tablet.9 As the results of weight variation test are shown in Table 3, this study found that from all brands included in the study, brand N7 had a smaller average weight of 552.3 mg and the brand N6 had a highest average weight of 817.8 mg. But, all brands of norfloxacin tablets showed acceptable uniformity of weight as none had percentage deviation in weight >5% as stipulated by the USP. According to the specification described in USP-2015, the test for weight variation where the strength is >324 mg, the tablet passes the test if not more than two of the individual weights deviate from the average weight by >5% and none deviated by 10%.23
 | Table 3 Uniformity of weight, friability, and hardness determination of nine brands of norfloxacin tablets |
However, statistical analysis conducted using one-way ANOVA at 95% confidence interval (CI) revealed significant differences (P<0.05) among sample mean weight of all brands. Moreover, post-hoc test performed to ascertain the source of differences between generic brands and comparator product (N9) found that except for generic brand N2, there was a mean tablet weight difference between comparator and all generic brands. Correspondingly, various excipients like diluents, binders, disintegrants, lubricants, glidant, and others used in solid dosage forms may alter weight uniformity, hardness, friability, and other quality control parameters of tablets sourced from different manufacturers.28,29 Hence, the reason for the relative difference in a mean norfloxacin tablets’ weight between comparator and all brands may have been related to pharmaceutical manufacturer’s formulation conditions such as mixing, granulation methods, and amount of excipients added.30
Hardness test
This test measures the ability of tablets to withstand pressure or stress during handling, packaging, and transportation.31 The results of the hardness test are depicted in Table 3. All brands examined gave a hardness value >50 N; thus, all products conformed to fulfill the requirement for hardness test. However, the average hardness of the products is different from each other, ie, it is observed that tablet hardness ranged from 79.06 N for brand N2 to 188.79 N for brand N5. The reason for this variability between brands may have been related to pharmaceutical manufacturer’s formulation conditions such as alteration in machine speed, granulation methods, and amount of lubricants added during manufacturing processes.32
Friability test
Hardness test may not be the best measure of potential tablet behavior during handling and packaging. The loss due to abrasion or measurement of tablet friability may be a more relevant parameter.32 A current study showed that all the norfloxacin brands examined had friability values ranging from 0.02% to 0.41% (Table 3). On the other hand, all the brands passed pharmacopeial specification for friability, which states that the maximum weight loss of not more than 1% of the weight of the tablets is considered generally acceptable,23 and the result of this finding is similar to the study conducted in Bangladesh on ciprofloxacin hydrochloride brands.15
Assay of active ingredients
The result obtained from the assay of the nine brands of norfloxacin tablets evaluated in this study is presented in Table 3. According to this finding, the brand N4 had a highest percentage content of active ingredient of 106.77% and the brand N2 had a lowest percentage content of active ingredient of 95.22%. Furthermore, all products contained norfloxacin within 100%±10% of the labeled claim. As outlined in USP specifications, norfloxacin content should not be less than 90% and not more than 110% of the labeled claim of norfloxacin.23 Therefore, all brands of norfloxacin showed assay results within this compendial requirement.
Statistically, the one-way ANOVA conducted for mean difference of drug content revealed that with 95% CI, there was no significant difference (P>0.05) in the drug content among the different brands of norfloxacin examined in the study.
Dissolution studies
The rate and extent in which the drug substance from solid state is transferred into a solution is known as dissolution.33 Dissolution test is one of the in vitro quality control tests usually conducted to predict the in vivo performances of oral pharmaceutical solid dosage forms such as tablets and capsules. Additionally, this can serve as a surrogate for bioavailability and bioequivalence.34 The results of dissolution studies are graphically represented in Figure 3. As per the USP/NF specification, norfloxacin tablets should release not <80% of the labeled amount within 30 minutes using USP apparatus type II.23 The present study revealed that out of nine brands of norfloxacin tablets analyzed, seven brands passed the single point dissolution test specification of USP-2015 but brands N3 and N8 failed the test with the value of 77.05% and 74.45%, respectively. This indicates that the products may not release a significant amount of the drug for absorption into the systemic circulation.
 | Figure 3 Comparative in vitro dissolution profiles of different brands of norfloxacin tablet. |
As depicted Figure 3, different norfloxacin tablets exhibited different drug release patterns at different time points and it can be observed that N4 samples showed the slowest dissolution rate the first 10 minutes. While, the comparator product (N9) tablet released the highest (83.72%) amount of the drug at 10 minutes. Additionally, at the 15th minute, generic products N1, N5, N7, and N9 released amount of the drug within the USP requirement range. Moreover, brands N1, N2, N5, N6, N7, and N9 released greater than 50% drug within 10 minutes. On the other hand, brands N3, N4, and N8 released <40% drug within 10 minutes. The reason for the difference in drug release pattern could be mainly due to the nature and/or amount of the excipients used and processing and formulation variables.
Dissolution profile comparison
The result of one-way ANOVA statistical analysis performed at 95% CI for the pharamacopoeially specified time, 30 minutes, found that there were significant differences in the release pattern of different norfloxacin brands (P<0.05). Hence, this implies the presence of norfloxacin products that are not equivalent statistically with respect to their in vitro release profile.
In order to observe the source of significant differences in the release profile, one-way ANOVA followed by Dunnett’s test was undertaken between the comparator (N9) and other brands at 95% CI. From this comparative evaluation, all the brands with the exception of N1 and N5 brands showed significant variation (P<0.05) in percentage of dissolved norfloxacin from the comparator product at pharamacopoeially specified time, ie, 30 minutes.
Additionally, in order to demonstrate the equivalence of all the generic norfloxacin tablets and the reference brand (comparator product), a model-independent approach of difference factor (f1) and similarity factor (f2) was employed with all time points included in the in vitro dissolution studies. This approach has been adopted by USFDA in comparing release profiles of a reference and a test drug.25
In this study, model-independent methods (f1 and f2 factors) were performed for eight brands of norfloxacin by using N9 brand as reference. As the calculated f1 and f2 values are shown in Table 4, for brands N1, N5, and N7, f2 value was >50 and f1 was <15. However, brands N3, N4, and N8 had the f2value <50 and f1 value >15. To ensure similarity and bioequivalence of two dissolution profiles, f1 should be between 0 and 15 whereas f2 should be between 50 and 100.25
 | Table 4 Similarity factor (f2), difference factor (f1), and DE of norfloxacin brands |
Therefore, f2 values justify interchangeability of N1, N5, and N7 brands with the reference brand (N9) as per above specifications. However, brands N2, N3, N4, N6, and N8 had f2 values outside acceptable range specified by the USFDA, and these brands may not be bioequivalent and used interchangeably with the comparator product. On the other hand, from f1 factor results (Table 4), besides brands N1, N5, and N7, brands N2 and N6 could be considered similar to the reference brand (N9) in terms of drug release performance since these products fulfilled expected specification described for f1.
In order to ascertain the interchangeability of all products with the comparator product, the release profiles were also compared by calculating DE for various brands of norfloxacin tablets included in the study. DE up to 45 minutes was calculated from the dissolution profile of all brands of norfloxacin tablets included in the current study. From DE calculated (Table 4 shows the DE of different brands of norfloxacin along with the differences with comparator brand [N9]), N9, N1, N7, and N5 had the highest DE of 83.93%, 79.34%, 79.62%, and 78.08%, respectively when compared with the other brands while brands N4, N8, and N3 had the least value of DE. As reported by Anderson et al, the reference and the test products can be said to be equivalent if the difference between their dissolution efficiencies is within appropriate limits (±10%).35 Based on this requirement, products N1, N5, and N7 are equivalent to brand N9 (comparator) as difference of % (test product – reference product) is <10. However, the rest of the brands were far from the established limit (±10%). For this reason, all the brands with the exception of N1, N5, and N7 cannot be considered as interchangeable with reference product (N9).
Similarly, in the present work, different kinetic models were also fitted into the dissolution data of comparator and other products in order to explain the overall release of drug from the dosage forms. After fitting models to the individual unit of the dissolution data, the model that gives high correlation coefficient (r2) value is considered as the best fit of the release data.27 As revealed in Table 5, among the five models fitted to each dissolution profile, the Weibull model was the best fit to the dissolution data of all products since this model demonstrated the highest value of coefficient of correlation for all dissolution data. For this reason, it can be declared that all brands under the investigation showed the same release mechanism.
 | Table 5 Determination of correlation coefficients of different release kinetic models for nine brands of norfloxacin |
Conclusion
This study attempted to evaluate the quality as well as the physicochemical equivalence of imported and locally manufactured norfloxacin tablets. The physicochemical evaluation showed that all the tablets met the quality specification with respect to weight variation, hardness, friability, and assay. However, among all brands of norfloxacin evaluated, two products failed to fulfill pharmacopeial dissolution test requirement. With regard to comparative study conducted for release profile, all dissolution profile comparison methods have proven the similarity of the dissolution profile of brands N1 and N5 with the comparator product. Additionally, a mathematical model-dependent approach reveals the drug release data fit well to the Weibull release model. This study finding highlights the need for capacitating and enforcing regulatory mechanisms by focusing on the post-marketing evaluation of pharmaceutical products circulating in the market originated from different manufacturers.
Acknowledgments
The authors greatly thank Jimma University for providing access to research facilities during the period of laboratory work. We are also grateful to Cadila Pharmaceuticals (Ethiopia) for the kind donation of norfloxacin reference standard samples.
Disclosure
The authors report no conflicts of interest in this work.
References
Barbas R, Prohens R, Puigjaner C. A new polymorph of norfloxacin: complete characterization and relative stability of its trimorphic system. J Therm Anal Calorim. 2007;89(3):687–692. | ||
Córdoba-Borrego M, Córdoba-Díaz M, Córdoba-Díaz D. Validation of a high-performance liquid chromatographic method for the determination of norfloxacin and its application to stability studies (photo-stability study of norfloxacin). J Pharm Biomed Anal. 1999;18(6):919–926. | ||
Sharma PC, Saneja A, Jain S. Norfloxacin: a therapeutic review. Int J Chem Sci. 2008;6(4):1702–1713. | ||
NageswaraRao R, Nagaraju V. Separation and determination of synthetic impurities of norfloxacin by reversed-phase high performance liquid chromatography. J Pharm Biomed Anal. 2004;34(5):1049–1056. | ||
Lode H, Allewelt M. Role of newer fluoroquinolones in lower respiratory tract infections. J Antimicrob Chemother. 2002;49(5):709–712. | ||
Bedor DCG, Gonçalves TM, Bastos LL, et al. Development and validation of a new method for the quantification of norfloxacin by HPLC-UV and its application to a comparative pharmacokinetic study in human volunteers. Rev Bras Cienc Farm. 2007;43(2):231–238. | ||
WHO. Guidelines for the development of measures to combat counterfeit drugs. Department of essential drugs and other medicines. Geneva: WHO; 1999. WHO/EDM/QSM/99.1. | ||
Uddin S. In process and finished products quality control tests for pharmaceutical tablets according of pharmacopoeias. J Chem Pharm Res. 2015;7(9):180–185. | ||
Sahle SB, Ayane AT, Wabe NT. Comparative quality evaluation of paracetamol tablet marketed in Somali region of Ethiopia. Int J Pharm Sci Res. 2012;3(2):545–550. | ||
Uddin M, Mamun A, Rashid M, Asaduzzaman M. In-process and finished products quality control tests for pharmaceutical capsules according to pharmacopoeias. Br J Pharm Res. 2016;9(2):1–9. | ||
Fahmy S, Abu-Gharbieh E. In vitro dissolution and in vivo bioavailability of six brands of ciprofloxacin tablets administered in rabbits and their pharmacokinetic modeling. Biomed Res Int. 2014;2014(4):1–8. | ||
WHO. Guidance on the Selection of Comparator Pharmaceutical Products for Equivalence Assessment of Interchangeable Multisource (Generic) Products. Geneva: WHO, 2015. | ||
Adegbolagun OA, Olalade OA, Osumah SE. Comparative evaluation of the biopharmaceutical and chemical equivalence of some commercially available brands of ciprofloxacin hydrochloride tablets. Trop J Pharm Res. 2007;6(3):737–745. | ||
Johnston A, Holt DW. Substandard drugs: a potential crisis for public health. Br J Clin Pharmacol. 2014;78(2):218–243. | ||
Uddin MS, Mamun AA, Hossain MS, et al. In vitro quality evaluation of leading brands of ciprofloxacin tablets available in Bangladesh. BMC Res Notes. 2017;10(1):185. | ||
Kayumba PC, Risha PG, Shewiyo D, et al. The quality of essential antimicrobial and antimalarial drugs marketed in Rwanda and Tanzania: influence of tropical storage conditions on in vitro dissolution. J Clin Pharm Ther. 2004;29(4):331–338. | ||
Risha PG, Vervaet C, Vergote G, Bortel LV, Remon JP. Drug formulations intended for the global market should be tested for stability under tropical climatic conditions. Eur J Clin Pharmacol. 2003;59(2):135–141. | ||
WHO. A Study on the Public Health and Socioeconomic Impact of Substandard and Falsified Medical Products. Geneva: WHO; 2017. | ||
Takhar P, Yadav S, Dua S, Mahant S. Investigation of antibiotic usage pattern: a prospective drug utilization review. Pharmacia Letter. 2011;3(5):301–306. | ||
Ahmad K. WHO fights fake pharmaceuticals. Lancet Infect Dis. 2006;6(4):195. | ||
Suleman S, Zeleke G, Deti H, et al. Quality of medicines commonly used in the treatment of soil transmitted helminths and giardia in Ethiopia: a nationwide survey. PLoS Negl Trop Dis. 2014;8(12):e3345. | ||
NPRA. List of test products, comparator products and effective submission date for bioequivalence study report for year 2009–2010. Available from: www.npra.gov.my/images/reg info/BE/8th_generic_immediate_release_product_list_December_2015.pdf. Accessed October 1, 2018. | ||
US Pharmacopoeia National Formulary, USP 38/NF 33, United States Pharmacopoeial Convention. Rockville, MD, USA; 2015. | ||
Ts O, Nimmi I, Sm AI, Oishi TS, Ashraful Islam SM. Comparative in vitro bioequivalence analysis of some generic tablets of atorvastatin, a BCS class II compound. Banglad Pharm J. 2011;14(1):61–66. | ||
US Food and Drug Administration. Center for Drug Evaluation and Research, Guidance for industry: Dissolution Testing of Immediate Release Solid Oral Dosage Forms, 1997. | ||
Khan KA, Rhodes CT. Effect of compaction pressure on the dissolution efficiency of some direct compression systems. Pharm Act Helv. 1972;47(10):594–607. | ||
Costa P, Sousa Lobo JM. Modeling and comparison of dissolution profiles. Eur J Pharm Sci. 2001;13(2):123–133. | ||
Kharshoum RM, Aboutaleb HA. Formulation, development and evaluation of Meclozine hydrochloride microspheres. J Bioequiv Availab. 2016;8:027–032. | ||
Jethara SI, Patel MR. Enhanced solubility and dissolution rate of aceclofenac by using spray drying techniques. Intel Prop Rights. 2015;03(02):140. | ||
Ogah CO, Kadejo FF. Analysis of brands of glibenclamide tablets in Lagos market. J Innov Res Eng Sci. 2013;4(2):466–471. | ||
Akinleye M. Comparative evaluation of physicochemical properties of some commercially available brands of metformin HCl tablets in Lagos. Nigeria J Appl Pharm Sci. 2012;2(2):41–44. | ||
Birhanu G. Quality evaluation of the commonly prescribed antipsychotic drugs (chlorpromazine and thioridazine tablets) marketed in Ethiopia. Int J Pharm Sci Res. 2014;5(7):3031–3044. | ||
Karuppiah SP. Analytical method development for dissolution release of finished solid oral dosage forms. Int J Curr Pharm Res. 2012;4(2):48–53. | ||
Singh SK, Prakash D, Srinivasan KK. Dissolution testing of formulations: a regulatory, industry and academic perspective. Asian J Biochem Pharm Res. 2011;1(1):1–8. | ||
Anderson NH, Bauer M, Boussac N, et al. An evaluation of fit factors and dissolution efficiency for the comparison of in vitro dissolution profiles. J Pharm Biomed Anal. 1998;17(4–5):811–822. |
 © 2019 The Author(s). This work is published and licensed by Dove Medical Press Limited. The
full terms of this license are available at https://www.dovepress.com/terms
and incorporate the Creative Commons Attribution
- Non Commercial (unported, 3.0) License.
By accessing the work you hereby accept the Terms. Non-commercial uses of the work are permitted
without any further permission from Dove Medical Press Limited, provided the work is properly
attributed. For permission for commercial use of this work, please see paragraphs 4.2 and 5 of our Terms.
© 2019 The Author(s). This work is published and licensed by Dove Medical Press Limited. The
full terms of this license are available at https://www.dovepress.com/terms
and incorporate the Creative Commons Attribution
- Non Commercial (unported, 3.0) License.
By accessing the work you hereby accept the Terms. Non-commercial uses of the work are permitted
without any further permission from Dove Medical Press Limited, provided the work is properly
attributed. For permission for commercial use of this work, please see paragraphs 4.2 and 5 of our Terms.