Back to Journals » International Journal of Nanomedicine » Volume 12
In situ imaging of quantum dot-AZD4547 conjugates for tracking the dynamic behavior of fibroblast growth factor receptor 3
Authors Hwang G, Kim H, Yoon H ![]() , Song C, Lim D, Sim T, Lee J
, Song C, Lim D, Sim T, Lee J
Received 11 May 2017
Accepted for publication 6 July 2017
Published 26 July 2017 Volume 2017:12 Pages 5345—5357
DOI https://doi.org/10.2147/IJN.S141595
Checked for plagiarism Yes
Review by Single anonymous peer review
Peer reviewer comments 5
Editor who approved publication: Dr Thomas Webster
Gyoyeon Hwang,1,2,* Hyeonhye Kim,1,* Hojong Yoon,1 Chiman Song,1 Dong-Kwon Lim,3 Taebo Sim,1,3 Jiyeon Lee1,2
1Chemical Kinomics Research Center, Materials and Life Science Research Division, Korea Institute of Science and Technology, Seoul, 2Bio-Med, Korea University of Science and Technology, Daejeon, 3KU-KIST Graduate School of Converging Science and Technology, Korea University, Seoul, Republic of Korea
*These authors contributed equally to this work
Abstract: Fibroblast growth factor receptors (FGFRs) play an important role in determining cell proliferation, differentiation, migration, and survival. Although a variety of small-molecule FGFR inhibitors have been developed for cancer therapeutics, the interaction between FGFRs and FGFR inhibitors has not been well characterized. The FGFR–inhibitor interaction can be characterized using a new imaging probe that has strong, stable signal properties for in situ cellular imaging of the interaction without quenching. We developed a kinase–inhibitor-modified quantum dot (QD) probe to investigate the interaction between FGFR and potential inhibitors. Especially, turbo-green fluorescent protein-FGFR3s were overexpressed in HeLa cells to investigate the colocalization of FGFR3 and AZD4547 using the QD-AZD4547 probe. The result indicates that this probe is useful for investigating the binding behaviors of FGFR3 with the FGFR inhibitor. Thus, this new inhibitor-modified QD probe is a promising tool for understanding the interaction between FGFR and inhibitors and for creating future high-content, cell-based drug screening strategies.
Keywords: quantum dot, fibroblast growth factor 3, AZD4547, kinase–inhibitor, in situ imaging
Introduction
In situ cellular imaging has attracted significant attention in the drug-discovery field for its possible applications in mechanism studies, target identification, and cell-based drug screening.1–3 Although several promising studies have suggested using in situ cellular imaging as a tool,4,5 investigating the interaction between target proteins and drugs using this tool remains difficult due to a lack of resolution and throughput. Hence, a new probe must be introduced for in situ cellular imaging to become a major process in new drug development. Therefore, this new probe must have high resolution, high stability, and a strong imaging signal that does not decrease over time.
One strategy for developing an imaging probe that can investigate mechanisms and support drug discovery is to conjugate a fluorescent chemical with a novel drug that binds to the target protein in cells. Small-molecule fluorescent probes were introduced to study the interaction between a target protein and a drug.6,7 These probes provide a method for screening the activity of potential drug for target enzyme inhibition or for evaluating the drug efficacy associated with biological phenomena. However, no technique is available to image inhibitor–kinase binding in situ while tracking the inhibitor–kinase interaction in cells due to the lack of potent imaging probes that do not quench while tracking inhibitors. Therefore, a probe with a long-lasting, highly stable signal is needed to assess the distribution of potential drug movement in cells. Quantum dots (QDs) were selected as fluorescent probes to conjugate with potential drugs (ie, inhibitors in our study) because of their high fluorescence intensity,8 photostability,9 and facile surface chemistry.10
We proposed kinase–inhibitor–QD conjugates as probes for in situ cellular imaging. The receptor tyrosine kinases (RTKs), which are transmembrane proteins, were selected as the target proteins for the selected inhibitor since the interaction occurs at the cell membrane and thus can be easily detected.11 Recently, fibroblast growth factor receptor (FGFR) signaling in cancer has received attention for its ability to cause tumor angiogenesis12 by deregulating fibroblast growth factors (FGFs). This may lead to tumor cell proliferation, survival, and chemoresistance.13 The FGFR inhibitor AZD4547 is a frontrunner with its enhanced therapeutic results against a variety of FGFR-deregulated cancer models.14 Although many studies on the efficacy of AZD4547 in various cancer cells have been reported,15–17 the physical interaction between AZD4547 and FGFR has not been addressed.
In this study, we prepared the known FGFR inhibitor (AZD4547)-modified QD (QD-AZD4547) probe to image FGFRs in situ to investigate the interaction between FGFR and AZD4547 in cells. QDs were conjugated with AZD4547 using an amide-bond-forming reaction between the carboxylic acid groups of QDs and the amine-AZD4547 in the presence of ethylcarbodiimidehydrochloride (EDC)/sulfo-N-hydroxysulfosuccinimide (NHS). This simple conjugation method has been widely used to covalently conjugate biomolecules to the surface of nanoparticles.10,18,19 To study FGFR trafficking using the novel QD-AZD4547 probe, we constructed a turbo-green fluorescent protein (GFP)-FGFR3 transfected HeLa cell line. Although the kinase activities of AZD4547 against FGFRs were strong in FGFR1, FGFR2, and FGFR3 relatively,14 in the present study, we selected only FGFR3 to observe the specific colocalization pattern of FGFR3-AZD4547 expressed by QDs and turbo-GFP in HeLa cells. Our study confirmed that tracing the in situ interaction of kinase inhibitor RTK physical with QD-RTK conjugates is a tool for understanding how the RTK inhibitor physically interacts with RTK in situ. In addition, this tool showed the potential to be applied with QD-based quantitative analysis of RTK as well as in situ imaging.20
Materials and methods
Amine-linker synthesis of AZD4547 and NMR data
All chemical reagents and solvents were purchased from commercial suppliers and used without future purification. All reactions were performed under N2 atmosphere in flame-dried glassware. Reactions were monitored by thin layer chromatography with 0.25 mm E. Merck precoated silica gel plates (60 F254). Reaction progress was monitored by thin layer chromatography analysis using a UV lamp, ninhydrin, or p-anisaldehyde stain for detection purposes. All solvents were purified by standard techniques. Purification of reaction products was carried out by silica gel column chromatography using Kieselgel 60 Art. 9385 (230–400 mesh). The purity of all the compounds was over 95%, and mass spectra and purity of all the compounds were analyzed by using Waters liquid chromatography-mass spectrometry system (Waters 2998 Photodiode Array Detector, Waters 3100 Mass Detector, Waters SFO System Fluidics Organizer, Water 2545 Binary Gradient Module, Waters Reagent Manager, Waters 2767 Sample Manager) using SunFireTM C18 column (4.6×50 mm, 5 μm particle size): solvent gradient =60% (or 95%) A at 0 min, 1% A at 5 min. Solvent A =0.035% Trifluoroacetic acid in H2O; Solvent B =0.035% TFA in MeOH; flow rate 3.0 (or 2.5) mL/min. Nuclear magnetic resonance (NMR) spectra were obtained using a Bruker 400 MHz FT-NMR (400 MHz) spectrometer. Standard abbreviations are used for denoting the signal multiplicities.
AZD4547 (N-(5-(3,5-dimethoxyphenethyl)-1H-pyrazol-3-yl)-4-((3S,5R)-3,5-dimethylpiperazin-1-yl)benzamide, 66 mg, 0.142 mmol) and 2-(6-bromohexyl)isoindoline-1,3-dione (44 mg, 0.142 mmol) in dry dimethylformamide (DMF) (0.5 mL) were added to triethylamine (0.03 mL, 0.213 mmol) with potassium iodide (24 mg, 0.142 mmol) at room temperature. The reaction mixture was then stirred for 3 days at 40°C, quenched with H2O, and diluted with ethyl acetate (EtOAc). The organic layer was washed with H2O, dried over MgSO4, filtered, and concentrated under reduced pressure. The residue was purified by flash column chromatography on silica gel (CH2Cl2/MeOH =93:7) to afford N-(5-(3,5-dimethoxyphenethyl)-1H-pyrazol-3-yl)-4-((3S,5R)-4-(6-(1,3-dioxoisoindolin-2-yl)hexyl)-3,5-dimethylpiperazin-1-yl)benzamide (41 mg, 42%) as a colorless oil. This intermediate chemical was confirmed by 1H NMR. This compound was added to hydrazine hydrate (50%–60% solution, 0.02 mL) at room temperature and then stirred for 1 h at 80°C, concentrated under reduced pressure. The mixture was filtered and purified by reversed-phase preparative liquid chromatography-mass spectrometry using a gradient of 30%−100% MeOH/H2O with 0.035% TFA to give the desired 4-((3S,5R)-4-(6-aminohexyl)-3,5-dimethylpiperazin-1-yl)-N-(5-(3,5-dimethoxyphenethyl)-1H-pyrazol-3-yl)benzamide (amine-AZD4547) (20 mg, 82%) as a TFA salt and colorless oil. The structure was confirmed by 1H NMR, which indicated that N-(5-(3,5-dimethoxyphenethyl)-1H-pyrazol-3-yl)-4-((3S,5R)-4-(6-(1,3-dioxoisoindolin-2-yl)hexyl)-3,5-dimethylpiperazin-1-yl)benzamide (2) has 1H NMR (400 MHz, CDCl3) δ at 8.65 (bs, 1H), 7.85–7.82 (m, 2H), 7.77 (d, J=8.8 Hz, 2H), 7.72–7.69 (m, 2H), 7.85 (d, J=8.8 Hz, 2H), 6.59 (bs, 1H), 6.35–6.31 (m, 3H), 3.75 (s, 6H), 3.68 (t, J=7.2 Hz, 2H), 3.57 (d, J=11.2 Hz, 2H), 2.97–2.88 (m, 4H), 2.78–2.68 (m, 6H), 1.69 (pent, J=7.2 Hz, 2H), 1.41–1.34 (m, 2H), 1.31–1.26 (m, 2H), 1.17 (s, 3H), and 1.16 (s, 3H) while 4-((3S,5R)-4-(6-aminohexyl)-3,5-dimethylpiperazin-1-yl)-N-(5-(3,5-dimethoxyphenethyl)-1H-pyrazol-3-yl)benzamide (3) has 1H NMR (400 MHz, MeOD) δ at 8.36 7.91 (d, J=8.8 Hz, 2H), 7.14 (d, J=8.8 Hz, 2H), 6.48 (s, 1H), 6.39–6.38 (m, 2H), 6.35–6.34 (m, 1H), 4.10 (dd, J=2.0 Hz, 13.6 Hz, 2H), 3.89 (t, J=7.2 Hz, 2H), 3.75 (s, 6H), 3.54–3.49 (m, 2H), 3.03–2.89 (m, 6H), 2.86–2.79 (m, 2H), 1.73–1.68 (m, 2H), 1.66–1.62 (m, 2H), 1.44 (s, 3H), 1.42 (s, 3H), and 1.39–1.35 (m, 4H).
In vitro kinase assay
Kinase activities of human FGFR3 kinase domain (a.a. 436–806; Carna Biosciences, Kobe, Japan) were measured by using LANCE time-resolved fluorescence resonance energy transfer (TR-FRET) assays (PerkinElmer Inc., Waltham, MA, USA) with a Flexstation 3 microplate reader (Molecular Devices LLC, Sunnyvale, CA, USA). All kinase assays were performed at a final volume of 10 μL in white 384-well plates at room temperature, and the microplates were sealed with microplate sealing tapes (Corning Incorporated, Corning, NY, USA) during incubation. The FGFR3 kinase domain, ULight-poly GT (PerkinElmer Inc.) was used as a substrate, and ATP were prepared at 4× concentrations (4 nM, 400 nM, and 40 μM, respectively) in LANCE reaction buffer (1 mM ethylene glycol-bis(β-aminoethyl ether)-N,N,N′,N′-tetraacetic acid, 10 mM MgCl2, 2 mM Dithiothreitol, 0.01% Tween-20, 50 mM Tris–HCl, and pH 7.5). The FGFR3 kinase domain of 1 nM was incubated with 100 nM ULight-poly GT and different concentrations (100 μM, 30 μM, 10 μM, 3 μM, 1 μM, 300 nM, 100 nM, 30 nM, 10 nM, 3 nM, 1 nM, 300 pM, 100 pM, 30 pM, and 10 pM) of test compounds in the presence or absence of 10 μM ATP for 1 h. The EDTA solution and Eu-anti-phospho-Tyr (PT66) antibody (PerkinElmer Inc.) were prepared at 4× concentrations (40 mM and 8 nM, respectively) in the 1× LANCE detection buffer (PerkinElmer Inc.). The kinase reaction was terminated by adding 10 mM EDTA and further incubated for 5 min. Eu-anti-phospho-Tyr (PT66) antibody was added to the kinase reaction mixture at a final concentration of 2 nM for the detection of phosphorylation of substrate, and the mixture was incubated for 1 h. The fluorescence signal was measured using the Flexstation 3 microplate reader in TR-FRET mode (excitation wavelength of 320 nm, emission wavelength of 665 nm, a time delay of 50 μs between excitation and emission detection, and an integration time of 100 μs).
Conjugation of methoxy-QD and QD-AZD4547
Qdot® 605 ITK™ Carboxyl Quantum Dots (Thermo Fisher Scientific, Waltham, MA, USA) (10 pmol) were conjugated with MA(PEG)4 (methyl-PEG-amine) (Pierce, Rockford, IL, USA) (100 nmol) in 450 μL of 10 mM phosphate buffer containing N-(3-dimethylaminopropyl)-N′-EDC (Sigma-Aldrich Co., St Louis, MO, USA) (200 nmol) and sulfo-NHS (Pierce) (240 nmol) at room temperature for 3 h. Purification was performed by using a 100 K micron centrifugal filter (Millipore, Carrigtwohill, County Cork, Ireland) at 6,000 rpm for 5 min three times. Similarly, QDs (20 pmol) were conjugated with amine-AZD4547 (4 nmol) in 450 μL of 10 mM phosphate buffer using EDC (20 nmol) and sulfo-NHS (24 nmol). Mixed solution was allowed to incubate at room temperature for 3 h. The excess reagents were removed by a centrifugal filter three times. The concentrations of QD, methoxy-QD, QD-AZD4547, and filtered AZD4547 were determined by measuring the UV-vis absorption using Flexstation3 (Molecular Devices LLC).
Mobility shift assay was performed by gel electrophoresis. Each sample was loaded into 1.5% agarose gel in 0.5× Tris-borate-EDTA buffer and run at 50 V for 90 min. The gel was observed by LED transilluminator, and the gel was stained by colloidal blue staining solution (Thermo Fisher Scientific). Particle size distribution and zeta potential measurement were carried out by Nano-ZS (Malvern Instruments, Malvern, UK) at room temperature.
Turbo-GFP FGFR3 transfected HeLa cell preparation
Human cervix adenocarcinoma cell lines (HeLa, American Type Culture Collection (ATCC), Manassas, VA, USA) were cultured in Dulbecco’s Modified Eagle’s Medium (DMEM) (Hyclone, South Logan, UT, USA) supplemented with 10% fetal bovine serum (FBS) (Hyclone) and 1% penicillin/streptomycin (P/S) (Thermo Fisher Scientific). Human bladder carcinoma cell lines (RT112, ATCC) were incubated using RPMI-1640 medium (Hyclone), containing 10% FBS, and supplemented with 1% P/S.
Transfection was performed by using Turbo GFP tagged FGFR3 plasmid DNA (Origene, Rockvile, MD, USA) and Lipofectamine 2000 reagent (Thermo Fisher Scientific). HeLa cells were plated in an 8-well chamber slide at 2×10⁴ cells/well. After 18 h of incubation, 3.75 μg plasmid (plasmid [μg] : lipofectamine 2000 [μL] =1:1) were treated into the well and incubated for 4 h, and then the cells were incubated for 24 h with DMEM containing 10% FBS. The cells were transferred to the 6-well plates for further culture with DMEM containing 10 μg/1 mL G418 (Thermo Fisher Scientific), 10% FBS, and 1% P/S. When the amount of resistant cell clones was observed, they were picked up with 0.25% trypsin and then transferred to a new culture dish using an aseptic pipette for further culture. After 2 weeks of selection, transfected HeLa stable cell lines were maintained with DMEM containing 2 μg/mL G418, 10% FBS, and 1% P/S. This new cell line was named HeLa-FGFR3.
Immunoblot analysis and MTT assay
HeLa, HeLa-FGFR3, and RT112 cells were incubated at 37°C for 24 h and lysed in NP40 cell lysis buffer (Thermo Fisher Scientific) containing protease inhibitor cocktail (Hoffman-La Roche Ltd., Basel, Switzerland). Proteins in the lysates were subjected to SDS-PAGE. Proteins were detected using a rabbit monoclonal anti-FGFR3 antibody (Abcam, Cambridge, MA, USA), a mouse monoclonal anti-turbo GFP antibody (Origene), and a mouse monoclonal anti-β actin antibody (Santa Cruz Biotechnology Inc., Dallas, TX, USA).
MTT (3-[4,5-dimethylthiazol-2-yl]-2,5-diphenyltetrazolium bromide) (Sigma-Aldrich Co.) assay was performed with HeLa, HeLa-FGFR3, and RT112 cells after treating AZD4547 and amine-AZD4547. Briefly, cells were seeded in 96-well plates and incubated for 24 h before adding the drugs. After 48 h of incubation with AZD4547 and amine-AZD4547, MTT solution (1 mg/mL in cell complete medium) was treated into each well and incubated for 1 h and then 100 μL DMSO was added into each well and incubated for 20 min at room temperature. The absorbance was measured using Flexstation3 (Molecular Devices LLC) at 560 nm wavelength. Origin software was used to analyze the growth inhibition rate from three independent experimental results.
Fluorescent imaging and statistical data analysis
HeLa-FGFR3 cells were seeded in an 8-well chamber slide and incubated for 24 h before adding methoxy-QD and QD-AZD4547 conjugates. 10 nM of methoxy-QD and QD-AZD4547 conjugates in cell complete medium were added to each well and incubated for 2 h, and then the cells were fixed with 4% formaldehyde. The cells were imaged through Ti fluorescence microscope (Nikon Corporation, Tokyo, Japan) with FITC, and Qdot 605 filter sets. Fluorescence images were obtained by NIS-element microscope imaging software. Each image was analyzed by ImageJ program with Jacop plugin to get Pearson’s coefficient of FITC-QD605 colocalization.
FGF treatment experiment and QD conjugates tracking
HeLa-FGFR3 cells were seeded in an 8-well chamber slide and incubated for 24 h, and then 10 nM QD-AZD4547, methoxy-QD conjugates, 2 μM AZD4547, and control cell medium were added into each well and incubated for 30 min. After incubation, cells were washed and incubated for 30 min with cell medium. Later, 50 ng/mL Fibroblast growth factor 1 (FGF1) and 20 μg/mL heparin in cell medium were treated into cells and incubated for 1 h and fixed with 4% formaldehyde.
For time tracking of methoxy-QD and QD-AZD4547 in HeLa-FGFR3 cells, cells were incubated with 5 nM methoxy-QD and QD-AZD4547 for 30 min and then washed and incubated for different times and fixed (using 4% formaldehyde). The nuclei were stained by 4′,6-diamidine-2′-phenylindole dihydrochloride (DAPI), and the Golgi was immunostained by mouse monoclonal anti-giantin antibody (Abcam) and Alexa Fluor 594 goat anti-mouse (Thermo Fisher Scientific). Fluorescence images were obtained through Ti fluorescence microscope with DAPI, FITC, TRITC, and Qdot 605 filter sets.
Results and discussion
Amine-AZD4547 synthesis
To conjugate AZD4547 with carboxyl QDs, we introduced an amine moiety to the AZD4547 (1) compound as shown in Figure 1. We confirmed amine-AZD4547 with NMR data which is shown in the “Materials and methods” section.
 | Figure 1 Schematic representation of synthesis of amine-linked AZD4547. |
To determine if the amine-linker of amine-AZD4547 (3) exhibits a hindrance effect, a kinase assay with AZD4547 (1) and amine-AZD4547 (3) was performed (Table 1; Figure S1). The enzyme IC50 is 7.55 nM for AZD4547 (1) and 100.11 nM for amine-AZD4547 (3), demonstrating that the amine-linker interferes with FGFR3-AZD4547 binding. However, the cellular growth inhibition and enzyme effective concentration of amine-AZD4547 (3) treatment are not significantly altered even if the amine-linker interferes slightly with binding (Figure 2). This is similar to the previous reported study which showed drug-conjugated antibody has no effect of changing cell inhibition rate although cell growth inhibition with treating drug-linker was decreased rather than pure drug treatment.21 Therefore, we assumed that the amine-AZD4547 (3) could be an appropriate linker-modified AZD4547 for the conjugation to the QDs. The following observations confirm that the amine-AZD4547 (3) can be used to observe the interaction between FGFR3 and the QD-AZD4547 probe.
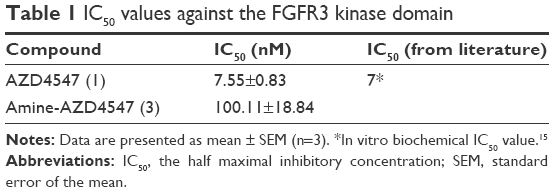 | Table 1 IC50 values against the FGFR3 kinase domain |
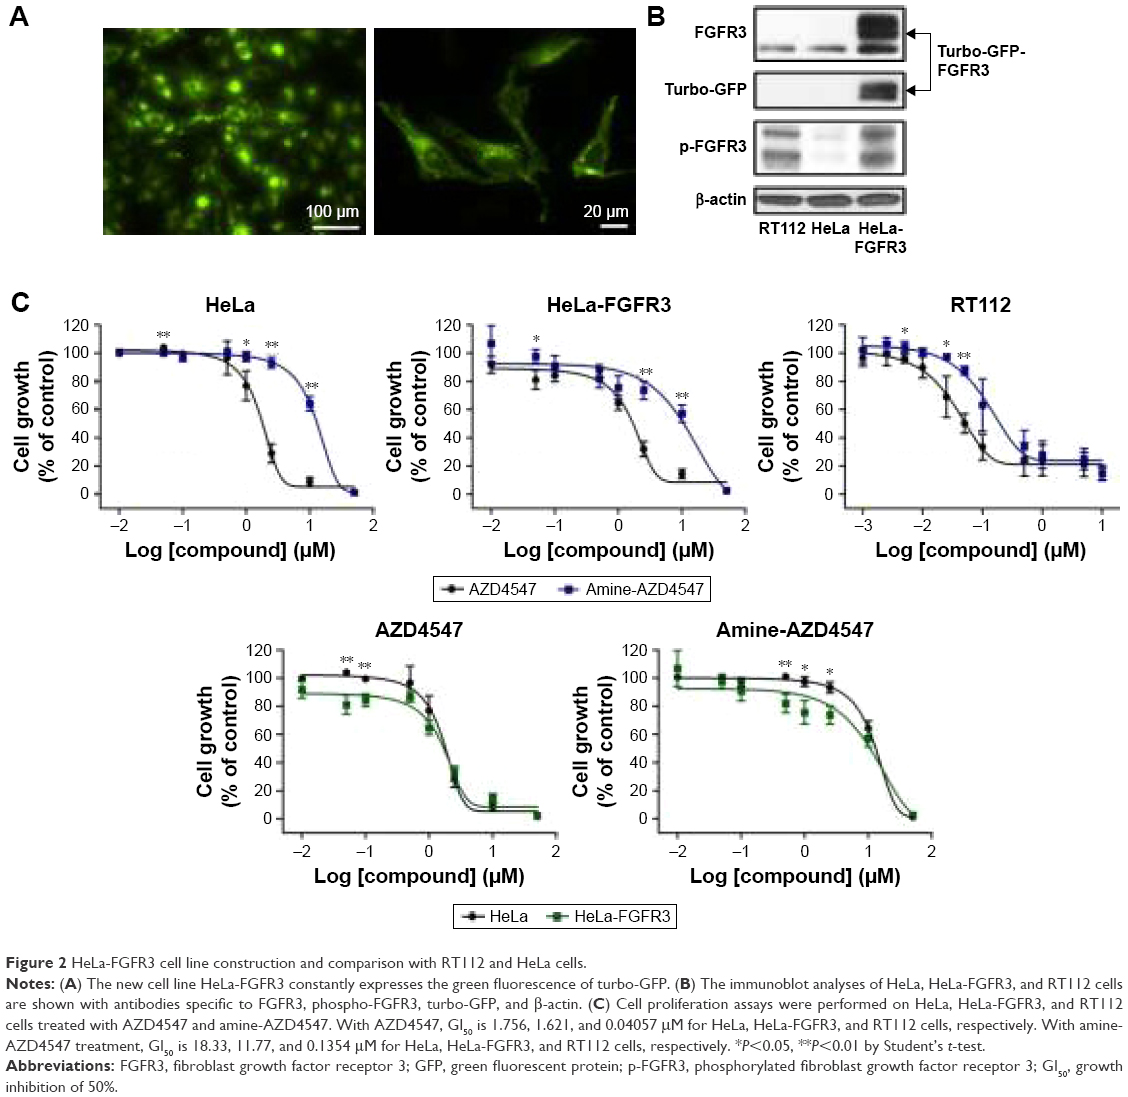 | Figure 2 HeLa-FGFR3 cell line construction and comparison with RT112 and HeLa cells. |
QD-AZD4547 and methoxy-QD fabrication
Two probes for imaging FGFR3-AZD4547 in cells, QD-AZD4547 and methoxy-QD, were fabricated using EDC chemistry.22,23 Methoxy-QD was selected as the control because it reduces non-specific binding in the physiological condition.24,25 The conjugation steps are shown in Figure 3. Carboxyl QDs which are made from nanocrystals of the semiconductor materials (CdSe), which are shelled with an additional semiconductor layer (ZnS), reacted with the amine moiety of amine-AZD4547 (3) or methoxy-PEG after creating an activating group using EDC and sulfo-NHS. The optimal ratio of methoxy-PEG and amine-AZD4547 (3) for conjugating QDs was determined through gel electrophoresis (data not shown). Based on the highest mobility from gel electrophoresis, we chose a 1:10,000 ratio of methoxy-PEG for the methoxy-QD probe and a 1:200 ratio of amine-AZD4547 (3) for the QD-AZD4547 probe.
 | Figure 3 Schematic representation of conjugation of QD-AZD4547 probe and methoxy-QD. |
The particle size distribution, zeta potential measurement, and gel electrophoresis were used to determine whether the conjugation of methoxy-QD and QD-AZD4547 was successful (Table 2; Figure 4). QD-AZD4547 conjugates and methoxy-QD are larger than the original QDs. The zeta potential values of QD-AZD4547 and methoxy-QD showed that their net charges are more positive than those of QDs due to each additional charge from the methoxy group or AZD4547. The gel electrophoresis data confirmed that the QD, methoxy-QD, and QD-AZD4547 probes have different motilities, and these motilities were correlated to the zeta potential values. The number of AZD4547 conjugated on QD was determined indirectly by measuring absorbance of AZD4547 on filtered solution after QD conjugation. From three independent experiments, 86±5 molecules of AZD4547 per QD were successfully bound on the surface. The concentration of QDs, methoxy-QD and QD-AZD4547, was determined by UV absorption. The fluorescence intensity of starting QDs, methoxy-QD and QD-AZD4547, was measured relatively at the same concentration (Figure S2), and there is no significant quenching effect by conjugating methoxy or AZD4547 on the QDs. Although a recent study showed QD could be quenched after kinase–inhibitor conjugation with increasing concentration of kinase inhibitors.26 AZD4547 and methoxy in methoxy-QD and QD-AZD4547 might be of lower concentration that the reported result.
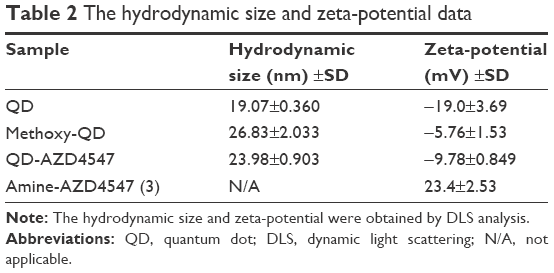 | Table 2 The hydrodynamic size and zeta-potential data |
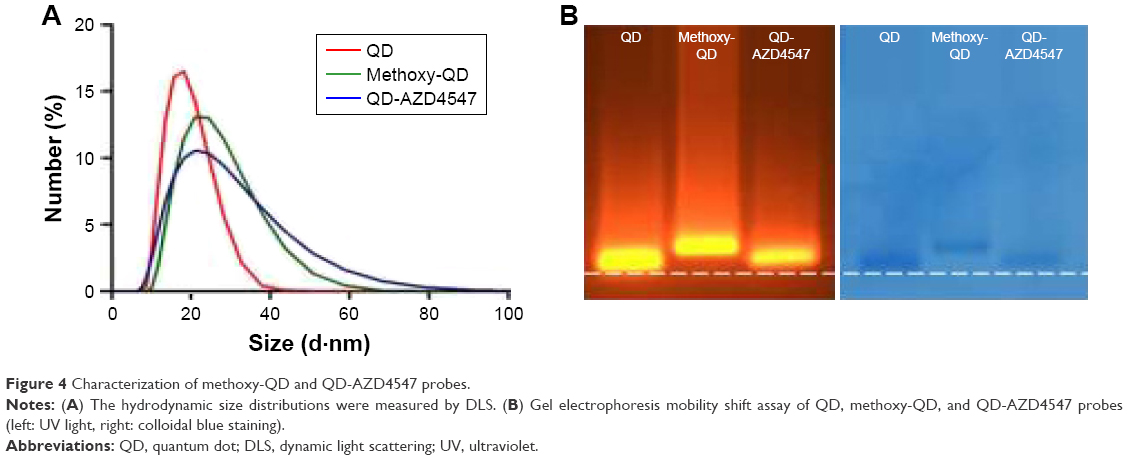 | Figure 4 Characterization of methoxy-QD and QD-AZD4547 probes. |
Cell proliferation assay of HeLa and HeLa-FGFR3 by treating with AZD4547 and amine-AZD4547
We constructed a new cell line to observe the in situ binding of AZD4547 to FGFR3 in cells. Turbo GFP-FGFR3 plasmid-transfected HeLa cells were cultured with G418 which expresses the stability of genes. In addition, green fluorescent HeLa cells were selected using fluorescence microscopy and were named HeLa-FGFR3. The HeLa-FGFR3 cells constantly express green fluorescence and exhibit robust morphology, as shown in Figure 2A. To measure the expression level of FGFR3, immunoblotting was performed, which showed that HeLa-FGFR3 cells have over-expressed FGFR3 (~90 kDa) and turbo-GFP-FGFR3s (~110–130 kDa) (Figure 2B).
Before observing the interaction between the probes and FGFR3s by cellular imaging, the HeLa and HeLa-FGFR3 cell proliferation rates were measured in the presence of the original AZD4547 (1) or synthesized amine-AZD4547 (3). Interestingly, HeLa-FGFR3 cells are slightly more sensitive to both AZD4547 (1) and amine-AZD4547 (3) than HeLa cells (growth inhibition of 50% [GI50]: 1.756, 1.621 μM for HeLa, and HeLa-FGFR3 with AZD4547 treatment, GI50: 18.33, 11.77 μM in HeLa, HeLa-FGFR3 with amine-AZD4547 treatment) (Figure 2C). The hindrance effect of amine-AZD4547 (3) on HeLa and HeLa-FGFR3 cells is in accordance with the MTT assay results for the RT112 cell line with overexpressed FGFR3. This confirmed that FGFR3 would interact with amine-AZD4547 (3) via the same interaction mechanism between FGFR3 and AZD4547.
Imaging FGFR3 movement under FGFR3-FGF binding
To assess whether the fabricated QD-AZD4547 conjugates actually work and bind to FGFR3, HeLa-FGFR3 cells were treated with equal molar amount of methoxy-QD and QD-AZD4547 (Figure S3). In the case of the QD-AZD4547 probe, green fluorescence indicating FGFR3 and red fluorescence indicating QD probes overlap and form yellowish fluorescence by colocalization, in contrast to methoxy-QD in HeLa-FGFR3 cells. QD-AZD4547 binding to FGFR3 based on QD-GFP colocalization was statistically analyzed using Pearson’s coefficient (Figure S4). Hundreds of cells (n=100) were examined, and the results of the methoxy-QD and QD-AZD4547 probe treatments were not different from each other, despite the differences in the images.
We performed an FGF treatment experiment to determine if the QD-AZD4547 probe actually binds to FGFRs in cells. FGF1 was used for this ligand–receptor binding experiment because FGF1 binds well to FGFR327 and the ligand–receptor complexes can be internalized.28 The control HeLa-FGFR3 cells without any probe incubation and the HeLa-FGFR3 cells with methoxy-QD probe incubation in Figure 5 demonstrate the endocytic movement of FGFR3 after incubating with FGF1 for 1 h. HeLa-FGFR3 cells pretreated with pure AZD4547 and QD-AZD4547 probes did not show an endocytic movement of FGFR3. The concentration of treated pure AZD4547 was 2 μM, which is much higher than the amount of AZD4547 in a 10 nM QD-AZD4547 conjugate dispersion because the estimated concentration of AZD4547 is 860 nM in 10 nM QD-AZD4547 according to the number of AZD4547 per QD. Although the final concentration of AZD4547 on QD-AZD4547 is lower than that of pure AZD4547 treatment, these results indicate that QD-AZD4547 binds to FGFR3 and inhibits FGFR3 phosphorylation such that there is no endocytosis. Hence, the QD-AZD4547 probe strictly binds to FGFR3s in cells such that the strong bond cannot be altered by ligand–receptor binding.
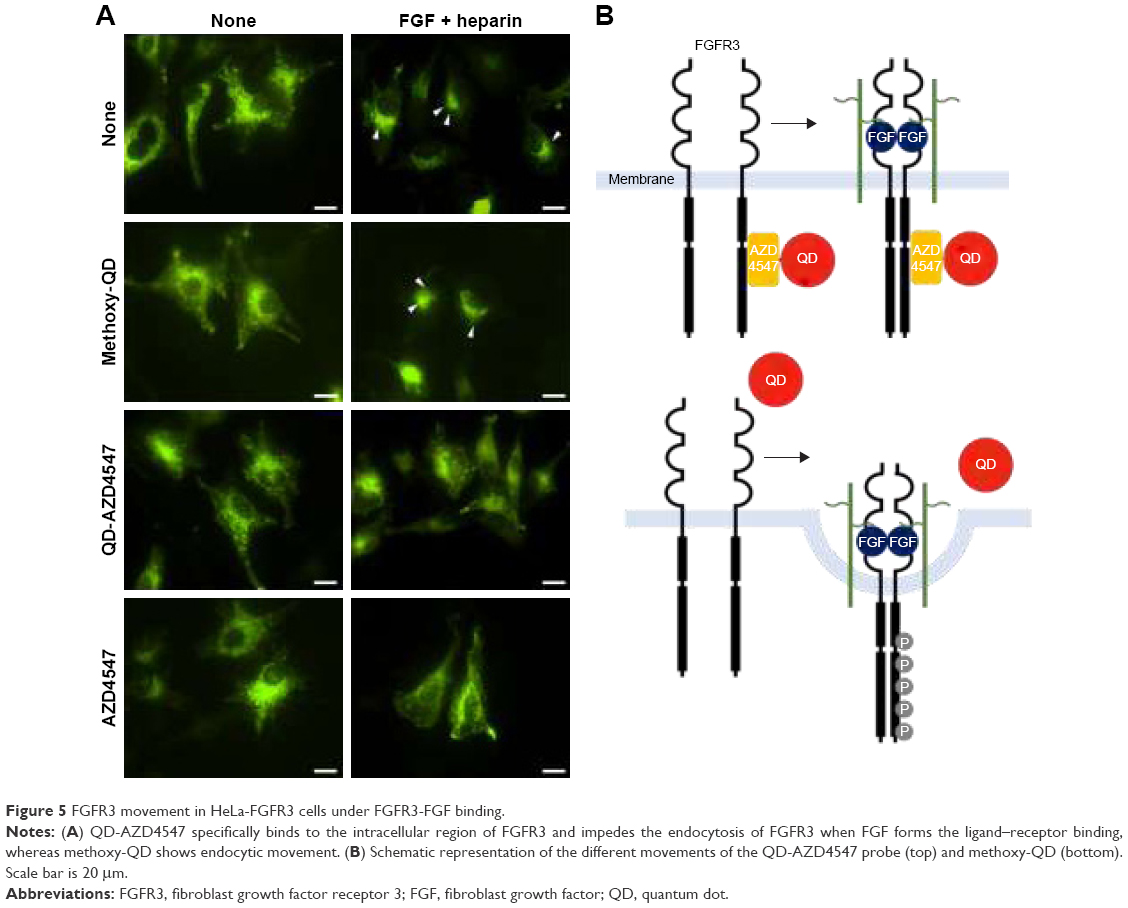 | Figure 5 FGFR3 movement in HeLa-FGFR3 cells under FGFR3-FGF binding. |
In most mammalian cells, receptor-mediated endocytosis is an endocytotic mechanism wherein cell–surface receptors bind and internalize. In the case of FGFR3-FGF binding, two FGF ligands and two heparin sulfate chains bind to two FGFR3s.29 The complex formed by dimerization causes transphosphorylation by the kinases on several tyrosine residues in the intracellular part of the FGFR3s, activating downstream signaling cascades.11 After activation, the complex is internalized by endocytosis30 and transported to lysosomes for degradation.29 However, AZD4547 may retard this process when it binds to FGFRs, even in the presence of FGFs. This is due to the early stage of AZD4547 binding to the ATP-competitive site of FGFR3, where AZD4547 impedes FGFR3 phosphorylation and internalization even if the FGF stimulus exists. The tyrosine phosphorylation of RTKs enables some endocytic adaptor molecule recruitment and causes RTK internalization.31 Furthermore, this hindrance had superior effectiveness when QD-AZD4547 probes were used rather than AZD4547. The absolute concentration of AZD4547 on the QD-AZD4547 probes and free AZD4547 are not comparable due to the difficulty in measuring conjugated compounds on the QD surface. However, the additional cellular uptake of QDs32 may facilitate AZD4547 binding to FGFR3 and induce FGFR3s internalization by endocytosis even if not all of the AZD4547 used in the conjugation reaction conjugated with QDs. We therefore demonstrated different FGFR internalization processes of methoxy-QD and QD-AZD4547 probes and further investigated FGFR–FGF binding and internalization.
Tracking of methoxy-QD and QD-AZD4547 probe in situ imaging in HeLa-FGFR3 cells
We confirmed the successful conjugation of amine-AZD4547 to QDs and the binding of the QD-AZD4547 probe to FGFR3 in cells. Even though the colocalization analysis of QD-GFP in HeLa-FGFR3 cells did not show a significant difference between methoxy-QD and QD-AZD4547 after a 2 h treatment, the initial binding and endocytosis pathways of each probe are dissimilar. By tracking the QD movement over time starting with the initial binding, the position of each probe can be imaged in situ. HeLa-FGFR3 cells with methoxy-QD and QD-AZD4547 were incubated for 6 h (Figure 6). Each of the QD probes was incubated for 30 min before being washed and incubated at different times. We observed the movement of methoxy-QD, and it either remained at the cell membrane or detached and scattered from the cell membrane (Figure 6A). Meanwhile, QD-AZD4547 was internalized and gathered near the cell nuclei as time passed (Figure 6B). Methoxy-QD initially binds to the cell membrane, but it detaches over time since it has no specific or strong binding. In contrast, the QD-AZD4547 probe specifically binds to FGFR3 and moves along the FGFR3 tracks for a long time before finally reaching the cell nuclei.
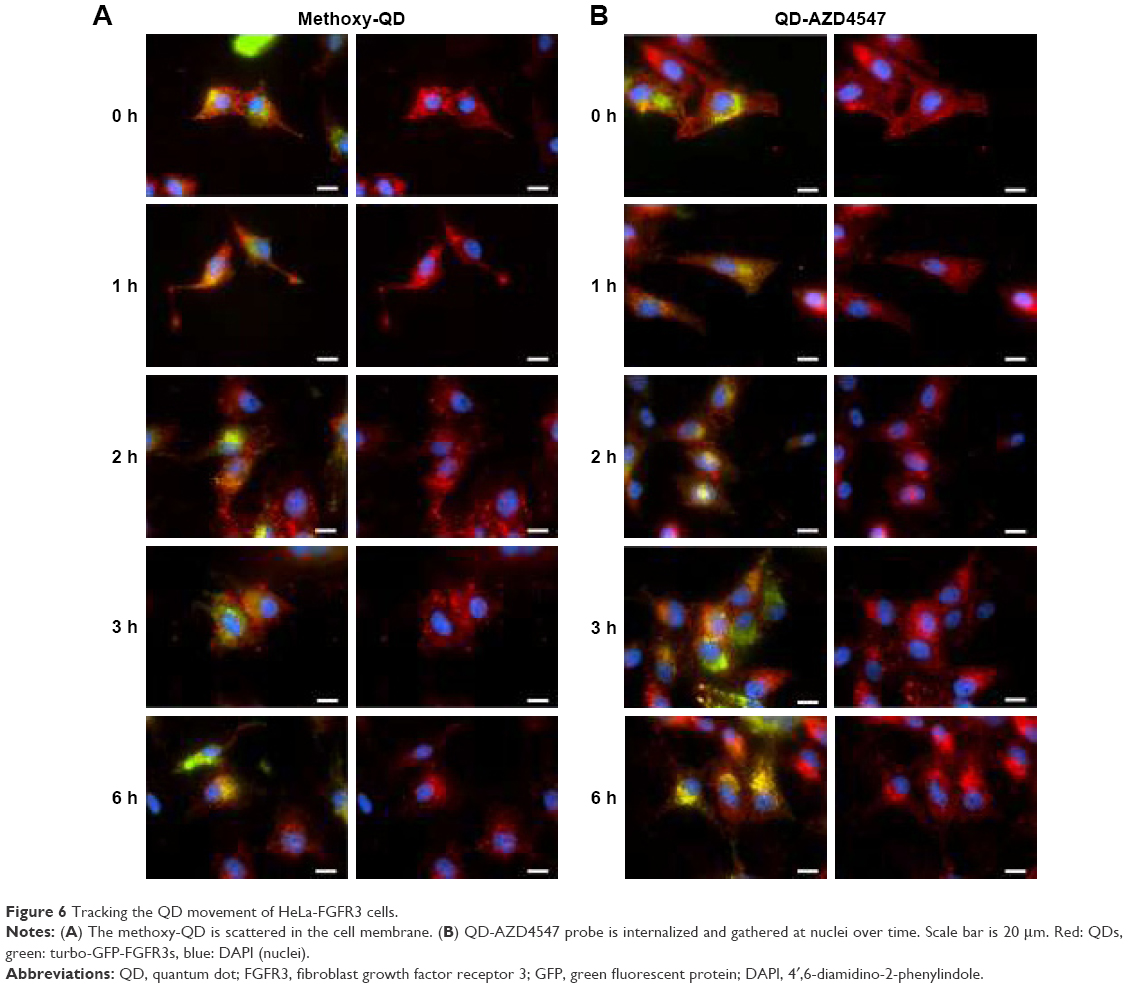 | Figure 6 Tracking the QD movement of HeLa-FGFR3 cells. |
Each track of QDs in HeLa-FGFR3 cells with the treatment of methoxy-QD or QD-AZD4547 probes was observed again with Golgi staining (Figure 7). After 6 h of incubation, QD-AZD4547 probes were localized in Golgi region, whereas methoxy-QD probes did not remain in the cells. These results indicate that the QD-AZD4547 probes can be used to study the FGFR3–AZD4547 interaction to evaluate FGFR3 trafficking in situ because QD-AZD4547 probes are expected to strongly bind to FGFRs.
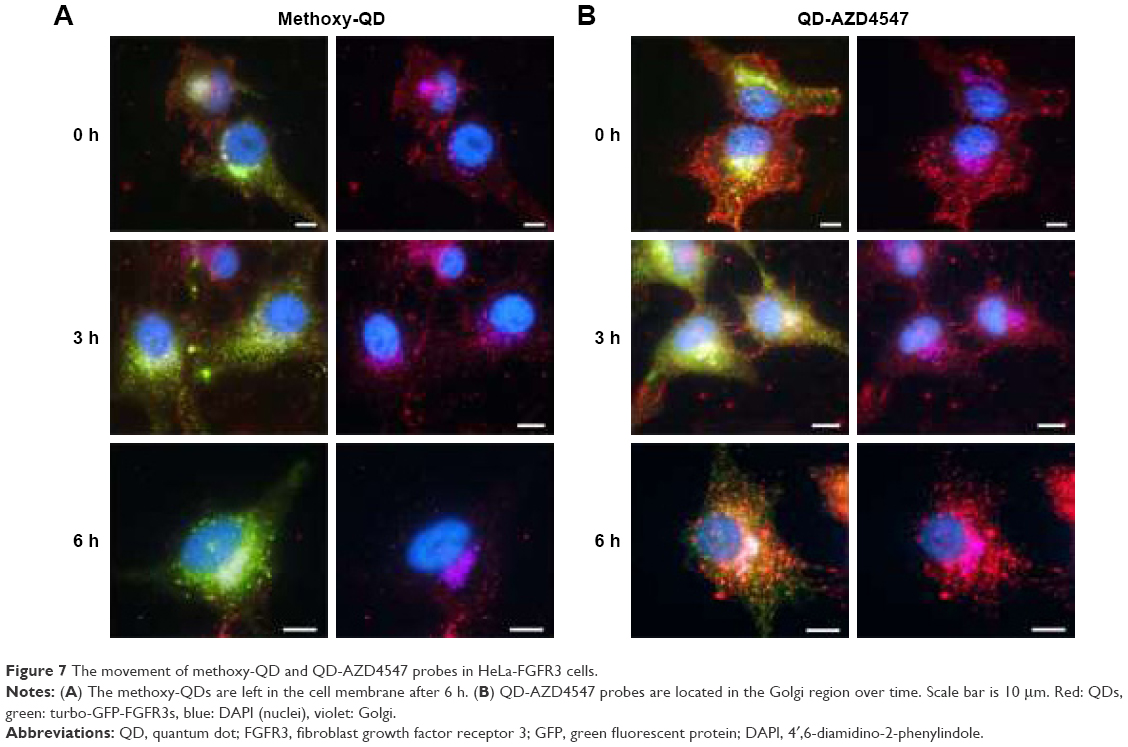 | Figure 7 The movement of methoxy-QD and QD-AZD4547 probes in HeLa-FGFR3 cells. |
Conclusion
Studying the mechanism of the inhibitor–kinase interaction through in situ cellular imaging includes the initial binding of the inhibitor–kinase and the position change of the kinase through an external factor stimulation. The QD-AZD4547 probe was first conjugated in our work to investigate the inhibitor–kinase interaction because FGFRs, a type of RTKs, are easily detected by imaging probes as they are located in the cell transmembrane. Moreover, the probe may detect FGFRs movement through in situ cellular imaging after the RTK selectively interacts with the RTK inhibitors. The detection of the inhibitor–kinase interaction and FGFRs movement has been a challenge, although it can play an important role in determining the kinase–inhibitor mechanism working in cells. In this regard, the QD-AZD4547 and methoxy-QD probe incubation in HeLa-FGFR3 cells was a step forward in understanding the inhibitor–kinase mechanism. With the new HeLa-FGFR3 cell line, and QD-AZD4547 probes, a variety of studies related to kinase–inhibitor mechanism may now be possible. Furthermore, the QD-RTK inhibitor could potentially be utilized for cell-based screening systems to identify novel RTK inhibitors.
Acknowledgments
This work supported by the KIST Institutional Program (Project No 2E26090), the KU-KIST Graduate School of Converging Science and Technology Program, and a grant (D33400) of Korea Basic Science Institute. We greatly thank Heeyoung Ju for assisting in constructing the new cell line.
Disclosure
The authors report no conflicts of interest in this work.
References
Isherwood B, Timpson P, McGhee EJ, et al. Live cell in vitro and in vivo imaging applications: accelerating drug discovery. Pharmaceutics. 2011;3(2):141–170. | ||
Lang P, Yeow K, Nichols A, Scheer A. Cellular imaging in drug discovery. Nat Rev Drug Discov. 2006;5(4):343–356. | ||
Taylor DL, Woo ES, Giuliano KA. Real-time molecular and cellular analysis: the new frontier of drug discovery. Curr Opin Biotechnol. 2001;12(1):75–81. | ||
Li L, Wijaya H, Samanta S, Lam Y, Yao SQ. In situ imaging and proteome profiling indicate andrographolide is a highly promiscuous compound. Sci Rep. 2015;5:11522. | ||
Su Y, Pan S, Li Z, et al. Multiplex imaging and cellular target identification of kinase inhibitors via an affinity-based proteome profiling approach. Sci Rep. 2015;5:7724. | ||
Tietz O, Kaur J, Bhardwaj A, Wuest FR. Pyrimidine-based fluorescent COX-2 inhibitors: synthesis and biological evaluation. Org Biomol Chem. 2016;14(30):7250–7257. | ||
Shi H, Kwok RT, Liu J, Xing B, Tang BZ, Liu B. Real-time monitoring of cell apoptosis and drug screening using fluorescent light-up probe with aggregation-induced emission characteristics. J Am Chem Soc. 2012;134(43):17972–17981. | ||
Resch-Genger U, Grabolle M, Cavaliere-Jaricot S, Nitschke R, Nann T. Quantum dots versus organic dyes as fluorescent labels. Nat Methods. 2008;5(9):763–775. | ||
Jaiswal JK, Mattoussi H, Mauro JM, Simon SM. Long-term multiple color imaging of live cells using quantum dot bioconjugates. Nat Biotechnol. 2003;21(1):47–51. | ||
Medintz IL, Uyeda HT, Goldman ER, Mattoussi H. Quantum dot bioconjugates for imaging, labelling and sensing. Nat Mater. 2005;4(6):435–446. | ||
Lemmon MA, Schlessinger J. Cell signaling by receptor tyrosine kinases. Cell. 2010;141(7):1117–1134. | ||
Presta M, Dell’Era P, Mitola S, Moroni E, Ronca R, Rusnati M. Fibroblast growth factor/fibroblast growth factor receptor system in angiogenesis. Cytokine Growth Factor Rev. 2005;16(2):159–178. | ||
Fons P, Gueguen-Dorbes G, Herault JP, et al. Tumor vasculature is regulated by FGF/FGFR signaling-mediated angiogenesis and bone marrow-derived cell recruitment: this mechanism is inhibited by SSR128129E, the first allosteric antagonist of FGFRs. J Cell Physiol. 2015;230(1):43–51. | ||
Gavine PR, Mooney L, Kilgour E, et al. AZD4547: an orally bioavailable, potent, and selective inhibitor of the fibroblast growth factor receptor tyrosine kinase family. Cancer Res. 2012;72(8):2045–2056. | ||
Kwak Y, Cho H, Hur W, Sim T. Antitumor effects and mechanisms of AZD4547 on FGFR2-deregulated endometrial cancer cells. Mol Cancer Ther. 2015;14(10):2292–2302. | ||
Xie L, Su X, Zhang L, et al. FGFR2 gene amplification in gastric cancer predicts sensitivity to the selective FGFR inhibitor AZD4547. Clin Cancer Res. 2013;19(9):2572–2583. | ||
Zhang J, Zhang L, Su X, et al. Translating the therapeutic potential of AZD4547 in FGFR1-amplified non–small cell lung cancer through the use of patient-derived tumor xenograft models. Clin Cancer Res. 2012;18(24):6658–6667. | ||
Bartczak D, Kanaras AG. Preparation of peptide-functionalized gold nanoparticles using one pot EDC/sulfo-NHS coupling. Langmuir. 2011;27(16):10119–10123. | ||
Sperling RA, Parak WJ. Surface modification, functionalization and bioconjugation of colloidal inorganic nanoparticles. Philos Trans A Math Phys Eng Sci. 2010;368(1915):1333–1383. | ||
Zheng HM, Chen C, Wu XH, et al. Quantum dot-based in situ simultaneous molecular imaging and quantitative analysis of EGFR and collagen IV and identification of their prognostic value in triple-negative breast cancer. Tumor Biol. 2016;37(2):2509–2518. | ||
Albers AE, Garofalo AW, Drake PM, et al. Exploring the effects of linker composition on site-specifically modified antibody-drug conjugates. Eur J Med Chem. 2014;88:3–9. | ||
Xing Y, Chaudry Q, Shen C, et al. Bioconjugated quantum dots for multiplexed and quantitative immunohistochemistry. Nat Protoc. 2007;2(5):1152–1165. | ||
He S, Huang BH, Tan J, et al. One-to-one quantum dot-labeled single long DNA probes. Biomaterials. 2011;32(23):5471–5477. | ||
Ballou B, Lagerholm BC, Ernst LA, Bruchez MP, Waggoner AS. Noninvasive imaging of quantum dots in mice. Bioconjug Chem. 2004;15(1):79–86. | ||
Bentzen EL, Tomlinson ID, Mason J, et al. Surface modification to reduce nonspecific binding of quantum dots in live cell assays. Bioconjug Chem. 2005;16(6):1488–1494. | ||
Liao S, Huang Y, Zuo J, Yan Z. The interaction of CuInS2/ZnS/TGA quantum dots with tyrosine kinase inhibitor and its application. Luminescence. 2015;30(3):362–370. | ||
Ornitz DM, Xu J, Colvin JS, et al. Receptor specificity of the fibroblast growth factor family. J Biol Chem. 1996;271(25):15292–15297. | ||
Sorokin A, Mohammadi M, Huang JT, Schlessinger J. Internalization of fibroblast growth-factor receptor is inhibited by a point mutation at tyrosine-766. J Biol Chem. 1994;269(25):17056–17061. | ||
Wesche J, Haglund K, Haugsten EM. Fibroblast growth factors and their receptors in cancer. Biochem J. 2011;437(2):199–213. | ||
Haugsten EM, Zakrzewska M, Brech A, et al. Clathrin- and dynamin-independent endocytosis of FGFR3-implications for signalling. PLoS One. 2011;6(7):e21708. | ||
Abella JV, Park M. Breakdown of endocytosis in the oncogenic activation of receptor tyrosine kinases. Am J Physiol Endocrinol Metab. 2009;296(5):E973–E984. | ||
Zhang LW, Monteiro-Riviere NA. Mechanisms of quantum dot nanoparticle cellular uptake. Toxicol Sci. 2009;110(1):138–155. |
Supplementary materials
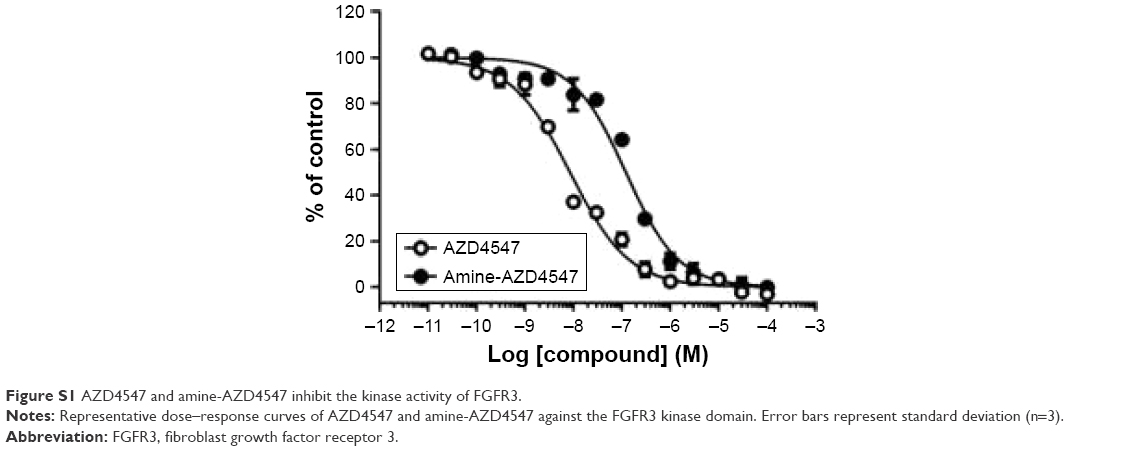 | Figure S1 AZD4547 and amine-AZD4547 inhibit the kinase activity of FGFR3. |
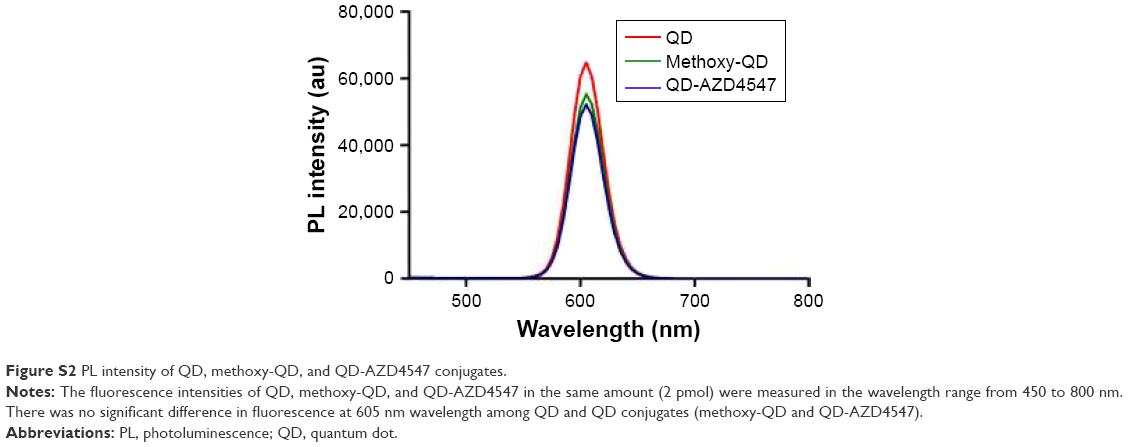 | Figure S2 PL intensity of QD, methoxy-QD, and QD-AZD4547 conjugates. |
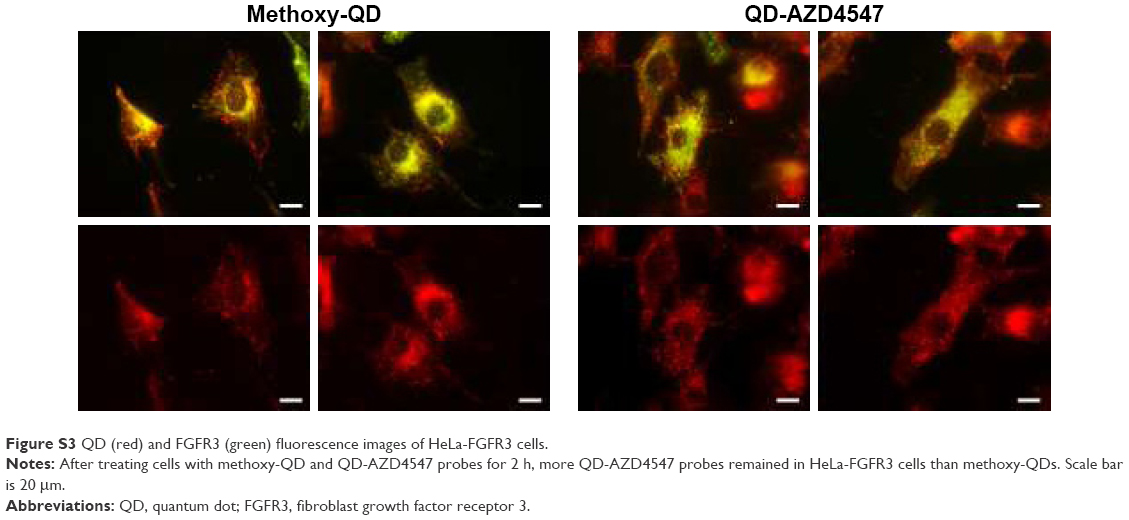 | Figure S3 QD (red) and FGFR3 (green) fluorescence images of HeLa-FGFR3 cells. |
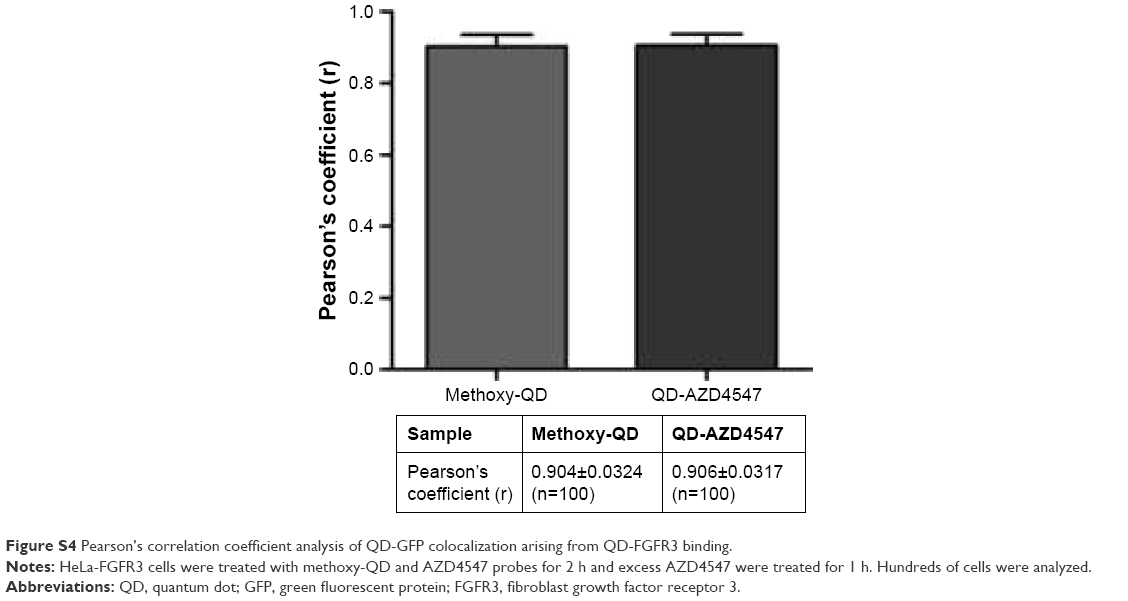 | Figure S4 Pearson’s correlation coefficient analysis of QD-GFP colocalization arising from QD-FGFR3 binding. |
 © 2017 The Author(s). This work is published and licensed by Dove Medical Press Limited. The
full terms of this license are available at https://www.dovepress.com/terms
and incorporate the Creative Commons Attribution
- Non Commercial (unported, 3.0) License.
By accessing the work you hereby accept the Terms. Non-commercial uses of the work are permitted
without any further permission from Dove Medical Press Limited, provided the work is properly
attributed. For permission for commercial use of this work, please see paragraphs 4.2 and 5 of our Terms.
© 2017 The Author(s). This work is published and licensed by Dove Medical Press Limited. The
full terms of this license are available at https://www.dovepress.com/terms
and incorporate the Creative Commons Attribution
- Non Commercial (unported, 3.0) License.
By accessing the work you hereby accept the Terms. Non-commercial uses of the work are permitted
without any further permission from Dove Medical Press Limited, provided the work is properly
attributed. For permission for commercial use of this work, please see paragraphs 4.2 and 5 of our Terms.