Back to Journals » International Journal of Chronic Obstructive Pulmonary Disease » Volume 12
Improved spirometric detection of small airway narrowing: concavity in the expiratory flow–volume curve in people aged over 40 years
Authors Johns DP ![]() , Das A, Toelle BG
, Das A, Toelle BG ![]() , Abramson MJ
, Abramson MJ ![]() , Marks GB
, Marks GB ![]() , Wood-Baker R, Walters EH
, Wood-Baker R, Walters EH
Received 29 August 2017
Accepted for publication 15 November 2017
Published 13 December 2017 Volume 2017:12 Pages 3567—3577
DOI https://doi.org/10.2147/COPD.S150280
Checked for plagiarism Yes
Review by Single anonymous peer review
Peer reviewer comments 2
Editor who approved publication: Prof. Dr. Richard Russell
David P Johns,1 Aruneema Das,1 Brett G Toelle,2,3 Michael J Abramson,4 Guy B Marks,2,5 Richard Wood-Baker,1 E Haydn Walters1,6
1Faculty of Health, NHMRC Centre of Research Excellence for Chronic Respiratory Disease, School of Medicine, University of Tasmania, Hobart, Tasmania, 2Woolcock Emphysema Centre, Woolcock Institute of Medical Research, University of Sydney, 3Sydney Local Health District, Sydney, New South Wales, 4Department of Epidemiology and Preventive Medicine, Monash University, Melbourne, Victoria, 5South Western Sydney Clinical School, University of New South Wales, Sydney, New South Wales, 6Allergy and Lung Health Unit, Centre for Epidemiology and Biostatistics, School of Population and Global Health, University of Melbourne, Melbourne, Victoria, Australia
Background and objective: We have explored whether assessing the degree of concavity in the descending limb of the maximum expiratory flow–volume curve enhanced spirometric detection of early small airway disease.
Methods: We used spirometry records from 890 individuals aged ≥40 years (mean 59 years), recruited for the Burden of Obstructive Lung Disease Australia study. Central and peripheral concavity indices were developed from forced expired flows at 50% and 75% of the forced vital capacity, respectively, using an ideal line joining peak flow to zero flow.
Results: From the 268 subjects classified as normal never smokers, mean values for post-bronchodilator central concavity were 18.6% in males and 9.1% in females and those for peripheral concavity were 50.5% in males and 52.4% in females. There were moderately strong correlations between concavity and forced expired ratio (forced expiratory volume in 1 second/forced vital capacity) and mid-flow rate (forced expiratory flow between 25% and 75% of the FVC [FEF25%–75%]; r=-0.70 to -0.79). The additional number of individuals detected as abnormal using the concavity indices was substantial, especially compared with FEF25%–75%, where it was approximately doubled. Concavity was more specific for symptoms.
Conclusion: The inclusion of these concavity measures in the routine reports of spirometry would add information on small airway obstruction at no extra cost, time, or effort.
Keywords: early airway disease, airflow obstruction, COPD
Plain language summary
This study investigated whether assessing the concave pattern of the flow–volume curve was more reliable than conventional spirometric indices for detecting early small airway obstruction. We compared conventional spirometric indices with the degree of concavity in 890 individuals, aged ≥40 years, recruited for the Burden of Obstructive Lung Disease Australia study. We found that the prevalence of abnormal spirometry was far higher for concavity than for conventional indices. We also found that concavity was more specific for breathlessness on moderate exercise. We conclude that there is more information in spirometry than is being currently used, which might be valuable in detecting early airway disease.
Introduction
COPD is characterized by airflow obstruction which is slowly progressive and not fully reversible.1 The core pathophysiology is in the small airways with obstruction caused by wall fibrosis and progressive obliteration of the lumen.2 Emphysema may later occur and will then contribute to airflow obstruction.2–4 Clinical guidelines advocate the measurement of spirometry in people suspected of having the disease and emphasize spirometry’s importance in the early detection to arrest disease progression,1,5 using the ratio of the forced expiratory volume in 1 second to the forced vital capacity (FEV1/FVC). However, these spirometric measures may not be best for detecting small airway changes. There is a need for better measures of airflow obstruction, and it has long been recognized that there is more information in the expiratory flow–volume curve than is currently utilized in routine practice. The current advances in spirometers make it entirely feasible to easily access this information, and we have explored one approach to this goal.
The functional information provided by the FEV1 is necessarily limited to detecting abnormal flows during the first second of the expiratory maneuver when the lung is relatively inflated and the thin-walled elastic small airways are exposed to significant distending forces. Consequently, during the first second, the contribution from the small airways to total airway resistance is limited unless advanced generalized small airway narrowing is present and would not particularly be sensitive to abnormalities caused by early small airway lesions.2,6,7 In contrast, the maximal expiratory flow–volume (MEFV) curve represents a complete description of maximum flows and includes the region beyond 1 second where the lung is less inflated and the airway distending forces are lower, resulting in progressive narrowing as lung volume falls.
Furthermore, it has long been recognized that the first indication of abnormal ventilatory function is the development of concavity in the tail of the curve, and this is explicitly acknowledged in the American Thoracic Society/European Respiratory Society statement on the interpretation of lung function.8 Indeed, this is supported by the equal pressure point concept9 and modeling based on the wave speed theory of airflow limitation,10 which found that the segment of airways limiting expiratory flow moved progressively into smaller airways as lung volume decreased. This suggests that reduced flows, isolated in the tail of the MEFV curve, were more specific to earliest small airway dysfunction. Based on these insights, newer methods have been developed11,12 but are complex and have not yet been translated widely into clinical or research practice.
It is generally agreed that the major underlying mechanism causing concavity is volume-dependent nonuniform airway emptying.13,14 This occurs when lung compartments have widely differing expiratory time constants, as would be expected in obstructive lung disease with small airway dysfunction, with the fastest and slowest emptying compartments contributing disproportionally to expiratory flows as the lung empties. In the early stages of COPD disease, distribution is patchy14 causing an increase in nonuniform airway emptying and the development of a concave-shaped MEFV curve. Hence, we suggest that the first indication of early airflow obstruction is the appearance of concavity, which is in agreement with other measures.8,13,14–17
A number of studies have investigated this concave pattern of the MEFV curve and concluded that the presence of a concavity was closely associated with airflow obstruction,13,18,19 even when the FEV1 was normal,20,21 and correlated with spirometric indices of small airway obstruction.22 Concavity correlated better with symptom scores in childhood asthma than FEV1 and FEV1/FVC,18 was able to differentiate between healthy adults and mild COPD,23 and was sensitive to bronchiolitis and its severity following lung transplantation.24 These and other studies have used a number of methods to assess curvature of the MEFV curve: 1) the slope ratio introduced by Mead,13 which is based on instantaneous tangents slopes measured at multiple points along the descending curve; 2) angle β, which is the angle subtended between two lines drawn from mid vital capacity to residual volume (RV) and peak expiratory flow (PEF) at total lung capacity;25 3) the average curvature index, which is a multistep method requiring data smoothing and fitting a quadratic function to the curve;18 and 4) Kmax, a complex global curvature index obtained by fitting a hyperbolic function.19 Other less-specific methods have included the area under the MEFV curve26 and analysis of expiratory flow patterns against time.27 However, these methods have been complex and difficult to apply routinely, have not been evaluated in a community sample of adults, and none of them have been incorporated into routine spirometry software or clinical guidelines.
We recently reported a preliminary analysis of two new but simple indices of concavity (central and peripheral) and showed that the prevalence of abnormal concavity in the general population was, as perhaps expected, higher than that estimated using the FEV1/FVC ratio.28 In the current study, we report more detailed analysis of concavity in a random sample of people aged ≥40 years from the Burden of Obstructive Lung Disease (BOLD) Australia study.29 We have assessed the reliability of a new measure of concavity and its validity as an indicator of mild airway obstruction in this population.
Methods
This is an analysis of data collected in a randomly selected sample of subjects aged ≥40 years living in Victoria and Tasmania who participated in the Australian part of the BOLD initiative.29 Subjects underwent pre-bronchodilator (pre-BD) and post-bronchodilator (post-BD) spirometry with flow–volume curves. With the assistance of an interviewer, they completed the standardized BOLD questionnaire.30 We assessed MEFV curves to quantify the degree of central and peripheral concavities (detailed below), produced upper limits of normal, and described the prevalence of an abnormal degree of concavity in our sample compared with standard spirometric measurements.
Ethics approval
The study was approved by the Human Research Ethics Committee of the University of Sydney (ref no 12-2006/9724). Additionally, the Tasmania and Melbourne sites obtained local ethics approval from Tasmania Health and Medical Human Research Ethics Committee (Ref: H0009637) and The Alfred Hospital Ethics Committee (Ref: 118/08), respectively. All participants gave written informed consent for this study.
Spirometry
Spirometry was performed according to the European Respiratory Society standard31 using the ultrasonic EasyOne spirometer (ndd Medizintechnik, Zürich, Switzerland). This spirometer was chosen because it is accurate, retains accuracy during extended use,32 and provides automatic grading of test quality with feedback to the tester. Spirometry was measured before and after 15 minutes of the administration of 200 μg salbutamol. At least three pre-BD and three post-BD trials were performed. Only curves that met acceptability criteria and were repeatable to within ±0.2 L for both FEV1 and FVC were included. The highest values for FEV1 and FVC from acceptable curves were used.31
Central and peripheral concavities
The method used to quantify the degree of concavity has been described previously.28 In brief, our central and peripheral indices of concavity were based on the forced expiratory flow measured at the point where 50% (FEF50%) and 75% (FEF75%) of the FVC had been expired, respectively (Figure 1). The degree of concavity was expressed as the percentage decrease of these measured flows from the corresponding “ideal” reference flows calculated by assuming that the descending limb had no curvature (ie, was a straight line, see Figure 1), a general finding in normal adult spirometry.33 The FEF50% and FEF75% were taken from the single acceptable trial with the highest FEV1. The value of volume expired to peak expiratory flow (vPEF; Figure 1) was measured manually from the MEFV curve, but assuming a fixed value equal to the mean values obtained in this study (0.65 L in males and 0.51 L in females) introduced a small error.
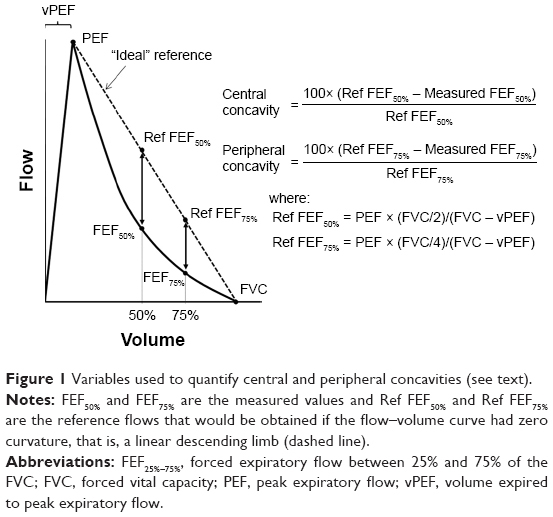 | Figure 1 Variables used to quantify central and peripheral concavities (see text). |
The post-BD upper limit of normal (ULN) for central and peripheral concavities were derived separately for males and females who met the following criteria: lifelong non-smokers; <12% change in either FEV1 or FVC post bronchodilator; no diagnosis of asthma, emphysema, COPD, or chronic bronchitis by physician; and not limited in performing moderate exercise.
In the BOLD questionnaire, the assessment of current health-limiting exercise capacity was according to whether capacity to perform “moderate” daily activities (eg, pushing a vacuum cleaner, moving a table) was “not limited at all”, “limited a little”, or “limited a lot”. Since there were few responses in this latter group, we have combined the last two groups to provide separate male and female data. Spirometry and concavity were compared by quantifying their sensitivity and specificity for detecting exercise limitation.
Statistical analysis
Data were expressed as a percentage or mean ± SD for continuous variables. Two-tailed t-test, assuming unequal variances, was used to assess differences between means. A probability of ≤5% was taken as significant. Spirometric reference equations from Hankinson et al34 were used to obtain % predicted. Spearman’s rank correlation was used to determine the relationship between indices of concavity and spirometric values. The ULNs for central and peripheral concavities were determined separately for normal male and female subjects as the 95th percentile. Correlations were used to assess repeatability. Reliability was assessed as the intraclass (within-subject) correlation. We used exercise limitation due to dyspnea as an independent indicator of the presence of (cardio)respiratory disease and assessed the validity of the new measures of concavity (central and peripheral concavities > ULN) and the established measures (FEV1/FVC, FEV1, and forced expiratory flow between 25% and 75% of the FVC [FEF25%–75%] < lower limit of normal [LLN]) by quantifying their sensitivity and specificity for this functional limitation.
Results
Demographics and descriptive spirometry
Descriptive data for males (n=424) and females (n=466) are summarized in Table 1. By design of the BOLD study, the sample was middle-aged and older (range, 40–87) with a mean age of 59 years. Overall, males had significantly more central (P<0.001) and higher FEF25%–75% (expressed as percent predicted, P=0.001) than females, but peripheral concavity and FEV1/FVC ratio were similar.
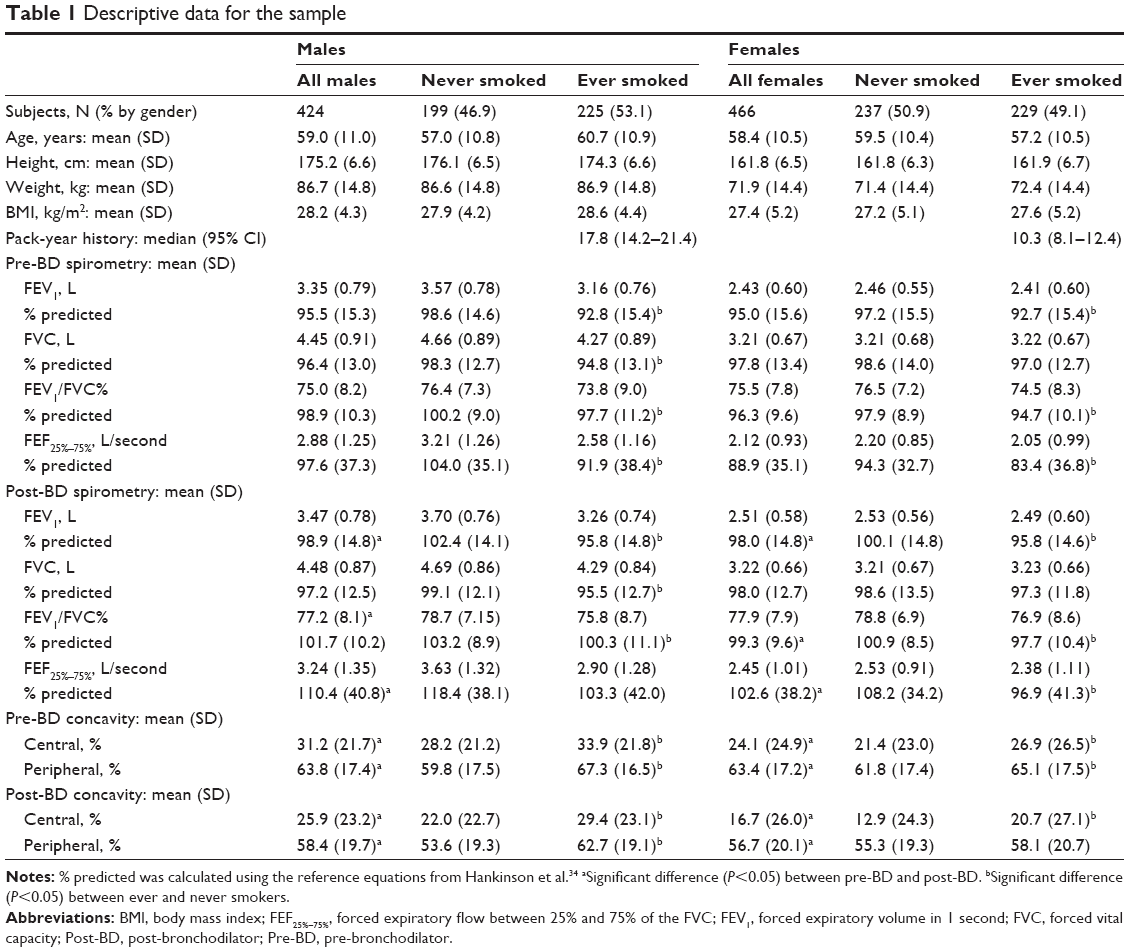 | Table 1 Descriptive data for the sample |
A higher proportion of males than females had ever smoked and had a higher lifetime tobacco consumption (median pack-years: males, 17.8; females, 10.3, P<0.001). Participants who had ever smoked had significantly lower values for FEV1/FVC, FEV1, and FEF25%–75%, and a greater degree of central concavity and in males, peripheral concavity also, when compared with those who had never smoked. However, in females, peripheral concavity was similar between ever and never smokers. Smoking history had little effect on spirometry or degree of concavity up to approximately a 10 pack-year history in females and a 20 pack-year history in males, but above these levels, there was a significant decrease in FEV1, FEV1/FVC, and FEF25%–75%, and a greater degree of central and peripheral concavities (Figure 2).
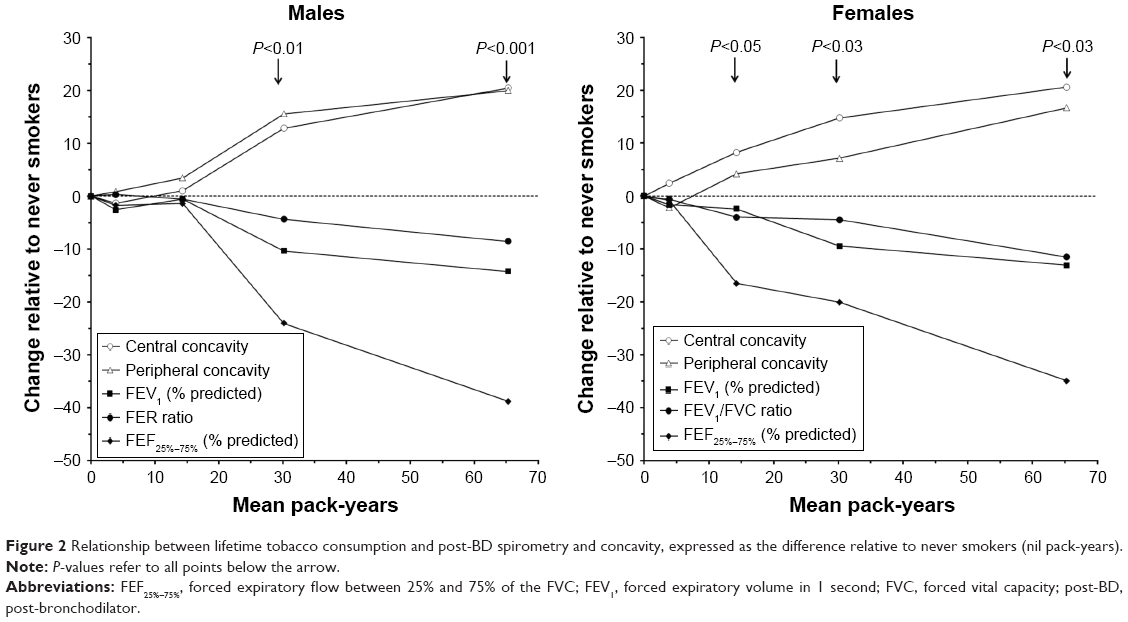 | Figure 2 Relationship between lifetime tobacco consumption and post-BD spirometry and concavity, expressed as the difference relative to never smokers (nil pack-years). |
Following the administration of salbutamol, there was a significant increase in FEV1, FEV1/FVC, and FEF25%–75%, but not in FVC, and a reduction in the degree of central and peripheral concavities.
In both genders, there were strong negative correlations between the new measures of concavity and FEV1, FEV1/FVC, and FEF25%–75%, but not with FVC (Table 2).
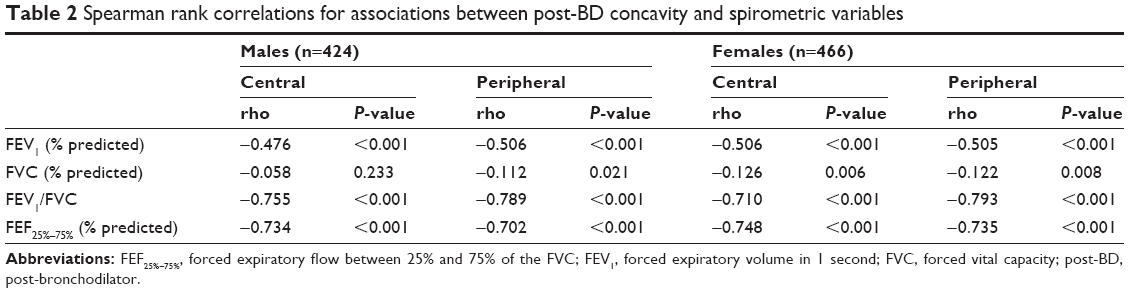 | Table 2 Spearman rank correlations for associations between post-BD concavity and spirometric variables |
Upper limits of normal for concavity indices
A total of 268 subjects (131 males and 137 females) were classified as normal never smokers (as defined above) and their descriptive data are summarized in Table 3. In these subjects, the mean value for post-BD central (males, 18.6%; females, 9.1%) and peripheral (males, 50.5%; females; 52.4%) concavities deviated significantly from the “ideal” reference value (dotted line in Figure 1) of zero, which probably reflected an “aging effect” on small airway function in our middle-aged and older normal sample. However, and perhaps as expected, the ULN for post-BD measurements of central (males 56.4%; females 45.8%) and peripheral (males 77.5%; females 78.1%) concavities were quite large.
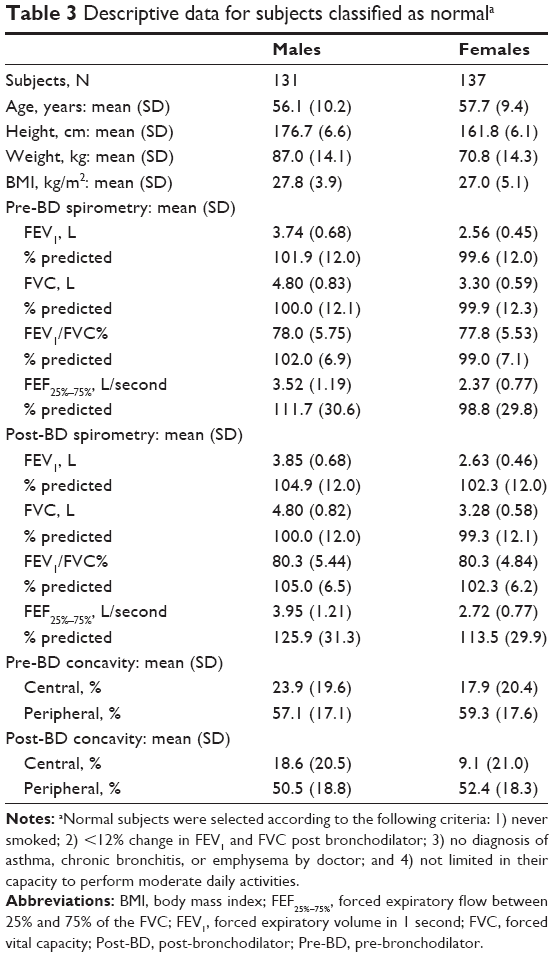 | Table 3 Descriptive data for subjects classified as normala |
Reliability and sensitivity of the concavity indices
Intraclass (within-subject) correlations for central and peripheral concavities were ~0.96, which was similar to FEF25%–75% and only slightly lower than for FEV1, FVC, and FEV1/FVC (0.99). However, as shown in Table 4, the prevalence of an abnormally high degree of central or peripheral concavity was substantially greater than the prevalence of an abnormally low FEV1, FVC, FEV1/FVC, or FEF25%–75%. This was especially the case in males and against the Hankinson et al34 normative values, which were used throughout the BOLD program and elsewhere (which specifically take into account the aging effect in a way that GOLD1 does not for FEV1/FVC values). Thus, these concavity indices substantially increase the pick-up of early airflow obstruction, even when allowing for the quite wide variation of normal in this aging sample. These additional small airway-obstructed subjects are located in the right-upper quadrant of the plots shown in Figures 3–5.
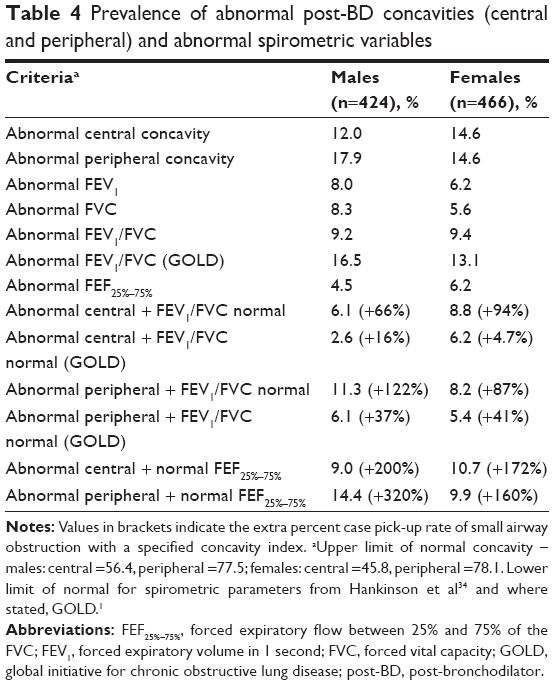 | Table 4 Prevalence of abnormal post-BD concavities (central and peripheral) and abnormal spirometric variables |
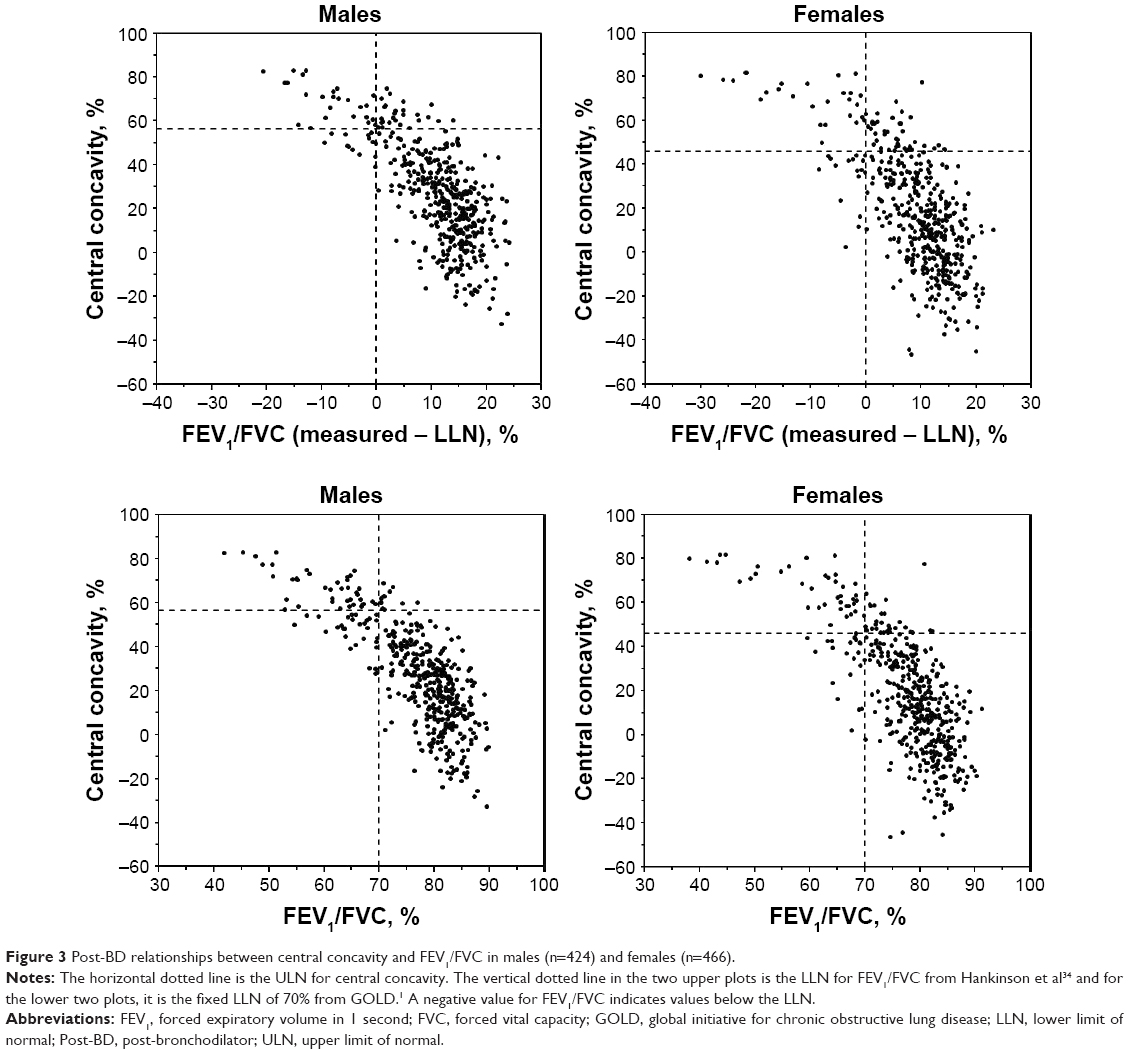 | Figure 3 Post-BD relationships between central concavity and FEV1/FVC in males (n=424) and females (n=466). |
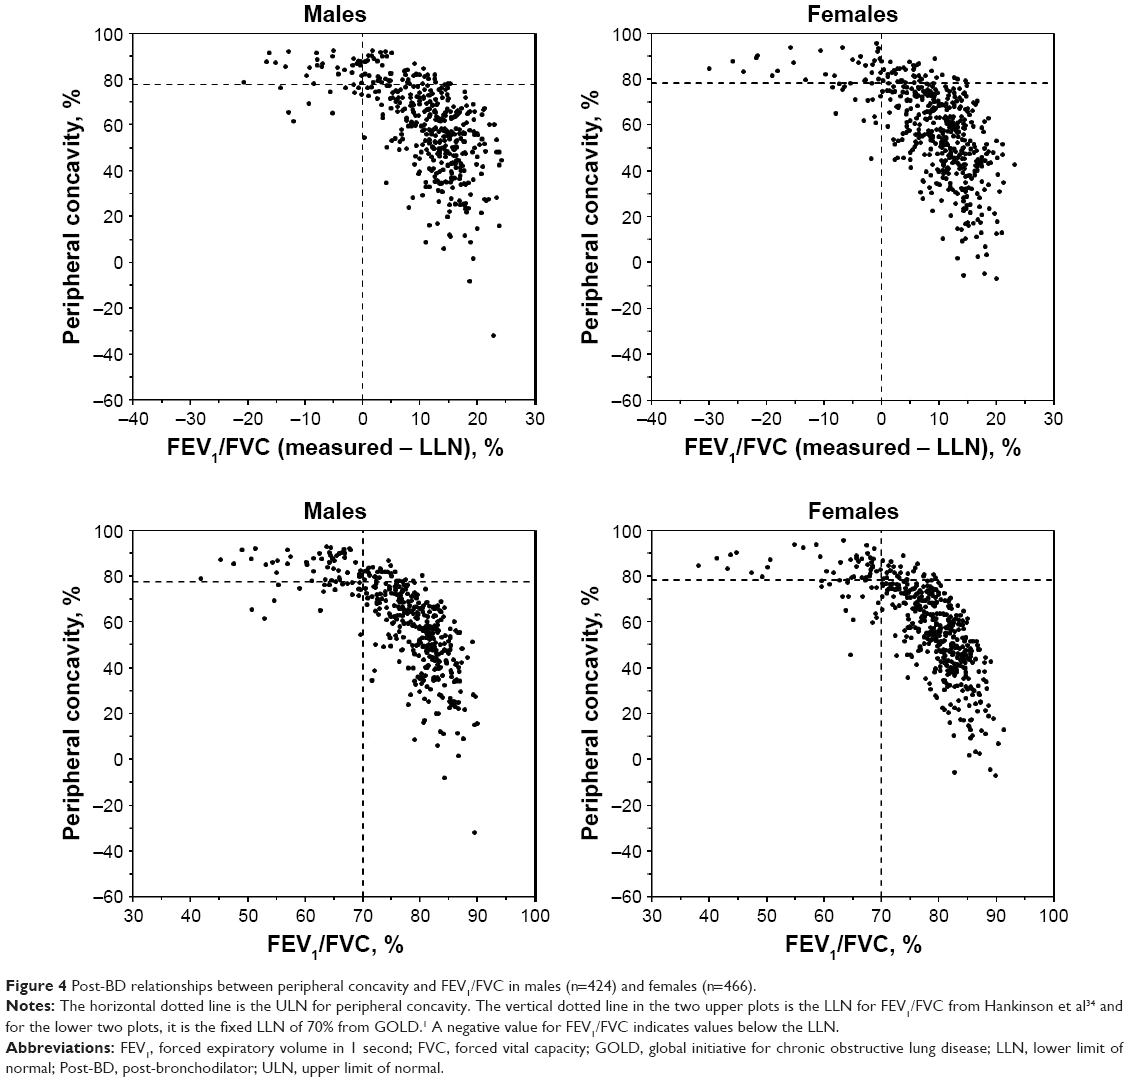 | Figure 4 Post-BD relationships between peripheral concavity and FEV1/FVC in males (n=424) and females (n=466). |
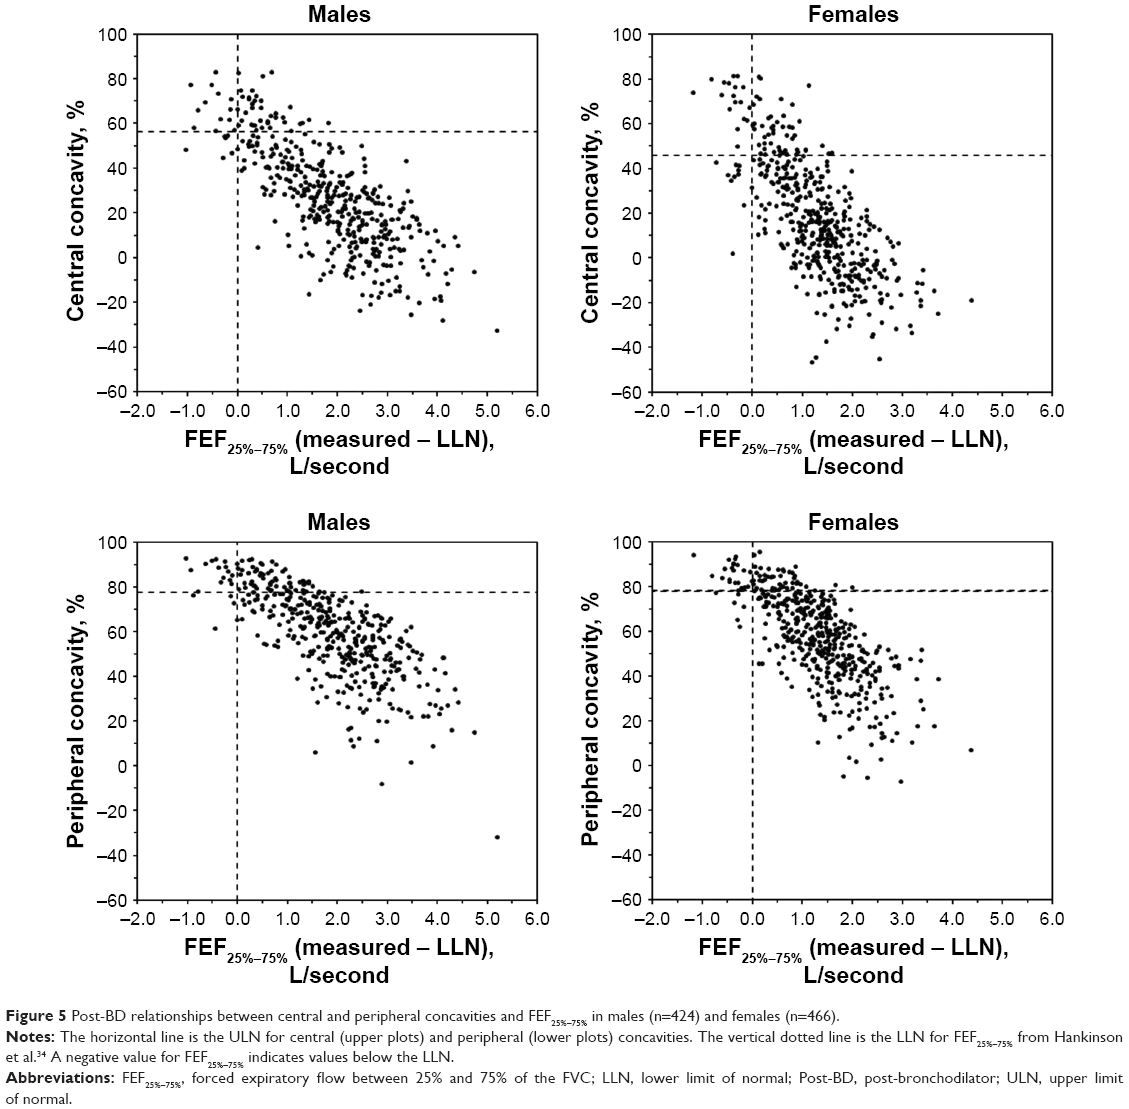 | Figure 5 Post-BD relationships between central and peripheral concavities and FEF25%–75% in males (n=424) and females (n=466). |
Detailed inspection of these extra abnormal curves in the right upper quadrants suggests that for the most part there was just visually obvious scalloping of the MEFV curves, such that conventional indices of airway obstruction remained relatively unaffected.
Relationship to symptoms
We found that 16.6% of both men and women reported exercise limitation due to breathlessness when other spirometric indices were normal. Approximately 21% of these individuals had abnormal concavity (Table 5). On the other hand, the specificity of abnormal concavity indices was high. Over 90% of people without exercise limitation due to breathlessness had normal concavity indices.
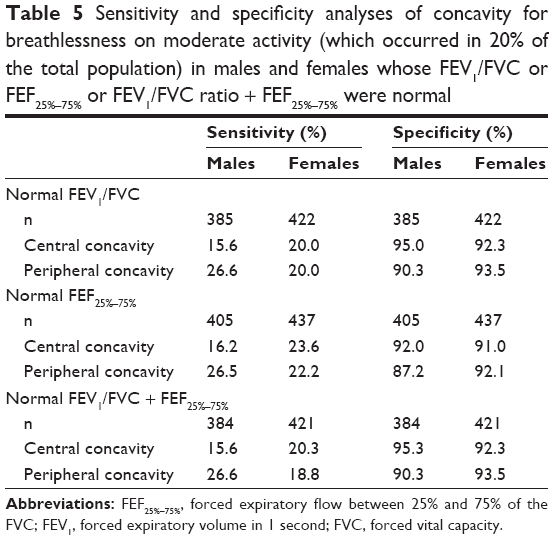 | Table 5 Sensitivity and specificity analyses of concavity for breathlessness on moderate activity (which occurred in 20% of the total population) in males and females whose FEV1/FVC or FEF25%–75% or FEV1/FVC ratio + FEF25%–75% were normal |
Discussion
We have described a simple and reliable method for quantifying the characteristic scalloping affecting the central and peripheral regions of the MEFV curve in chronic airflow obstruction, to determine if this would better detect early small airway obstruction. We have developed ULN reference values and showed that an abnormal degree of concavity was a common finding in our middle-aged and older community sample, especially in males and in those with a significant smoking history.
These concavity indices are statistically related to more conventional spirometric values, so broadly as we might expect, they reflect the same thing, that is, airflow obstruction. On the other hand, we quite commonly detected an abnormal MEFV curve when the FEV1/FVC ratio and FEF25%–75% were within normal limits (Figures 3–5). This, together with our finding of imperfect correlations between our indices of concavity and FEV1, FEV1/FVC, and FEF25%–75%, suggests that assessing concavity could provide additional physiological information not available using these spirometric variables. In this, we have developed on themes already published18,20–23 but, in addition, the high specificity of abnormal concavity for breathlessness on exercise in people with normal FEV1/FVC and FEF25%–75% (Table 5) suggests that concavity is clinically useful for excluding early airway disease as a cause of breathlessness.
It was also informative to visualize the MEFV curves where concavity was not significantly abnormal, but one or more other spirometric indices suggested COPD. Detailed examination suggested for the most part abnormalities in the central airways and did not necessarily reflect the small airway-predominant disease, which is characteristic of smokers.
Perhaps, our most important finding was a higher prevalence of abnormal concavity compared with abnormal FEV1, FEV1/FVC, and especially FEF25%–75%, in our middle-aged and older population, especially when using Hankinson’s normative spirometry values.34 It was less advantageous against GOLD “fixed” FEV1/FVC ratio of <70%, which does not take into account the aging effect on airway narrowing,1 though our regression analyses for concavity measures did not show significant aging effects. It will be of interest whether an early singular increase in concavity alone is a signal for likely progression of airway obstruction to “conventional” COPD with FEV1/FVC reduction.
A particular strength of the concavity indices is that they seemed more sensitive to small airway narrowing than FEF25%–75%, which is currently used for this purpose. There were also few potentially “false negatives” (in the lower left panels in Figures 3–5). The presence of other comorbid causes of dyspnea, such as heart disease, may explain the low sensitivity of this measure, which only detects airflow obstruction, but detailed data on comorbidities were not collected. Our concavity measures are also easy to understand because they closely match the way most reporters already, but imprecisely, visually assess curvature. They intuitively tend to take into account inspection of the ideal reference line from PEF to end FVC and also take into account vPEF in the assessment of MEFV curves. Furthermore, by assuming a fixed value for vPEF equal to the mean obtained in this study (males, 0.65 L; females, 0.51 L), our curvature indices could be directly and easily obtained for current tests and any spirometric datasets that included FVC, FEF50%, FEF75%, and PEF.
Of those whose central concavity was normal, 10.9% of males (but only 3.2% of females) had an abnormal degree of peripheral concavity. This indicated that concavity confined to the terminal region of the MEFV curve was uncommon but may reflect the very earliest small airways disease. The contrasting sole central concave pattern was less common in males (12.9%) than in females (29.2%), perhaps again a reflection of the higher male tobacco consumption. We have previously observed this latter pattern in young adults, and also in lungs that are small relative to chest size post lung transplantation, presumably reflecting excessive recruitment of lung elastic recoil with radial traction as the lung deflates.
The present study has several limitations. Our community sample included relatively few people with established COPD according to established criteria based on FEV1/FVC, as one might expect, but has still highlighted that some of these individuals did not really have classic COPD with generalized airway disease focused physiologically in the small airways, but more likely had an obstructive abnormality focused in the larger airways only. A clinical population more enriched for reduced FEV1/FVC should be studied to get more numeric information on this group in terms of assessing sensitivity and specificity for different measures. Our concavity ULN values were based on a relatively small number of normal subjects (131 males and 137 females), and so they may need to be refined when more data are available. Another potential limitation of this study is the straight line from PEF to RV, assuming this to be the ideal reference line. Such a near-linear descending limb is indeed the most common finding in people with normal spirometry,33 and we believe that our assumption is justified in providing a zero reference for concavity. Further research is also needed to compare this new and easily available spirometric index with more complex measures, such as the forced oscillation12 and multiple-breath nitrogen washout tests,11 which attempt to obtain much the same thing, that is, early signals of airway disease.
Conclusion
We propose that for the assessment of early “small airway” airflow obstruction, this newly updated measurement of concavity in the MEFV curve should be incorporated into routine spirometry reports and indeed should become the standard for defining small airway disease and subclinical COPD. Waiting for the FEV1/FVC ratio to change may be too insensitive and can underestimate the amount of disease present both in the individual and in the community.
Acknowledgments
We wish to acknowledge the participants and all the previous research staff at each of the study sites for recruiting and testing participants: Australian Operations Centre: Tessa Bird and Wei Xuan, Woolcock Institute of Medical Research, Glebe, NSW; Melbourne site: Angela Lewis, Joan Raven, Joan Green, and Marsha Ivey, Department of Epidemiology and Preventive Medicine, Monash University, Melbourne, VIC; Tasmanian sites: Carol Phillips, Royal Hobart Hospital, TAS; Loren Taylor, University of Tasmania, Hobart, TAS. We are also very grateful to Paula Fottrell, School of Medicine, University of Tasmania, for measuring vPEF from individual MEFV curves and Sheikh M. Alif, Allergy and Lung Health Unit, Centre for Epidemiology and Biostatistics, School of Population and Global Health, for assisting with the figures.
The research was supported by the Australian Lung Foundation Ludwig Engel Grant-in-Aid for Physiological Research and National Health and Medical Research Council of Australian Centre for Chronic Respiratory Disease. The BOLD Australia study was funded by the National Health and Medical Research Council.
Author contributions
All authors contributed toward data analysis, drafting and revising the paper and agree to be accountable for all aspects of the work.
Disclosure
The authors report no conflicts of interest in this work.
References
Global Initiative for Chronic Obstructive Lung Disease (GOLD). Global strategy for the diagnosis, management and prevention of chronic obstructive pulmonary disease; 2017. Available from: http://www.goldcopd.org/gold-2017. Accessed June 29, 2017. | ||
Hogg JC, Macklem PT, Thurlbeck WM. Site and nature of airway obstruction in chronic obstructive lung disease. N Engl J Med. 1968;278(25):1355–1360. | ||
Macklem PT. The physiology of small airways. Am J Respir Crit Care Med. 1998;157(5):S181–S183. | ||
Dunnill MS. The classification and quantification of emphysema. Proc R Soc Med. 1969;62(10):1024–1027. | ||
Yang IA, Dabscheck E, George J, et al. The COPD-X Plan: Australian and New Zealand Guidelines for the Management of Chronic Obstructive Pulmonary Disease 2016. (Version 2.48). Accessed December 15, 2016. | ||
McDonough JE, Yuan R, Suzuki M, et al. Small-airway obstruction and emphysema in chronic obstructive pulmonary disease. N Engl J Med. 2011;365(17):1567–1575. | ||
Verbanck S, Schuermans D, Meysman M, Paiva M, Vincken W. Noninvasive assessment of airway alterations in smokers: the small airways revisited. Am J Respir Crit Care Med. 2004;170(4):414–419. | ||
Pellegrino R, Viegi G, Brusasco V, et al. Interpretative strategies for lung function tests. Eur Respir J. 2005;26(5):948–968. | ||
Mead J, Turner JM, Macklem PT, Little JB. Significance of the relationship between lung recoil and maximum expiratory flow. J Appl Physiol. 1967;22(1):95–108. | ||
Dawson SV, Elliot EA. Wave-speed limitation on expiratory flow – a uniforming concept. J Appl Physiol Respir Environ Exerc Physiol. 1977;43(3):498–515. | ||
Verbanck S, Schuermans D, Van Muylem A, Paiva M, Noppen M, Vincken W. Ventilation distribution during histamine provocation. J Appl Physiol (1985). 1997;83(6):1907–1916. | ||
Frantz S, Nihlen U, Dencker M, Engström G, Löfdahl CG, Wollmer P. Impulse oscillometry may be of value in detecting early manifestations of COPD. Respir Med. 2012;106(8):1116–1123. | ||
Mead J. Analysis of the configuration of maximal expiratory flow-volume curves. J Appl Physiol Respir Environ Exerc Physiol. 1978;44(2):156–165. | ||
Cosio M, Chezzo H, Hogg JC, et al. The relationship between structural changes in small airways and pulmonary function tests. N Engl J Med. 1978;298:1277–1281. | ||
Pedersen OF, Ingram RH Jr. Configuration of maximum expiratory flow-volume curve: model experiments with physiological implications. J Appl Physiol 1985. 1985;58(4):1305–1313. | ||
O’Donnell CR, Castle RG, Mead J. Changes in flow-volume curve configuration with bronchoconstriction and bronchodilation. J Appl Physiol (1985). 1986;61(6):2243–2251. | ||
O’Donnell CR, Ross RM. The flow-ratio index: an approach for measuring the influence of age and cigarette smoking on maximum expiratory flow-volume curve configuration. Chest. 1990;98(3):643–646. | ||
Wildhaber JH, Sznitman J, Harpes P, et al. Correlation of spirometry and symptom scores in childhood asthma and the usefulness of curvature assessment in expiratory flow-volume curves. Respir Care. 2007;52(12):1744–1752. | ||
Zheng CJ, Adams AB, McGrail MP, Marini JJ, Greaves IA. A proposed curvilinear index for quantifying airflow obstruction. Respir Care. 2006;51(1):40–45. | ||
Schachter EN, Kapp MC, Maunder LR, Beck G, Witek TJ. Smoking and cotton dust effects in cotton textile workers: an analysis of the shape of the maximum expiratory flow volume curve. Environ Health Perspect. 1986;66:145–148. | ||
Kraan J, van der Mark TW, Koeter GH. Changes in maximum expiratory flow-volume curve configuration after treatment with inhaled corticosteroids. Thorax. 1989;44(12):1015–1021. | ||
Ohwada A, Takahashi K. Concave pattern of a maximal expiratory flow-volume curve: a sign of airflow limitation in adult bronchial asthma. Pulm Med. 2012;2012:797495. | ||
Dominelli PB, Forster GE, Guenette JA, et al. Quantifying the shape of the maximal expiratory flow-volume curve in mild COPD. Respir Physiol Neurobiol. 2015;219:30–35. | ||
Omland O, Sigsgaard T, Pedersen OF, Miller MR. The shape of the maximum expiratory flow-volume curve reflects exposure in farming. Ann Agric Environ Med. 2000;7(2):71–78. | ||
Kapp MC, Schachter EN, Beck GJ, Maunder LR, Witek TJ Jr. The shape of the maximum expiratory flow volume curve. Chest. 1988;94(4):799–806. | ||
Vermaak JC, Bunn AE, de Kock MA. A new lung function index: the area under the maximum expiratory flow-volume curve. Respiration. 1979;37(2):61–65. | ||
Morris MJ, Lane DJ. Tidal expiratory flow patterns in airflow obstruction. Thorax. 1981;36(2):135–142. | ||
Johns DP, Walters J, Walters EH. Diagnosis and early detection of COPD using spirometry. Invited review. J Thorac Dis. 2014;6(11):1557–1569. | ||
Toelle BG, Xuan W, Bird TE, et al. Respiratory symptoms and illness in older Australians: the Burden of Obstructive Lung Disease (BOLD) study. Med J Aust. 2013;198(3):144–148. | ||
Buist AS, McBurnie MA, Vollmer WM, et al; BOLD Collaborative Research Group. International variation in the prevalence of COPD (the BOLD Study): a population-based prevalence study. Lancet. 2007;370(9589):741–750. | ||
Miller MR, Hankinson J, Brusasco V, et al; ATS/ERS Task Force. Standardisation of spirometry. Eur Respir J. 2005;26(2):319–338. | ||
Walters JA, Wood-Baker R, Walls J, Johns DP. Stability of the Easyone ultrasonic spirometer for use in general practice. Respirology. 2006;11(3):306–310. | ||
Davidson FF Jr, Burke GW 3rd. Physiologic differentiation of upper and lower airway obstruction. Ann Otol Rhinol Laryngol. 1977;86(5 Pt 1):630–632. | ||
Hankinson JL, Odencrantz JR, Fedan KB. Spirometric reference values from a sample of the general U.S. population. Am J Respir Crit Care Med. 1999;159(1):179–187. |
 © 2017 The Author(s). This work is published and licensed by Dove Medical Press Limited. The
full terms of this license are available at https://www.dovepress.com/terms
and incorporate the Creative Commons Attribution
- Non Commercial (unported, 3.0) License.
By accessing the work you hereby accept the Terms. Non-commercial uses of the work are permitted
without any further permission from Dove Medical Press Limited, provided the work is properly
attributed. For permission for commercial use of this work, please see paragraphs 4.2 and 5 of our Terms.
© 2017 The Author(s). This work is published and licensed by Dove Medical Press Limited. The
full terms of this license are available at https://www.dovepress.com/terms
and incorporate the Creative Commons Attribution
- Non Commercial (unported, 3.0) License.
By accessing the work you hereby accept the Terms. Non-commercial uses of the work are permitted
without any further permission from Dove Medical Press Limited, provided the work is properly
attributed. For permission for commercial use of this work, please see paragraphs 4.2 and 5 of our Terms.