Back to Journals » International Journal of Nanomedicine » Volume 13
Improved osseointegration properties of hierarchical microtopographic/nanotopographic coatings fabricated on titanium implants
Authors Zemtsova EG ![]() , Yudintceva NM
, Yudintceva NM ![]() , Morozov PE, Valiev RZ, Smirnov VM, Shevtsov MA
, Morozov PE, Valiev RZ, Smirnov VM, Shevtsov MA ![]()
Received 2 January 2018
Accepted for publication 24 February 2018
Published 11 April 2018 Volume 2018:13 Pages 2175—2188
DOI https://doi.org/10.2147/IJN.S161292
Checked for plagiarism Yes
Review by Single anonymous peer review
Peer reviewer comments 5
Editor who approved publication: Dr Thomas Webster
Elena G Zemtsova,1 Natalia M Yudintceva,2 Pavel E Morozov,1 Ruslan Z Valiev,1 Vladimir M Smirnov,1 Maxim A Shevtsov2–5
1Saint Petersburg State University, St Petersburg, Russia; 2Institute of Cytology of the Russian Academy of Sciences (RAS), St Petersburg, Russia; 3Pavlov First Saint Petersburg State Medical University, St Petersburg, Russia; 4Polenov Russian Scientific Research Institute of Neurosurgery, Almazov National Medical Research Centre, St Petersburg, Russia; 5Klinikum rechts der Isar, Technical University of Munich, Munich, Germany
Background: Titanium (Ti) implants are extensively used in reconstructive surgery and orthopedics. However, the intrinsic inertness of untreated Ti implants usually results in insufficient osseointegration. In order to improve the osteoconductivity properties of the implants, they are coated with hierarchical microtopographic/nanotopographic coatings employing the method of molecular layering of atomic layer deposition (ML-ALD).
Results: The analysis of the fabricated nanostructured relief employing scanning electron microscopy, atomic force microscopy, and electron spectroscopy for chemical analysis clearly demonstrated the formation of the nanotopographic (<100 nm) and microtopographic (0.1–0.5 µm) titano-organic structures on the surface of the nanograined Ti implants. Subsequent coincubation of the MC3T3-E1 mouse osteoblasts on the microtopographic/nanotopographic surface of the implants resulted in enhanced osteogenic cell differentiation (the production of alkaline phosphatase, osteopontin, and osteocalcin). In vivo assessment of the osseointegrative properties of the microtopographically/nanotopographically coated implants in a model of below-knee amputation in New Zealand rabbits demonstrated enhanced new bone formation in the zone of the bone–implant contact (as measured by X-ray study) and increased osseointegration strength (removal torque measurements).
Conclusion: The fabrication of the hierarchical microtopographic/nanotopographic coatings on the nanograined Ti implants significantly improves the osseointegrative properties of the intraosseous Ti implants. This effect could be employed in both translational and clinical studies in orthopedic and reconstructive surgery.
Keywords: titanium implants, microtopographic/nanotopographic coatings, hierarchical coatings, molecular layering, MC3T3-E1 osteoblasts, osseointegration
Introduction
Titanium (Ti)-based implants represent one of the most widely applied materials in reconstructive orthopedics because of their biocompatibility and high corrosion resistance.1–5 However, the main issue of the Ti implants is the lack of osseointegration of them due to the inertness of the material.5 Previously, it was demonstrated that the nanostructured surface of the implants significantly improves the biocompatibility.6 Nanostructured organization of the implants (eg, nanotubes, nanofibers, nanowires, and nanorods) promotes the integration of the implants with the surrounding bone tissues.7–12 Thus, in the study by Seidling et al, the tested Ti implants with the nanostructured hyperhydrophilic chromosulfuric acid surface demonstrated 17-fold increase in the bone-to-implant contact and de novo bone formation in a gap healing model using Göttingen minipigs.13
Presumably the nanotopography induces the cell differentiation and proliferation. Recently, it was demonstrated that α1β1 integrin signaling pathway determines the osteoinductive effect of nanotopography on mesenchymal stem cells (MSCs). The effect was abrogated when obtustatin, an α1β1 integrin inhibitor, was applied.14 Another pathway is mediated by RhoA/ROCK, following activation by FAK in response to integrin clustering on the surface of the implants.15,16
The effect of the nanotopography on the cell differentiation is explained by the process termed “mechanotransduction” that represents the conversion of the mechanical signals into biochemical signals through biomolecules or via direct impact through the cytoskeleton on the nucleus and chromosomes.17 Cell attachment to the nanotopography results in a change in the biochemical process mediated by cadherins and integrins presented in the filopodia.18,19 Changes in the cytoskeleton tensions influence the nucleoskeleton providing the alterations in the nucleus morphology.20,21 Thus, MSCs in the presence of the osteogenic supplements (ie, dexamethasone and β-glycerophosphate) showed high alkaline phosphatase (ALP) activity and runt-related transcription factor 2 (RUNX2) expression on the nanotopography of 200 nm in comparison with 50 and 100 nm.22 In addition, the upregulation of the several relevant genes including BMP2 was found on the nanostructured surfaces.23
The height of the nanostructures and the pattern of their distribution have a high importance on the expression of the biomarkers by MSCs.24 Thus, Lavenus et al clearly demonstrated that nanopits with diameters of 30 nm (Ti30), 150 nm (Ti150), and 300 nm (Ti300) influenced the expression of integrins.25 Thus, Itgβ1 and Itgβ5 were highly expressed on the Ti300 samples.25 This study indicates that nanopattern influences the cellular adhesion to the implants’ surface. In addition, the nanosurface height influences the focal adhesions of MSCs as shown in the study by Sjöström et al.26 Thus, the highest focal adhesion presence was observed at nanopillars of 15 nm with fewer and smaller adhesions at the heights of 55 and 100 nm.26 The influence of other parameters such as diameter and shape of the nanopattern is less clear.
Recent studies clearly demonstrated that combining nanostructured coating with submicron architecture of coating could further increase the biocompatibility of the designed implants.27 Microtopography (0.1–100 μm) that mimics the native extracellular matrix influences cells at the single cell level, while the nanoarchitecture (1.0–100 nm) influences the individual cell receptors.15 Thus, in the work by Chen et al, the authors applied hierarchical structures combining nanoglobules and submicron button-like clusters from collective packing of these nanoglobules for increasing the bioactivity of the surface.28 The rough surface of the samples increases the proliferation of the osteoblasts, cytoskeleton organization, and production of the ALP and osteocalcin nearly 10-fold. Subsequent analysis of the osteogenic gene expression by quantitative real-time polymerase chain reaction demonstrated the enhanced expression of the osteogenic genes (such as ALP, osteocalcin, collagen I, and Runx2) in the cells following coculturing on the Ti34Zr14Cu22Pd30 nanoglass composite with submicron–nanometer-sized hierarchical structures.28 Anisotropic topographies (eg, grooves and stripes) at the microtopographic level influence the morphological and physiochemical features of the cells and their intercellular contacts. In addition, the increased surface area benefits the protein absorption and the super-amphiphilicity, and high surface energy enhances the cell-to-substrata affinity.29 Thus, Huang et al demonstrated that hierarchical surface enhances fibronectin absorption and initial MG-63 cell attachment.30 Up-do-date reported studies indicate that in the hierarchical coatings the microtopography influences the initial cell attachment, while the nanosurface induces the biochemical intracellular changes that lead to cell proliferation and differentiation.
In the current study, for the fabrication of microtopographic/nanotopographic coatings on the Ti implants, we applied the method of molecular layering of atomic layer deposition (ML-ALD).31,32 The main advantages of the proposed method are 1) the possibility to obtain microstructures/nanostructures with a high precision (Ł); 2) precise regulation of the geometry and roughness of the coating;33,34 and 3) high adhesive properties of the nanostructured coatings on the surface achieved by the sequential and cyclic chemisorption of low molecular weight reagents from the gas phase.35 Following in vitro assessment of the synthesized microcoatings/nanocoatings employing the MC3T3-E1 osteoblasts, the fabricated Ti implants were further analyzed in the model of the below-knee amputation in New Zealand rabbits. Herein we report that formulated hierarchical microtopographic/nanotopographic coating significantly improves the osseointegration properties of the Ti implants.
Methods
Nanograined Ti samples
Nanograined Ti samples (hereafter nano-Ti) were fabricated at Nanomet LLC (Ufa, Russia) from grade 4 Ti ingots with the length of 1 m. Plastic deformation of Ti ingots has been performed on ECAP–Conform setup at 400°C. Every ingot was treated 5 cycles, as described previously.36 Average grain size of the synthesized nano-Ti was ~100 nm. For in vitro investigations, we fabricated samples of 3 mm thickness from nano-Ti rods (diameter =10 mm) using EDM machine ARTA 123 PRO (Delta-Test Ltd., Russia). Grinding and polishing of the working surface of the samples were carried out using Buehler Ecomet 250 PRO (Buehler, USA) machine with automatic nozzle AutoMet 250 (Buehler, USA) until mirror-like surface was resulted using the facilities of the resource center (Innovative Technologies of the Composite Nanomaterials, Saint Petersburg State University, St Petersburg, Russia). Additional grinding was performed using emery paper of 600, 800, and 1,200 grains. Polishing was performed by colloidal silica-polishing suspension 40-6370-064 (Buehler – MasterMet, Buehler, USA, 20 nm). At the final stage, the samples were cleaned with acetone and deionized water in an ultrasonic bath for 15 minutes. These samples were shaped as plane parallel plates with the diameter of 10 mm. Doubly deionized water, ethanol of the purity of ≥%98, and alcohol–water solutions with the addition of polyethylene glycol-400 have been used for the intermediate washing of the ingots from the mechanical contaminations. According to the atomic force microscopy (AFM) data, the polished surface of the Ti substrate after mechanical treatment has been characterized by low roughness: medium height (Ra) was ~6.8 nm, and maximal height of the isolated defects did not exceed 10–11 nm; average roughness within the grain boundaries lied within the range of 1–2 nm. For the synthesis of coatings, we used titanium (IV) chloride (TiCl4) of the purity of ≥%98, propargyl alcohol (HC≡C-CH2OH) of the purity of ≥%98, and carbon tetrachloride (CCl4) of the purity of ≥%98. As the carrier gas, compressed He (purity =99.9999%) has been used.
Synthesis of titano-organic coatings
The synthesis of titano-organic nanostructured coatings on the nano-Ti surface has been performed using gas-phase setup that provided the surface chemical reactions on the nano-Ti surface in the stream of inert gas using ML-ALD, as described previously.37 Preliminary chemical treatment of the surface was performed at 300°C or 400°C. Support surface was treated by CCl4 vapors and propargyl alcohol that allowed grafting of one layer of the propargyl groups onto the substrate surface. Surface chemical reactions were performed at 200°C on the nano-Ti substrates after the preliminary chemical pretreatment. Titano-organic groups with the triple bonds were fabricated using the reaction between active groups on the nano-Ti surface and the corresponding low molecular weight compounds, namely TiCl4 and propargyl alcohol. Moreover, the amount of the treatment cycles by TiCl4 and propargyl alcohol determines the length of the synthesized one-dimensional structures. Chemical composition of the synthesized structures was studied using ESCALAB™ 250Xi X-ray photoelectron spectrometer (Thermo Fisher Scientific, Waltham, MA, USA). Surface topography (roughness) was studied by AFM (using Solver P47 Pro microscope, Optophase, France) in the half-contact mode in air and scanning electron microscopy (SEM) using Zeiss Supra 40VP microscope (Carl Zeiss Meditec AG, Jena, Germany) based on Interdisciplinary Resource Center (Nanotechnology of Saint Petersburg State University). Prior to the cytological investigations, all the samples were stored in ethanol (purity of ≥95%). Before in vitro experiments, the samples were sterilized using autoclave block at 120.85 C for 1 hour.
Cells
MC3T3-E1 mice osteoblasts were obtained from the Russian Cell Culture Collection at the Institute of Cytology of the Russian Academy of Sciences (St Petersburg, Russia). Cells were grown in CO2 incubator (37°C, 6% CO2) in DMEM supplemented with 10% fetal bovine serum (FBS), 2 mM L-glutamine, and antibiotics (100 units/mL penicillin G and 100 μg/mL streptomycin).
MC3T3-E1 cell viability and proliferation
The cells were incubated with DMEM (control) and Ti samples for 1, 6, 12, 24, and 48 hours in a CO2 incubator. Following incubation, they were washed, and viability was assessed using 3-(4,5-dimethylthiazol-2-yl)-2,5 diphenyl tetrazolium bromide (MTT) assay. We used the Vybrant® MTT Cell Proliferation Assay Kit according to the manufacturer’s protocol (Thermo Fisher Scientific) using photometer Bio-Rad 680 (Bio-Rad Laboratories Inc., Hercules, CA, USA). Cell proliferation was analyzed using crystal violet assay following 1, 6, and 12 hours and 1, 2, 3, and 7 days of coincubation on the nontreated and coated nano-Ti samples.
Assessment of cells adhesion
For the analysis of cell adhesion on the Ti samples, MC3T3-E1 osteoblasts were coincubated on the surface of the samples for 24 hours 7 and 14 days in a CO2 incubator. The samples of control and nanostructured Ti covered by titano-organic films were placed in Petri dishes (Nunc®, Thermo Fisher Scientific, Waltham, MA, USA) and exposed to the suspension of the MC3T3-E1 cells at a concentration 6×10⁴/cm2 in 100 μL of culture medium (nutrient DMEM; Thermo Fisher Scientific) containing 10% FBS (HyClone Laboratories Inc., South Logan, UT, USA) and antibiotic mixtures of penicillin/streptomycin (Sigma-Aldrich Co., St Louis, MO, USA). The samples were carefully placed into CO2 incubator at 37°C. Cultivation of cells on the surface of samples was carried out for 24 hours and 7 and 14 days. Following coincubation, the culture medium of Petri dishes was removed, and the samples were triple washed with phosphate-buffered saline (PBS) and fixed in 20-fold volume of 2.5% glutaraldehyde (Sigma-Aldrich). Assessment of the coating–cell interaction morphology was performed using SEM. Following incubation, the cells were washed with PBS, fixed in 2.5% glutaraldehyde in 0.1 M cacodylate buffer (Sigma-Aldrich). Evaluation of the cell morphology was performed using scanning electron microscope JSM-35.7 (JEOL, Tokyo, Japan).
Analysis of the cell osteogenic differentiation
For the detection of the osteogenic differentiation, we employed the analysis of early marker (ie, ALP) and late markers (ie, osteopontin and osteocalcin) of differentiation.38–41 Assessment was performed following 1 hour and 1, 2, 7, 14, and 28 days of MC3T3-E1 cell coincubation with the control and titano-organic nanocoated samples in a CO2 incubator. Culture medium was analyzed for the levels of proteins using Alkaline Phosphatase Assay Kit (colorimetric; Abcam, Cambridge, MA, USA), Osteopontin N-Half ELISA Kit (Clontech, USA), and Osteocalcin Kit (Clontech) according to the manufacturer’s protocol.
Animals and surgical procedure
New Zealand male rabbits were used in the study, which was approved by the Animal Ethics Committee at the Pavlov First State Medical University of St Petersburg (St Petersburg, Russia). The animals were obtained from animal nursery “Rappolovo” RAMN (St Petersburg, Russia). The mean weight constituted 3.9 kg (±0.45) before surgery. The Ti implant constituted 3.5 cm in length and 4.0 mm in diameter (Figure S1). Each of the rabbits received one nanograined Ti implant in the tibia close to the joint. Following amputation, the animals were divided as follows (3 animals per group): control group with the insertion of the noncoated Ti implant and groups 2–6 that received implant samples 1–5, respectively. The animals were anesthetized with intramuscular injections of fentanyl and fluanisone at 0.5 mL per kg body weight and intraperitoneal injections of diazepam (Valium, Roche, France) at 2.5 mg per animal. The skin and fascial layers were opened and closed separately. The periosteal layer was gently pulled away from the surgical area and was not sutured. The implants of various modifications were press-fit into the bone canal. The animals were kept in separate cages, and immediately after surgery, they were allowed full weight-bearing. Follow-up period constituted 8 weeks. After a follow-up period, the animals were killed using intravenous injections of Pentobarbital®. In the end of the observation following the sacrifice of animals, the implant was removed using removal torque (RTQ) method to measure the formation of new bone. In addition, the surface of the extracted implants was analyzed using scanning electron microscope JSM-35.7 (JEOL).
X-ray analysis
Animals’ radiographs (46 kV, 200 mA, 32 ms, Trophy N800 HF, Fujifilm 24×30 cm2 IP cassette type C, 1 m film-focus distance) were taken prior to the surgery and 8 weeks after the insertion of the intraosseous Ti implant for the assessment of the position of the latter. The analysis also included the measurement of the mean cortical thickness in the bone–implant contact zones (distal and proximal ends of the implant). Prior to the procedure, the animals were sedated by an intramuscular injection of xylazine (1–3 mg/kg) and ketamine (10–50 mg/kg) mixture.
RTQ measurements
In the end of the follow-up period, the osseointegration strength of the implant was measured by RTQ test in Ncm. The RTQ instrument was applied for the assessment of the interfacial shear strength between the bone tissue and the implant surface. The static torque was applied to the implant at a linearly increasing rate of 9.5 Ncm/s as was proposed earlier by Sul.42
Statistical analysis
One- or two-tailed Student’s t-test was used to evaluate the differences between the control and experimental groups. All data were run using Statistica Version 9.2 for Windows (StatSoft Inc., Tulsa, OK, USA). P-values <0.05 were considered statistically significant for all tests.
Ethical approval
For the animal experiments, the approval was provided by the local ethical committee of Pavlov First Saint Petersburg State Medical University (St Petersburg, Russia) in accordance with institutional guidelines for the welfare of animals and in compliance with Directive 2010/63/EU.
Results
Characterization of the titano-organic nanostructured coatings
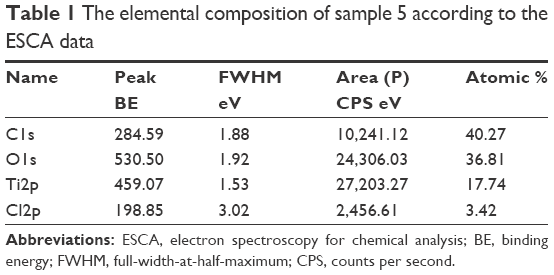
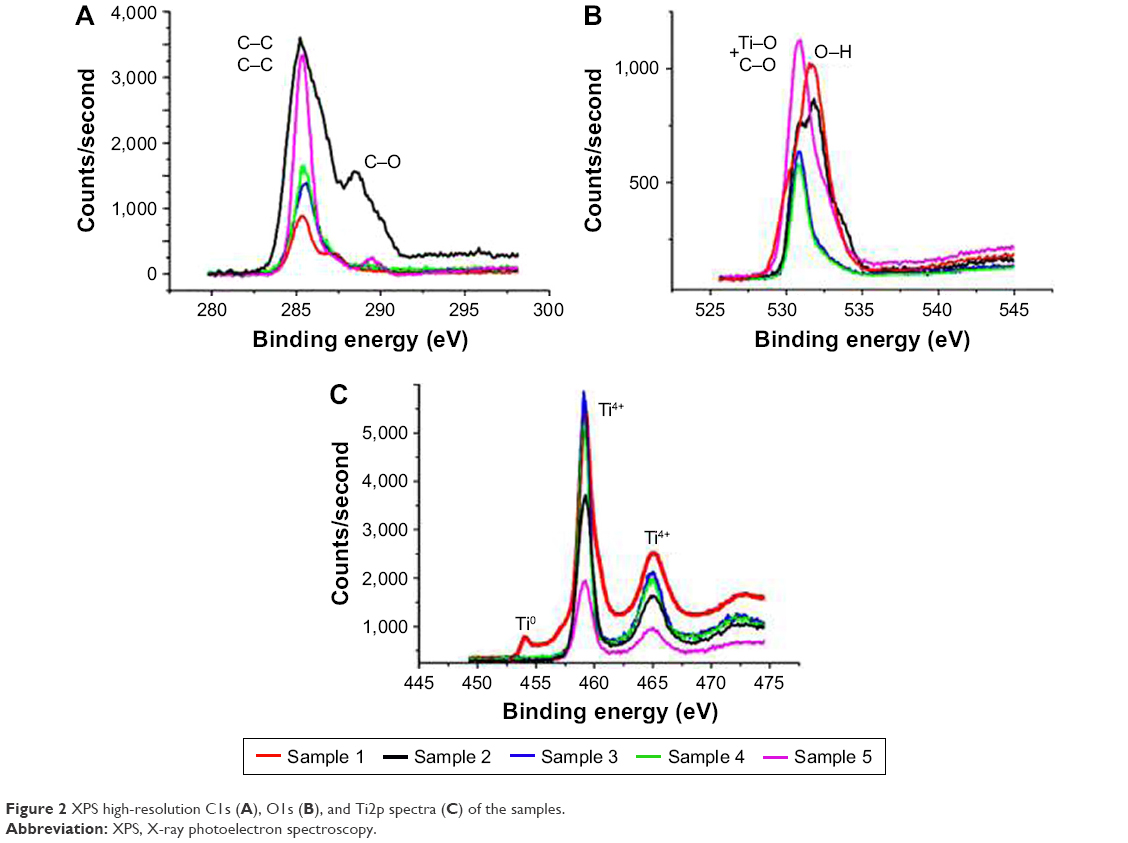
In order to characterize the architecture of the synthesized coatings (namely the distance between titano-organic structures and their height and width), we used 1) SEM and 2) AFM. To evaluate the elemental composition of the sample surfaces, we used electron spectroscopy for chemical analysis (ESCA). In the current study, we analyzed 5 series (3 samples each for every set of the conditions) with the different roughness degrees. ESCA spectrum of the sample 5 (Figure 1) indicates the presence of titano-organic groups (Ti, carbon, and oxygen) in the nanostructured coating. Table 1 presents the elemental composition of the sample. Amount of chlorine (3.42%) can be explained on the one hand by noncompensated biogenic contamination by NaCl and on the other hand by the presence of Ti−Cl groups in the coating that was not reacted with alcohol due to the steric hindrance. High-resolution spectra for titano-organic groups (ie, Ti, oxygen, and carbon) demonstrated a gradual growth of the response intensity of C−C bonds of various multiplicity and C−O with subsequent decrease of response intensity of Ti4+ due to the gradual coating growth (Figure 2). Figure 3 presents the microphotographs of the grain substrate structure of the polished nano-Ti. Grain size for this nano-Ti was in the range of 60–80 nm, and the grains had distinct borders; the dislocation density was not so high. In addition, we observed the grains of the size of 100–120 nm with a high number of the dislocations. According to the data fit, the average grain/subgrain size was 100 nm in the nano-Ti samples (Table 2). Figure 4 and Table 3 summarize the characteristics of nanostructured coatings for all 5 samples. In order to adjust microtopography (ie, the distance between synthesized nanostructures and their size), we selected two parameters for the variations during the synthesis: 1) temperature of the surface pretreatment (300°C or 400°C); and 2) the number of cycles of the surface treatment (10, 15, or 20 cycles). The surface relief for every sample was studied at least in 3 points. The roughness was evaluated by fitting the AFM data for the 10×10 micron pictures. Gwyddion package was used for this fitting along with the specialized packages from Zeiss. SEM and AFM analyses of the variation of the nanocoating structural characteristics demonstrated significant influence of the temperature change on the nanostructure formation. Support treatment at 300°C with subsequent ML-ALD growth requires 15 cycles in order to get the continuous layer of titano-organic structures. Support treatment at 400°C provides full coverage already after 10 treatment cycles (Figure 4). Table 3 demonstrates the increase in the growth rate for titano-organic nanostructures with the increase in surface pretreatment from 300°C to 400°C. Height and size of the nanostructures for 20 ML-ALD cycles at 300°C and for 10 ML-ALD cycles at 400°C are comparable. Nanostructures form continuous layer with a height of 15–35 nm. The distance between titano-organic nanostructures varies between 50 and 100 nm (Figure 4). The height of nanostructures increases at the increase both in temperature and in the number of ML-ALD cycles. Nanostructure height varies between 5 and 14 nm for sample 1 and 100–220 nm for sample 5 with the subsequent increase of the average roughness of sample surfaces (Table 3). While increasing pretreatment temperature from 300°C to 400°C, one can observe significant growth of the nanostructures. Thus, we observed a 5.7-fold increase in the height for the nanostructured samples, treated by ML-ALD for 15 cycles, and a 6.3-fold height increase after 20 treatment cycles. Temperature increase from 300°C to 400°C leads to a 6-fold increase in the thickness. This behavior correlates with the activation of the nano-Ti surface at higher temperature that leads to the higher titano-organic coating.
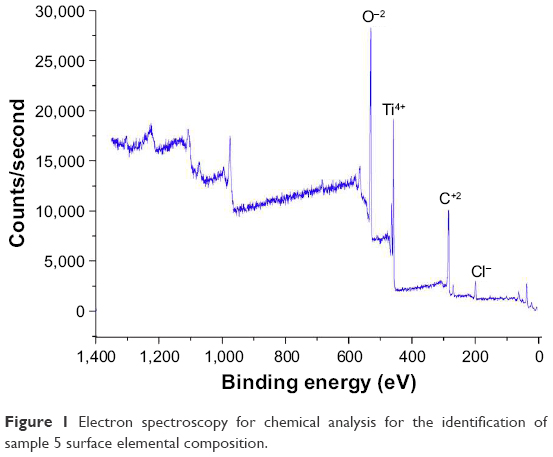 | Figure 1 Electron spectroscopy for chemical analysis for the identification of sample 5 surface elemental composition. |
 | Table 1 The elemental composition of sample 5 according to the ESCA data |
 | Figure 2 XPS high-resolution C1s (A), O1s (B), and Ti2p spectra (C) of the samples. |
 | Figure 3 Characterization of the noncoated nanograined titanium samples. (A) Microphotograph of grain structure of nanotitanium samples. (B) Scanning electron microscopy of the polished titanium surface. (C) AFM reconstruction of the polished surface of nanotitanium with microtopography of the sample surface according to the AFM reconstruction. |
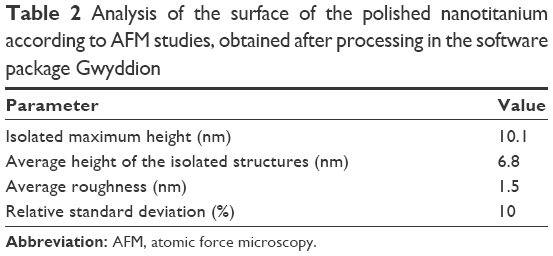 | Table 2 Analysis of the surface of the polished nanotitanium according to AFM studies, obtained after processing in the software package Gwyddion |
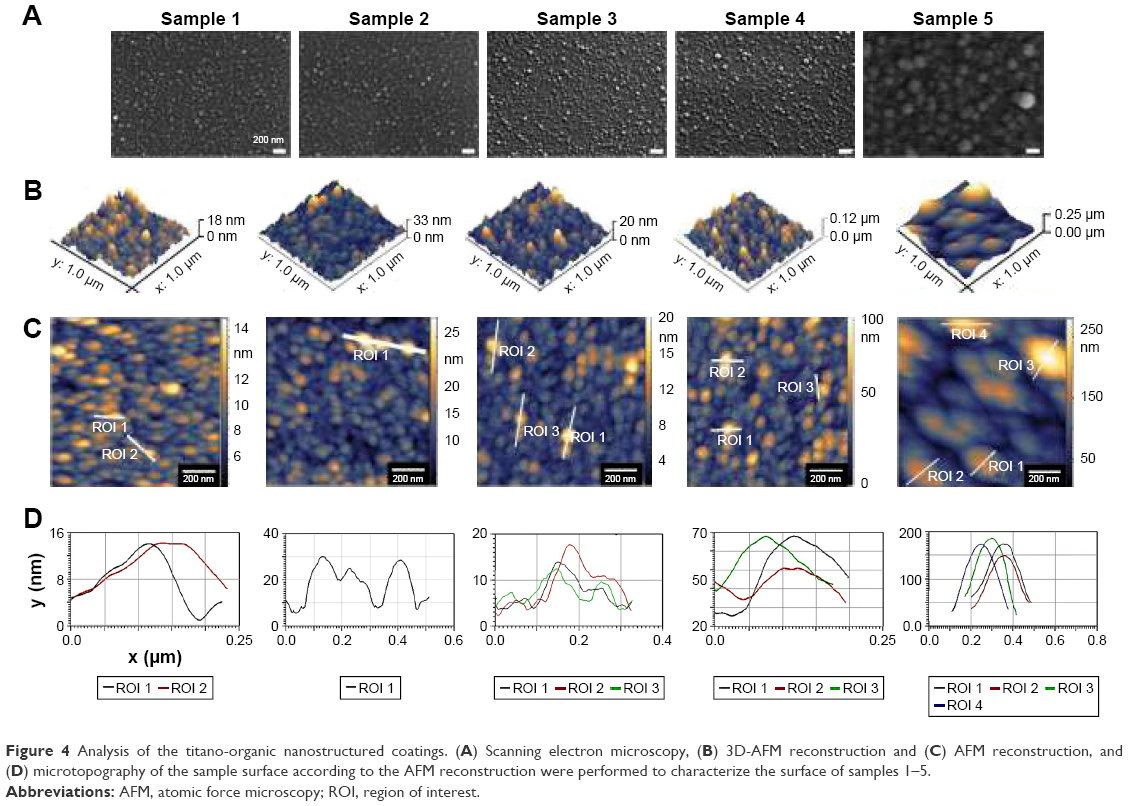 | Figure 4 Analysis of the titano-organic nanostructured coatings. (A) Scanning electron microscopy, (B) 3D-AFM reconstruction and (C) AFM reconstruction, and (D) microtopography of the sample surface according to the AFM reconstruction were performed to characterize the surface of samples 1–5. |
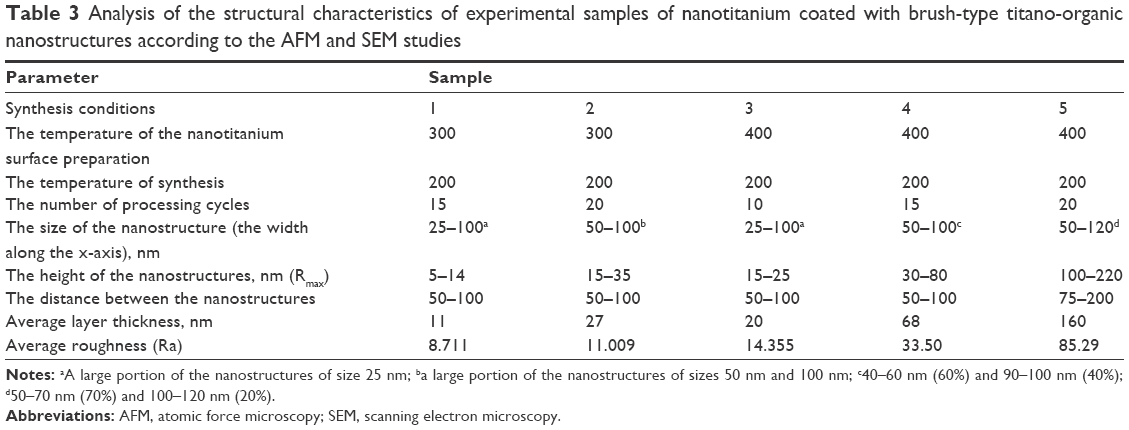 | Table 3 Analysis of the structural characteristics of experimental samples of nanotitanium coated with brush-type titano-organic nanostructures according to the AFM and SEM studies |
Titano-organic coating demonstrates no cytotoxic activity toward MC3T3-E1 cells
The assessment of MC3T3-E1 osteoblast cell adhesion was carried out using the SEM. It was demonstrated that MC3T3-E1 cells adhered to the surface of all the investigated Ti samples (including control sample without surface coating) following 24 hours of coincubation (Figure 5A). On the 7th and 14th days, respectively, the formation of the cell monolayer was observed for all the samples, and there was no change in the cytomorphology of the cells (Figure 5A). Evaluation of the MC3T3-E1 cell viability was studied using the method of MTT test following coincubation of the samples for 1, 6, 12, 24, and 48 hours in CO2 incubator at 37°C, 5% CO2. It was found that MC3T3-E1 cells remained viable for the entire duration of incubation on the surface of all investigated samples. Significant differences in cell viability as compared to control were not detected (Figure 5B). Subsequent analysis of the cell proliferation using the crystal violet assay demonstrated that nanocoatings in samples 2 and 5 slightly decreased the proliferation of the osteoblasts (Figure 5C).
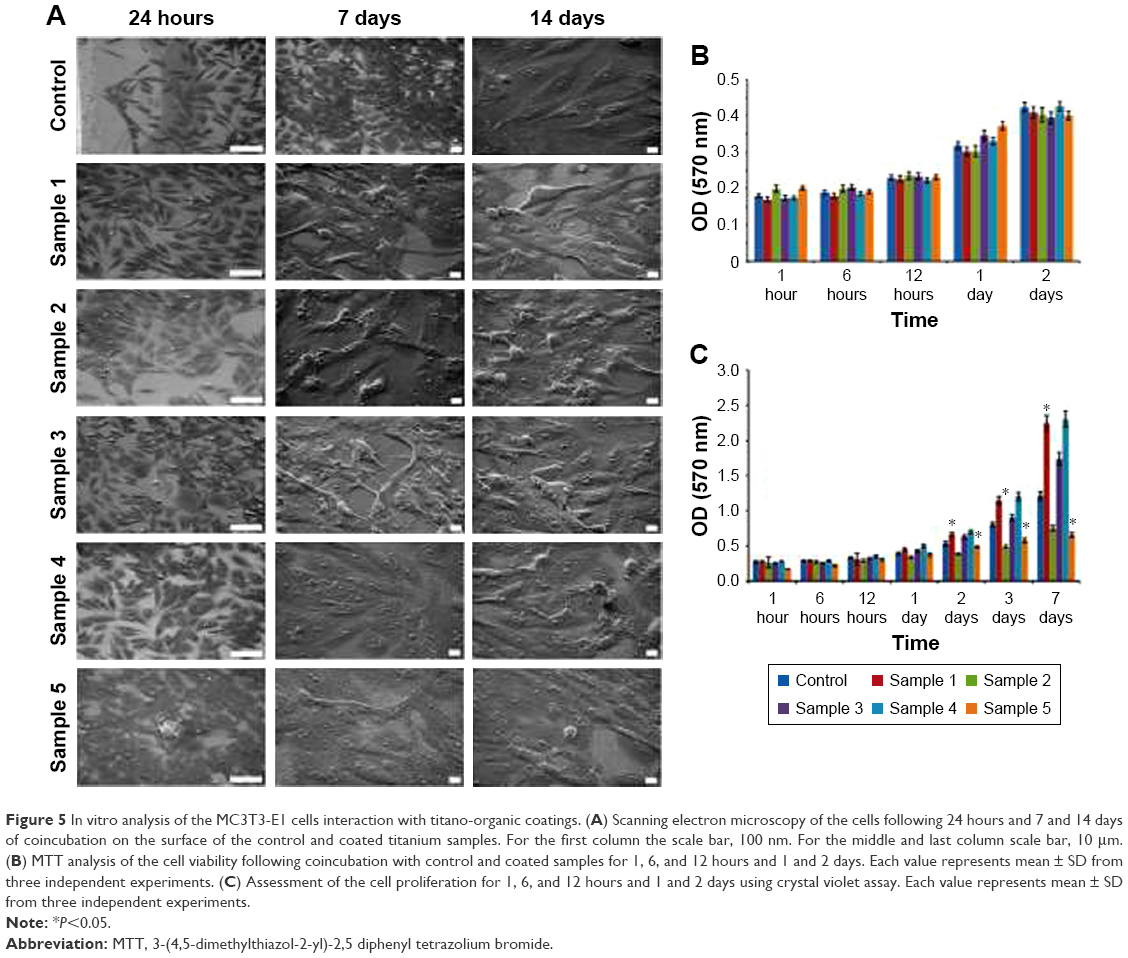 | Figure 5 In vitro analysis of the MC3T3-E1 cells interaction with titano-organic coatings. (A) Scanning electron microscopy of the cells following 24 hours and 7 and 14 days of coincubation on the surface of the control and coated titanium samples. For the first column the scale bar, 100 nm. For the middle and last column scale bar, 10 μm. (B) MTT analysis of the cell viability following coincubation with control and coated samples for 1, 6, and 12 hours and 1 and 2 days. Each value represents mean ± SD from three independent experiments. (C) Assessment of the cell proliferation for 1, 6, and 12 hours and 1 and 2 days using crystal violet assay. Each value represents mean ± SD from three independent experiments. |
Nanotopographic coating of the Ti implants increases the osteogenic differentiation of the osteoblasts
When the differentiation of MC3T3-E1 cells in the control sample was analyzed, we observed a gradual increase in ALP levels up to the 7th day of coincubation with subsequent decrease till day 28 (Figure 6). Levels of ALP in osteoblasts cultured on the surface of the coated samples were different from that of controls. Thus, the ALP activity was sharply increased within 1 and 2 days as compared to the control sample. It was found that following the first day of cultivation, the highest activity of ALP was observed in cells on the surface of sample 5 and was maintained at the same level within 2 days of coincubation. The highest levels of the ALP activity were detected for the samples 2 and 4. Dynamics of changes in the activity of ALP from cells in samples 1 and 3 was characterized by slow and gradual increase for 2 days and the same gradual decline till the 28th day (Figure 6). The marker of late differentiation osteopontin was present in all the samples in cell culture medium following 7 days of coincubation with the MC3T3-E1 osteoblasts (Figure 6). However, the dynamics of its accumulation differed for the cells cultured on the samples with various surface roughness values. Thus, when cells were cultured on samples 4 and 5, the level of osteopontin in the culture medium dramatically increased after 7 days of cultivation and at day 28 reached the values significantly higher than that for samples 1–3 (P<0.05). Dynamics of changes in the content of osteopontin levels in the culture medium for the samples 1–3 had an almost linear character (Figure 6). The assessment of another marker for late osteogenesis (osteocalcin) clearly demonstrated the importance of the thickness and roughness of the implant coating for differentiation of the osteoblasts. Thus, the highest levels of the osteocalcin in the culture medium were observed when sample 5 was applied (average roughness =85.29 nm) with a 1.5-fold increase as compared to control Ti on the 14th day of coincubation and an almost 2-fold increase on the 28th day (Figure 6). The comparable amounts of the osteocalcin levels were detected for sample 4 with nanostructured coating of roughness 33.50 nm. In samples 1–3, the osteocalcin levels were significantly higher when compared to the uncoated control sample, though at the same time significantly lower in comparison with samples 4 and 5 (P<0.05).
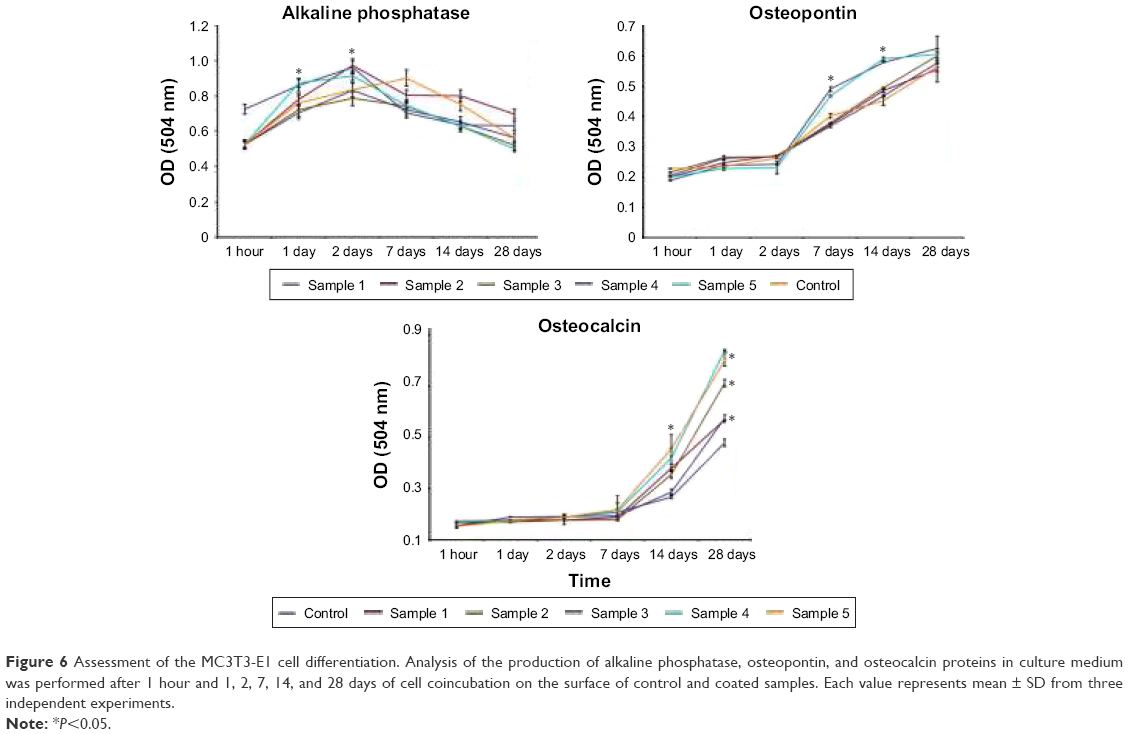 | Figure 6 Assessment of the MC3T3-E1 cell differentiation. Analysis of the production of alkaline phosphatase, osteopontin, and osteocalcin proteins in culture medium was performed after 1 hour and 1, 2, 7, 14, and 28 days of cell coincubation on the surface of control and coated samples. Each value represents mean ± SD from three independent experiments. |
Application of the microtopographic/nanotopographic coatings improves the osseointegration of the implants
Following below-knee amputation, the noncoated or nanocoated Ti implants were inserted into the bone residuum. All rabbits recovered from the procedure without complications. Within the period of 8 weeks after insertion of the implants, there were no complications in the tibia bone (ie, bone ulceration and bone thinning) as demonstrated by the radiographs (Figure 7A). From the serial radiographs, it was clear that there was no axial displacement of the Ti pylon, which indicated that the implant inside tibia was well fixated by the process of osseointegration. Subsequent assessment of the cortical layer thickness in the contact zone of bone–implant surface clearly demonstrated increased new bone formation in the animals with inserted samples 4 and 5, which constituted 1.48±0.18 and 2.3±0.3 mm, respectively (Figure 7B). This was further proved with RTQ test that clearly demonstrated the increased osseointegration strength (Ncm) when samples 4 and 5 were applied – 30.13±3.53 and 41.97±2.54 Ncm, respectively (P<0.001; Figure 7C).
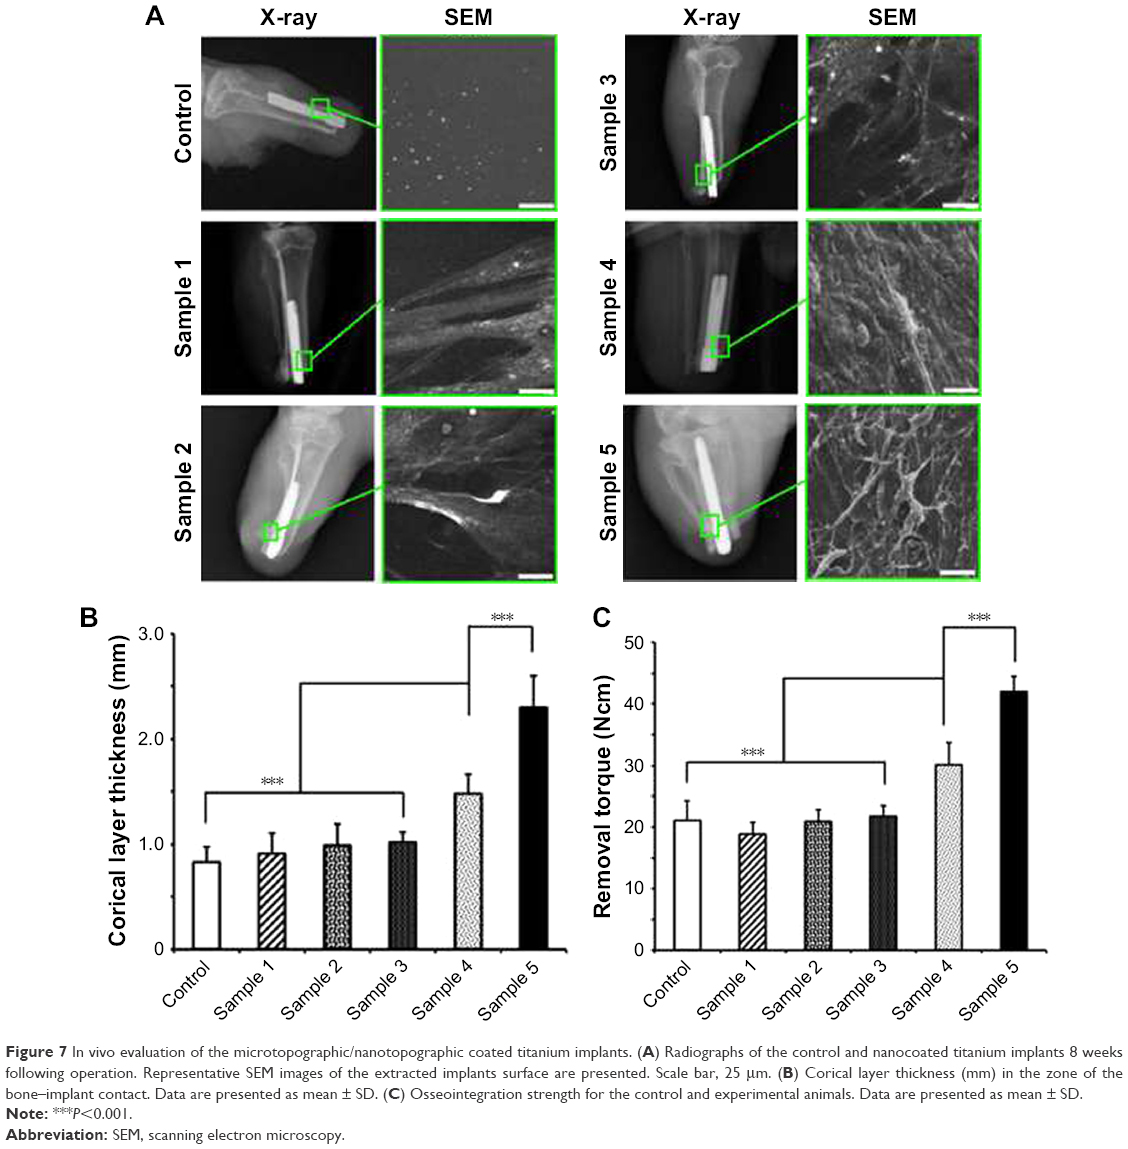 | Figure 7 In vivo evaluation of the microtopographic/nanotopographic coated titanium implants. (A) Radiographs of the control and nanocoated titanium implants 8 weeks following operation. Representative SEM images of the extracted implants surface are presented. Scale bar, 25 μm. (B) Corical layer thickness (mm) in the zone of the bone–implant contact. Data are presented as mean ± SD. (C) Osseointegration strength for the control and experimental animals. Data are presented as mean ± SD. |
Discussion
In the current study, we applied the method of ML-ALD that provided the possibility to efficiently and precisely obtain the required surface microtopographic/nanotopographic parameters (Figure 4; Table 3). The efficacy of this approach could be compared to the currently employed methods including anodic oxidation, plasma deposition, chemical vapor deposition, sol–gel synthesis,43 thermal spray deposition, and electrostatic spray.31,34 In the series of in vitro experiments, we clearly demonstrated that hierarchical microtopographic/nanotopographic coatings significantly enhanced osteogenic cell differentiation of mouse MC3T3-E1 osteoblasts (Figures 5 and 6). When proliferation of the osteoblasts was analyzed, we observed a decrease of MC3T3-E1 proliferation on sample 5 (Figure 5C). Regarding the correlation between cell growth and osteoblast differentiation, Owen et al reported a reciprocal relationship between the decrease in proliferation and a subsequent induction of differentiation.44 Similar results were previously reported by Tran et al when varying PDMS and tantalum ethoxide ratios resulted in coatings of different surface textures ranging from smooth to submicrostructured and nanostructured.45 Strikingly, hierarchical surfaces containing both microscale (1–1.5 μm) and nanoscale (86–163 nm) particles synthesized with 20% and 40% (v/v) tantalum ethoxide significantly improved the performance of implants.45 In another study involving nano–micro Ti implant surface treatment in beagle humerus, the more bone was formed when the nano–micro surface was employed.46 Thus, the nanopatched topography induces increased expression of the osteogenic markers of the MSCs in comparison with the control surfaces as related to bone morphogenetic protein receptor type II, ALP, osteocalcin, osteopontin, RUNX2, and mRNA levels.21,26,47,48 Also, as shown by Tsimbouri et al, highly ordered nanotopography supported the expression of skeletal stem cell enrichment markers STRO1, HOP26, and ALCAM.21 The authors, using the fluorescence in situ hybridization, also reported the increased territorial shifts of chromosome 1 with respect to the nucleus.21
Subsequent in vivo studies in a model of below-knee amputation in New Zealand rabbits confirmed the enhanced osseointegrative properties of the microtopographic/nanotopographic coatings (Figure 7). Increased new bone formation in the zone bone–implant surface as well as corresponding improved osseointegration strength (as measured by RTQ test) were observed in the animals with inserted samples 4 and 5 with microtopography/nanotopography (Figure 7B and C). These obtained in vivo data are comparable with previously published reports.13,42
Further improvement in the biological performance of the implants could be achieved through the application of the bioactive ions, bioligands, and inorganic or organic molecules (ie, polysaccharides including glycosaminoglycans).49,50 In the study by Wang et al, hierarchical microtopographies/nanotopographies containing bioactive ions Ca(2+) and Mg(2+) were analyzed in the series of in vitro experiments.51 Thus, MC3T3-E1 cells grown onto microstructured/nanostructured surface with Ca(2+) implantation exhibited significantly higher differentiation levels of ALP activity and mineralization compared with that on microstructured/nanostructured surface with Mg(2+) implantation indicating the importance of the chemical composite.51 In another study by Sul, it was shown that fluorinated TiO(2) nanotube implants in rabbit femurs demonstrated significantly increased osseointegration strengths (41 vs 29 Ncm; P=0.008) and new bone formation (57.5% vs 65.5%; P=0.008) compared with control implants.42 Application of the peptides or proteins that induce the osteogenic differentiation could also be an option for optimization of the implant surface.52–55 Thus, Gly-Arg-Gly-Asp-Ser peptide on titanium dioxide nanotubes increased MG-63 cell spreading, proliferation, and differentiation.52
Conclusion
The results of the in vitro studies clearly demonstrated that fabrication of the hierarchical microtopographic/nanotopographic coatings on the nanograined Ti implants significantly improves MC3T3-E1 osteoblast osteogenic differentiation. Subsequent in vivo studies in a clinically relevant in vivo model of the below-knee amputation shows that the application of the Ti implant which had the combination of the microstructured and nanostructured coatings results in enhanced osseointegration. The obtained nanotopographic parameters could be further employed in both translational and clinical studies in orthopedic and reconstructive surgery.
Consent for publication
All the authors gave their consent for publication of the presented information and materials.
Acknowledgments
The authors are grateful to Leonid I Potokin for SEM studies and Olga G Genbach, Nelly V Koroleva, and Dmitriy Gavrilov for assistance in animal experiments. The assessment of the nanocoated samples was performed at the resource center at the Scientific Park of the St Petersburg State University (Nanotechnology, X-ray Diffraction Studies, Innovative Technologies of Composite Nanomaterials). The study was supported by a grant from the Russian Science Foundation (Grant No 14-50-00068) and by the Federal Agency of Scientific Organizations, Russia, by State Grant of the Ministry of Health of the Russian Federation (No 32).
Disclosure
The authors report no conflicts of interest in this work.
References
Shevtsov MA, Galibin OV, Yudintceva NM, et al. Two-stage implantation of the skin- and bone-integrated pylon seeded with autologous fibroblasts induced into osteoblast differentiation for direct skeletal attachment of limb prostheses. J Biomed Mater Res A. 2014;102:3033–3048. | ||
Adell R, Eriksson B, Lekholm U, Brånemark PI, Jemt T. Long-term follow-up study of osseointegrated implants in the treatment of totally edentulous jaws. Int J Oral Maxillofac Implants. 1990;5:347–359. | ||
Pitkin M. Design features of implants for direct skeletal attachment of limb prostheses. J Biomed Mater Res A. 2013;101:3339–3348. | ||
Blinova MI, Yudintzeva NM, Nikolaenko NS, et al. Cell cultivation on porous titanium implants with various structures. Cell Tissue Biol. 2010;4:572–579. | ||
Pitkin M, Cassidy C, Muppavarapu R, et al. New method of fixation of in-bone implanted prosthesis. J Rehabil Res Dev. 2013;50:709–722. | ||
Shevtsov MA, Yudintceva N, Blinova M, et al. Application of the skin and bone integrated pylon with titanium oxide nanotubes and seeded with dermal fibroblasts. Prosthet Orthot Int. 2015;39:477–486. | ||
Price RL, Gutwein LG, Kaledin L, Tepper F, Webster TJ. Osteoblast function on nanophase alumina materials: influence of chemistry, phase, and topography. J Biomed Mater Res A. 2003;67:1284–1293. | ||
Tiwari JN, Tiwari RN, Kim KS. Zero-dimensional, one-dimensional, two-dimensional and three-dimensional nanostructured materials for advanced electrochemical energy devices. Prog Mater Sci. 2012;57:724–803. | ||
Pokropivny VV, Skorokhod VV. Classification of nanostructures by dimensionality and concept of surface forms engineering in nanomaterials science. Mater Sci Eng C. 2007;27:990–993. | ||
Shen J, Liu J, Chen X, Wang X, He F, Wang H. The in vivo bone response of ultraviolet-irradiated titanium implants modified with spontaneously formed nanostructures: an experimental study in rabbits. Int J Oral Maxillofac Implants. 2016;31:776–784. | ||
Dang Y, Zhang L, Song W, et al. In vivo osseointegration of Ti implants with a strontium-containing nanotubular coating. Int J Nanomedicine. 2016;11:1003–1011. | ||
Zhao X, Wang T, Qian S, Liu X, Sun J, Li B. Silicon-doped titanium dioxide nanotubes promoted bone formation on titanium implants. Int J Mol Sci. 2016;17:292. | ||
Seidling R, Lehmann LJ, Lingner M, Mauermann E, Obertacke U, Schwarz ML. Analysis of the osseointegrative force of a hyperhydrophilic and nanostructured surface refinement for TPS surfaces in a gap healing model with the Göttingen minipig. J Orthop Surg Res. 2016;11:119. | ||
Rosa AL, Kato RB, Castro Raucci LM, et al. Nanotopography drives stem cell fate toward osteoblast differentiation through α1β1 integrin signaling pathway. J Cell Biochem. 2014;115:540–548. | ||
Dalby MJ, Gadegaard N, Oreffo RO. Harnessing nanotopography and integrin-matrix interactions to influence stem cell fate. Nat Mater. 2014;13:558–569. | ||
Metavarayuth K, Sitasuwan P, Zhao X, Lin Y, Wang Q. Influence of surface topographical cues on the differentiation of mesenchymal stem cells in vitro. ACS Biomater Sci Eng. 2016;2:142–151. | ||
Orr AW, Helmke BP, Blackman BR, Schwartz MA. Mechanisms of mechanotransduction. Dev Cell. 2006;10:11–20. | ||
Park S, Im GI. Stem cell responses to nanotopography. J Biomed Mater Res A. 2015;103:1238–1245. | ||
Mashinchian O, Turner LA, Dalby MJ, et al. Regulation of stem cell fate by nanomaterial substrates. Nanomedicine (Lond). 2015;10:829–847. | ||
McNamara LE, Burchmore R, Riehle MO, et al. The role of microtopography in cellular mechanotransduction. Biomaterials. 2012;33:2835–2847. | ||
Tsimbouri PM, McMurray RJ, Burgess KV, et al. Using nanotopography and metabolomics to identify biochemical effectors of multipotency. ACS Nano. 2012;6:10239–10249. | ||
de Peppo GM, Agheli H, Karlsson C, et al. Osteogenic response of human mesenchymal stem cells to well-defined nanoscale topography in vitro. Int J Nanomedicine. 2014;9:2499–2515. | ||
Kaur G, Valarmathi MT, Potts JD, Jabbari E, Sabo-Attwood T, Wang Q. Regulation of osteogenic differentiation of rat bone marrow stromal cells on 2D nanorod substrates. Biomaterials. 2010;31:1732–1741. | ||
Yang J, McNamara LE, Gadegaard N, et al. Nanotopographical induction of osteogenesis through adhesion, bone morphogenic protein cosignaling, and regulation of microRNAs. ACS Nano. 2014;8:9941–9953. | ||
Lavenus S, Berreur M, Trichet V, Pilet P, Louarn G, Layrolle P. Adhesion and osteogenic differentiation of human mesenchymal stem cells on titanium nanopores. Eur Cell Mater. 2011;22:84–96. | ||
Sjöström T, Dalby MJ, Hart A, Tare R, Oreffo RO, Su B. Fabrication of pillar-like titania nanostructures on titanium and their interactions with human skeletal stem cells. Acta Biomater. 2009;5:1433–1441. | ||
Li G, Cao H, Zhang W, et al. Enhanced osseointegration of hierarchical micro/nanotopographic titanium fabricated by microarc oxidation and electrochemical treatment. ACS Appl Mater Interfaces. 2016;8:3840–3852. | ||
Chen N, Shi X, Witte R, et al. A novel Ti-based nanoglass composite with submicron–nanometer-sized hierarchical structures to modulate osteoblast behaviors. J Mater Chem B. 2013;1:2568–2574. | ||
Rupp F, Scheideler L, Olshanska N, de Wild M, Wieland M, Geis-Gerstorfer J. Enhancing surface free energy and hydrophilicity through chemical modification of microstructured titanium implant surfaces. J Biomed Mater Res A. 2006;76:323–334. | ||
Huang Q, Liu X, Elkhooly TA, Zhang R, Shen Z, Feng Q. A novel titania/calcium silicate hydrate hierarchical coating on titanium. Colloids Surf B Biointerfaces. 2015;134:169-177. | ||
Smirnov VM. Nanoscaled structuring as a way to constructing new solid substances and materials. Russ J Gen Chem. 2002;72:590–606. | ||
Zemtsova EG, Arbenin AY, Plotnikov AF, Smirnov VM. Pore radius fine tuning of a silica matrix (MCM-41) based on the synthesis of alumina nanolayers with different thicknesses by atomic layer deposition. J Vac Sci Technol A. 2015;33:021519:1–021519:6. | ||
Wang X, Yushin G. Chemical vapor deposition and atomic layer deposition for advanced lithium ion batteries and supercapacitors. Energy Environ Sci. 2015;8:1889–1904. | ||
Zemtsova EG, Morozov PE, Smirnov VM. Regulation of surface topography of nanostructured titanium using the method of ML–ALD to create bioactive nanocoatings. Mater Phys Mech. 2015;24:374–381. | ||
Niu W, Li X, Karuturi SK, et al. Applications of atomic layer deposition in solar cells. Nanotechnology. 2015;26:064001:1–064001:13. | ||
Valiev RZ, Langdon TG. Principles of equal-channel angular pressing as a processing tool for grain refinement. Prog Mater Sci. 2006;51:881–981. | ||
Smirnov VM, Zemtsova EG, Morozov PE. Forced organization of magnetic quasi-one-dimensional iron-organic nanostructures on inorganic matrices. Rev Adv Mat Sci. 2009;21:205–210. | ||
Chatakun P, Núñez-Toldrà R, Díaz López EJ, et al. The effect of five proteins on stem cells used for osteoblast differentiation and proliferation: a current review of the literature. Cell Mol Life Sci. 2014;71:113–142. | ||
Li J, Zhang H, Yang C, Li Y, Dai Z. An overview of osteocalcin progress. J Bone Miner Metab. 2016;34:367–379. | ||
Chapurlat RD, Confavreux CB. Novel biological markers of bone: from bone metabolism to bone physiology. Rheumatology (Oxford). 2016;55:1714–1725. | ||
Pujari-Palmer M, Pujari-Palmer S, Lu X, et al. Pyrophosphate stimulates differentiation, matrix gene expression and alkaline phosphatase activity in osteoblasts. PLoS One. 2016;11:e0163530. | ||
Sul YT. Electrochemical growth behavior, surface properties, and enhanced in vivo bone response of TiO2 nanotubes on microstructured surfaces of blasted, screw-shaped titanium implants. Int J Nanomedicine. 2010;5:87–100. | ||
Zemtsova EG, Arbenin AY, Valiev RZ, Orekhov EV, Semenov VG, Smirnov VM. Two-level micro-to-nanoscale hierarchical TiO2 nanolayers on titanium surface. Materials. 2016;9(12):pii:E1010. | ||
Owen TA, Aronow M, Shalhoub V, et al. Progressive development of the rat osteoblast phenotype in vitro: reciprocal relationships in expression of genes associated with osteoblast proliferation and differentiation during formation of the bone extracellular matrix. J Cell Physiol. 1990;143:420–430. | ||
Tran PA, Fox K, Tran N. Novel hierarchical tantalum oxide-PDMS hybrid coating for medical implants: one pot synthesis, characterization and modulation of fibroblast proliferation. J Colloid Interface Sci. 2017;485:106–115. | ||
Yun K, Kang S, Oh G, et al. Histological evaluation of nano-micro titanium implant surface treatment in beagle humerus. J Nanosci Nanotechnol. 2016;16:1887–1889. | ||
Wang JR, Ahmed SF, Gadegaard N, Meek RMD, Dalby MJ, Yarwood JS. Nanotopology potentiates growth hormone signalling and osteogenesis of mesenchymal stem cells. Growth Horm IGF Res. 2014;24:245–250. | ||
Yang J, McNamara LE, Gadegaard N, et al. Nanotopographical induction of osteogenesis through adhesion, bone morphogenic protein cosignaling, and regulation of microRNAs. ACS Nano. 2014;8:9941–9953. | ||
Gurzawska K, Svava R, Jørgensen NR, Gotfredsen K. Nanocoating of titanium implant surfaces with organic molecules. Polysaccharides including glycosaminoglycans. J Biomed Nanotechnol. 2012;8:1012–1024. | ||
Choi JY, Jung UW, Kim CS, Jung SM, Lee IS, Choi SH. Influence of nanocoated calcium phosphate on two different types of implant surfaces in different bone environment: an animal study. Clin Oral Implants Res. 2013;24:1018–1022. | ||
Wang T, Wan Y, Liu Z. Synergistic effects of bioactive ions and micro/nano-topography on the attachment, proliferation and differentiation of murine osteoblasts (MC3T3). J Mater Sci Mater Med. 2016;27:133. | ||
Kim GH, Kim IS, Park SW, et al. Evaluation of Osteoblast-Like Cell Viability and Differentiation on the Gly-Arg-Gly-Asp-Ser Peptide Immobilized Titanium Dioxide Nanotube via Chemical Grafting. J Nanosci Nanotechnol. 2016;16:1396–1399. | ||
Deng Y, Sun Y, Bai Y, et al. In vitro biocompability/osteogenesis and in vivo bone formation evalution of peptide-decorated apatite nanocomposites assisted via polydopamine. J Biomed Nanotechnol. 2016;12:602–618. | ||
Hunziker EB, Jovanovic J, Horner A, Keel MJ, Lippuner K, Shintani N. Optimisation of BMP-2 dosage for the osseointegration of porous titanium implants in an ovine model. Eur Cell Mater. 2016;32:241–256. | ||
Min J, Choi KY, Dreaden EC, et al. Designer dual therapy nanolayered implant coatings eradicate biofilms and accelerate bone tissue repair. ACS Nano. 2016;10:4441–4450. |
Supplementary material
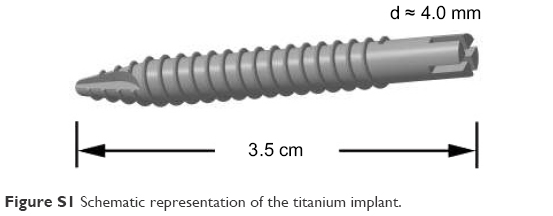 | Figure S1 Schematic representation of the titanium implant. |
 © 2018 The Author(s). This work is published and licensed by Dove Medical Press Limited. The
full terms of this license are available at https://www.dovepress.com/terms
and incorporate the Creative Commons Attribution
- Non Commercial (unported, 3.0) License.
By accessing the work you hereby accept the Terms. Non-commercial uses of the work are permitted
without any further permission from Dove Medical Press Limited, provided the work is properly
attributed. For permission for commercial use of this work, please see paragraphs 4.2 and 5 of our Terms.
© 2018 The Author(s). This work is published and licensed by Dove Medical Press Limited. The
full terms of this license are available at https://www.dovepress.com/terms
and incorporate the Creative Commons Attribution
- Non Commercial (unported, 3.0) License.
By accessing the work you hereby accept the Terms. Non-commercial uses of the work are permitted
without any further permission from Dove Medical Press Limited, provided the work is properly
attributed. For permission for commercial use of this work, please see paragraphs 4.2 and 5 of our Terms.