Back to Journals » Pharmacogenomics and Personalized Medicine » Volume 8
Immune cell-based screening assay for response to anticancer agents: applications in pharmacogenomics
Authors Frick A, Fedoriw Y, Richards K, Damania B, Parks B, Suzuki O, Benton C, Chan E, Thomas R, Wiltshire T
Received 27 August 2014
Accepted for publication 8 October 2014
Published 26 February 2015 Volume 2015:8 Pages 81—98
DOI https://doi.org/10.2147/PGPM.S73312
Checked for plagiarism Yes
Review by Single anonymous peer review
Peer reviewer comments 3
Editor who approved publication: Dr Martin Bluth
Amber Frick,1 Yuri Fedoriw,2 Kristy Richards,3,4 Blossom Damania,3,5 Bethany Parks,6 Oscar Suzuki,1 Cristina S Benton,1 Emmanuel Chan,1 Russell S Thomas,7 Tim Wiltshire1,3
1Division of Pharmacotherapy and Experimental Therapeutics, Eshelman School of Pharmacy, 2Department of Pathology and Laboratory Medicine, School of Medicine, 3Lineberger Comprehensive Cancer Center, School of Medicine, 4Department of Genetics, School of Medicine, 5Department of Microbiology and Immunology, School of Medicine, University of North Carolina, Chapel Hill, NC, USA; 6The Hamner Institutes for Health Sciences, 7Environmental Protection Agency, Research Triangle Park, NC, USA
Background: Interpatient variability in immune and chemotherapeutic cytotoxic responses is likely due to complex genetic differences and is difficult to ascertain in humans. Through the use of a panel of genetically diverse mouse inbred strains, we developed a drug screening platform aimed at examining interstrain differences in viability on normal, noncancerous immune cells following chemotherapeutic cytotoxic insult. Drug effects were investigated by comparing selective chemotherapeutic agents, such as BEZ-235 and selumetinib, against conventional cytotoxic agents targeting multiple pathways, including doxorubicin and idarubicin.
Methods: Splenocytes were isolated from 36 isogenic strains of mice using standard procedures. Of note, the splenocytes were not stimulated to avoid attributing responses to pathways involved with cellular stimulation rather than toxicity. Cells were incubated with compounds on a nine-point logarithmic dosing scale ranging from 15 nM to 100 µM (37°C, 5% CO2). At 4 hours posttreatment, cells were labeled with antibodies and physiological indicator dyes and fixed with 4% paraformaldehyde. Cellular phenotypes (eg, viability) were collected and analyzed using flow cytometry. Dose-response curves with response normalized to the zero dose as a function of log concentration were generated using GraphPad Prism 6.
Results: Phenotypes were quantified using flow cytometry, yielding interstrain variation for measured endpoints in different immune cells. The flow cytometry assays produced over 16,000 data points that were used to generate dose-response curves. The more targeted agents, BEZ-235 and selumetinib, were less toxic to immune cells than the anthracycline agents. The calculated heritability for the viability of immune cells was higher with anthracyclines than the novel agents, making them better suited for downstream genetic analysis.
Conclusion: Using this approach, we identify cell lines of variable sensitivity to chemotherapeutic agents and aim to identify robust, replicable endpoints of cellular response to drugs that provide the starting point for identifying candidate genes and cellular toxicity pathways for future validation in human studies.
Keywords: immunomodulation, cytotoxicity, chemotherapy, precision medicine
Introduction
While the role of the immune system in cancer development is well established, its role in response to chemotherapeutic agents remains more elusive. Recent studies have demonstrated that several cytotoxic chemotherapeutics work in concert with the immune system.1 These immunomodulatory effects may occur through direct action on tumor cells or on cells of the immune system.2,3 For example, anthracyclines and oxaliplatin generate immunogenic responses via induction of calreticulin on tumor cells, an action necessary for the therapeutic efficacy of these agents.4,5 Additionally, docetaxel has been reported to modulate CD4+, CD8+, CD19+, natural killer T-cells, and T-regulatory populations in nontumor-bearing mice.6,7 This immunomodulation acts synergistically with chemotherapeutic cytotoxic effects and has been shown to improve outcomes following treatment.8–10 For instance, increased amounts of pretreatment tumor infiltrating lymphocytes and posttreatment immune activation have been linked to better outcomes in patients with breast and colorectal cancer.11 In patients who are unable to elicit an immune response following traditional cytotoxic chemotherapy, the use of immunomodulatory drugs has been suggested. Thus, optimal tumor therapies may be those that achieve synergy with cytotoxicity and immunomodulation.6,12
Previous studies have noted intersubject variability in immune and chemotherapy-induced cytotoxic responses, partly due to genetic differences.13–15 The role of pharmacogenomics in cytotoxicity of the innate immune system has perhaps been more rigorously studied because complications such as neutropenia may result, leading to potentially deadly consequences such as infection or dose reduction. For instance, fluorouracil and mercaptopurine may cause more severe neutropenia in individuals with genetic polymorphisms in dihydropyrimidine dehydrogenase or inosine triphosphate pyrophosphatase, respectively.16,17 However, the role of pharmacogenomics in cytotoxicity of the adaptive immune system requires further investigation, as both synergy and drug-induced toxicities have been observed with regard to the effects of chemotherapy agents on the immune system.
The effects of chemotherapy agents in the normal immune system are hard to quantify in humans. We therefore developed a drug-screening platform using genetically diverse inbred mouse strains to examine novel mechanisms underlying interstrain, chemotherapy-induced cytotoxic responses on functional immune cells. Murine splenocytes were isolated from a panel of genetically diverse mouse inbred strains, in which genotypes have been well characterized. This in vitro mouse model has the additional benefits of maintaining tight experimental control, while circumventing the use of cytotoxic agents in humans and enabling an interrogation of the genetic components of cytotoxicity in the context of a normal functioning immune system.18,19 In the present study, cellular health phenotypes (ie, viability, caspase-3/7 activation, and mitochondrial health) were quantified from these primary mouse splenocytes using flow cytometry, yielding interstrain variation for measured endpoints in different immune cells (ie, T-cells, B-cells, monocytes, and granulocytes). Effects were investigated by comparing more selective chemotherapeutic agents, including a dual PI3K/mTOR inhibitor and a MEK inhibitor, against conventional cytotoxic, immunomodulatory anthracycline agents, including doxorubicin and idarubicin. BEZ-235 and selumetinib are currently in clinical trials,20 and dual PI3K/mTOR and MEK inhibition provides broad antitumor activity in mouse models.21 These drugs have the potential to be used in regimens including doxorubicin and idarubicin for the treatment of solid and hematological tumors,20 and these targeted agents have been reported to have potential immunomodulatory effects. For instance, selumetinib has been shown to inhibit the release of cytokines, including IL-1, IL-6, and TNF,22 and BEZ-235 is under investigation for enhancing the immune response to vaccination per the World Health Organization International Clinical Trials Registry Platform.23 In clinical trials, these drugs have greatly reduced side effects (eg, rash, fatigue, diarrhea, and peripheral edema) in comparison to traditional cytotoxic agents.24,25 By using these phenotypes, genes and genetic pathways that underlie or modulate the variable toxicity responses of functional immune cells to chemotherapeutics can potentially be identified.
Materials and methods
Animals
Thirty-six male inbred mouse strains (129S1/SvImJ, 129X1/SvJ, A/J, AKR/J, BALB/cByJ, BTBR T+ Itpr3tf/J, BUB/BnJ, C3H/HeJ, C57BLKS/J, C57BL/6J, C57BR/cdJ, C58/J, CBA/J, CZECHII/EiJ, DBA/2J, FVB/NJ, I/LnJ, KK/HiJ, LG/J, LP/J, MA/MyJ, NOD/LtJ, NON/LtJ, NZB/BINJ, NZO/HiLtJ, NZW/LacJ, PERA/EiJ, PL/J, PWD/PhJ, PWK/PhJ, RIIIS/J, SEA/GnJ, SJL/J, SM/J, SWR/J, and WSB/EiJ), aged 10–12 weeks, were obtained from The Jackson Laboratory (Bar Harbor, ME, USA). This panel of isogenic mice was chosen based on priority strains from the Mouse Diversity Panel.26 Four mice were used per strain. Male mice were housed four per cage in polycarbonate cages on a 12-hour light/dark cycle (lights on at 7 am), with access to food and water ad libitum. All procedures were approved by the Institutional Animal Care and Use Committee and followed the guidelines set forth by the National Institutes of Health (NIH) Guide for the Care and Use of Laboratory Animals.
Tissue preparation
Following cervical dislocation, spleens were excised from the mice, and cells obtained from tissues were dissociated into a single-cell suspension by mechanical means (ie, homogenized in phosphate-buffered saline [PBS] [Cellgro, Manassas, VA, USA] with 1% v/v fetal bovine serum [FBS] [Gibco, Grand Island, NY, USA]) using frosted glass slides (Thermo Fisher Scientific, Pittsburgh, PA, USA) in a tissue culture dish (TPP, Trasadingen, Switzerland). Cells were transferred from the tissue culture dish to a 5 mL polystyrene round-bottom tube (BD Biosciences, San Jose, CA, USA), centrifuged at 400× g for 5 minutes, resuspended in ammonium-chloride-potassium lysing buffer (Gibco) to avoid red blood cell interference during flow cytometry, and incubated for 10 minutes at room temperature in the dark. Cells were centrifuged at 400× g for 5 minutes and resuspended in RPMI-1640 buffer (Cellgro) supplemented with 10% v/v FBS, 0.1% v/v 2-mercaptoethanol (MP Biomedicals, Santa Ana, CA, USA), 1% v/v sodium pyruvate, 1% v/v nonessential amino acids, and 1% v/v penicillin G/streptomycin solution (all from Cellgro). Cells were aliquoted into 96-well, round-bottom plates (Globe Scientific Inc., Paramus, NJ, USA) at a density of 100,000 cells per mL.
Drug treatment
A volume of 100 μL per well of cells in supplemented media were incubated at 37°C and 5% CO2 with doxorubicin (Sigma-Aldrich, Milwaukee, WI, USA), idarubicin (Sigma-Aldrich), BEZ-235 (provided by Novartis, Inc.), or selumetinib (ChemieTek, Indianapolis, IN, USA). Each compound was plated using a nine-point logarithmic concentration scale ranging from 15 nM to 100 μM. Stock solutions of doxorubicin and idarubicin (10 mM) were prepared in water while stock solutions of BEZ-235 and selumetinib (25 mM and 75 mM, respectively) were prepared in 100% dimethyl sulfoxide (DMSO) (Sigma-Aldrich). Subsequent dilutions and controls were prepared to account for the inclusion of water or DMSO in the stock solution.
Cell labeling
At 4 hours posttreatment, cells were washed in wash buffer (PBS with 1% v/v FBS) and incubated for 30 minutes at 37°C and 5% CO2 with the following physiological indicator dyes: 125 nM Mitotracker® Deep Red (Invitrogen, Carlsbad, CA, USA) for mitochondrial health, 3.75 μM CellEvent™ caspase-3/7 green detection reagent (Invitrogen) for caspase-3/7 activation, and 3.75 μL (0.19 μg) 7-AAD (BD Biosciences) per 100 μL well for viability. The Mitotracker® Deep Red is a mitochondrion-selective stain that is concentrated by active mitochondria and is well retained during cell fixation and permeabilization due to a mildly thiol-reactive chloromethyl moiety. The CellEvent™ caspase-3/7 green detection reagent consists of a four amino acid peptide conjugated to a nucleic acid binding dye that is nonfluorescent until the peptide is cleaved by caspase-3/7. 7-AAD is a fluorescent intercalator that undergoes a spectral shift when associated with DNA.27 Cells were centrifuged at 400× g for 5 minutes, washed, and incubated at 4°C with cell indicator antibodies including 0.05 μg V500 Syrian hamster anti-mouse CD-3e per 100 μL well for T-cells, 0.1 μg APC-H7 rat anti-mouse CD-19 per 100 μL well for B-cells, 0.1 μg V450 rat anti-mouse CD-11b per 100 μL well for monocytes, and 0.1 μg PE-Cy7 rat anti-mouse Ly-6G per 100 μL well for granulocytes (all antibodies were obtained from BD Biosciences). These antibodies detect immune function cells in the spleen, and they can also be used to detect cells of interest in additional tissues such as bone marrow or peripheral blood. Cells were centrifuged at 400× g for 5 minutes, washed, and fixed with 4% paraformaldehyde (Thermo Fisher Scientific) for 15 minutes at room temperature.
Flow cytometry
Samples were analyzed on a FACSCanto II flow cytometer (BD Biosciences) equipped with three lasers (405 nm, 488 nm, and 640 nm). For each sample, 10,000 events were collected with the flow cytometer. Data were analyzed with FlowJo version X (TreeStar, Ashland, OR, USA). The cellular populations of interest were well discriminated by forward scatter and side scatter properties. An unstained control was used to determine the threshold for samples positive for particular markers, facilitating gating as appropriate. After detection of the immune cell populations of interest (ie, B-cells, T-cells, monocytes, and granulocytes), the cells positive for Mitotracker® Deep Red, activated caspase-3/7, or 7-AAD in each subpopulation were determined.
Statistical analysis
Dose-response curves with response normalized to the zero dose as a function of log concentration were generated using GraphPad Prism 6 (La Jolla, CA, USA). All graphed results were expressed as mean ± standard error of the mean. Half maximal inhibitory concentration (IC50) values, slope coefficients, and area under the curve (AUC) values were obtained using a four-parameter logistical model (ie, Hill equation) per NIH guidance28 and Pharsight® WinNonlin® 5.2 (Certara®, Mountain View, CA, USA). The Hill equation is

where Max is the maximum asymptote, Min is the minimum asymptote, γ is the Hill slope, and x is the drug concentration.29 Additional statistical analyses, including Pearson correlations, were performed with SAS (Cary, NC, USA), with P<0.05 considered to be statistically significant. Pearson correlations were performed to determine the relatedness between phenotypes rather than individual strains30,31 and the relatedness between metrics.32 Heritability or the percent of variability likely due to genetics was calculated comparing intra and interstrain variation in percent viability. The proportion of phenotype variation attributable to genetics was estimated with broad-sense heritability. Intrastrain correlations were estimated by,

where r1 is the intrastrain correlation estimate, MSB is the mean square of the between-strain comparison, MSW is the mean square of the within-strain correlation, and n is the number of animals per strain.33
Results
An overview of the assay methodology is presented in Figure 1, including spleen isolation (Figure 1A), spleen homogenization (Figure 1B), incubation with drugs and multiplexed assay conditions (Figure 1C), flow cytometry (Figure 1D), and generation of dose-response curves (Figure 1E). Splenocytes were isolated and cultured using standard methods. However, the assay was optimized in terms of culture conditions and media to best maintain cellular health under normal conditions. For instance, splenocyte and immune subpopulation viability was compared following incubation in supplemented Dulbecco’s Modified Eagle’s Medium, Iscove’s Modified Dulbecco’s Medium, and RPMI media. In particular, B-cell sensitivity limited the drug incubation time to 4 hours within the assay (data not shown). Splenocytes were not stimulated to avoid confounding cellular differentiation responses with toxicity responses, as phenotypic and genetic responses associated with chemotherapy-induced toxicity could otherwise be attributed to cellular stimulation. The cell-type composition of cultured cell populations potentially differs from cells freshly isolated and immediately analyzed via flow cytometry. However, analysis shows that our cultured assays are consistent in composition with freshly isolated splenocytes and cellular subpopulations (ie, B-cells, monocytes, and granulocytes) when compared to murine spleen cell composition in the Mouse Phenome Database (MPD: Jaxpheno6) (Figure S1) using t-tests with P<0.05 considered statistically significant.34 Our data are also deposited in the Mouse Phenome Database at the Jackson Laboratory (MPD: Wiltshire4).35
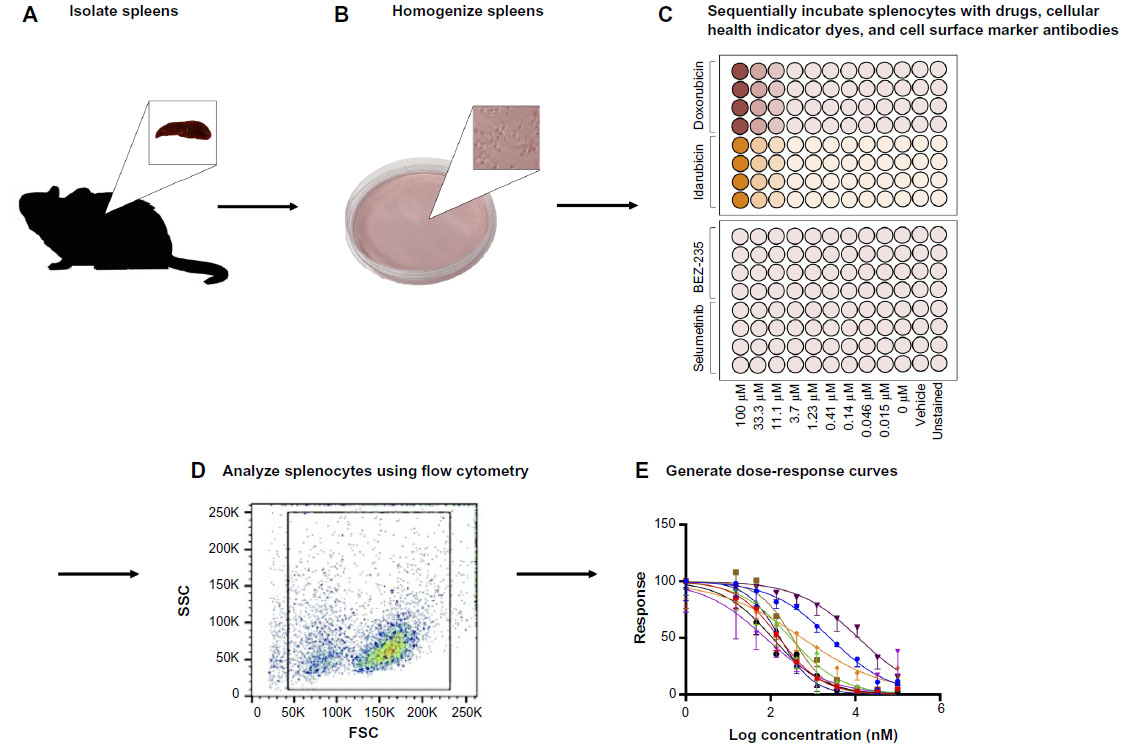 | Figure 1 Assay methodology overview. |
We developed a multiplexed flow cytometry assay (Table 1) to measure the health of multiple immune cell populations following exposure to anticancer agents. Further refined cell subpopulations can be examined in additional screens. The commercial availability of cellular health indicator dyes limited the fluorescent channels accessible for antibody-conjugated fluorochromes. Thus, the brightest fluorochromes were reserved for antibodies targeting less prevalent cell surface markers. Dyes were selected based on the ability to be fixed and their representation of various cellular health parameters important in early and late apoptosis and necrosis.27 Dyes and antibody-conjugated fluorochromes were titrated and compensated during flow cytometry analysis to reduce spectral overlap.36,37 Generous gates were applied to the plots to capture phenotypes from less viable cells following exposure to various concentrations of antilymphoma compounds. The gating strategy is presented in Figure 2, with the following populations represented: splenocytes (Figure 2A), CD-19+ B-cells (Figure 2B), CD-3e+ T-cells (Figure 2C), CD-11b+ monocytes (Figure 2D), Ly-6G+ granulocytes (Figure 2E), viable cells (Figure 2F), caspase-3/7 positive cells (Figure 2G), Mitotracker® Deep Red positive cells (Figure 2H), and, when applicable, anthracycline positive cells (Figure 2I).
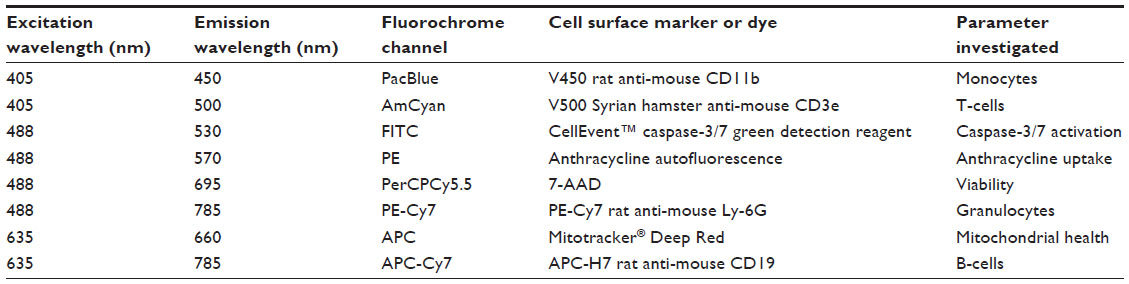 | Table 1 Multiparameter flow cytometry assay |
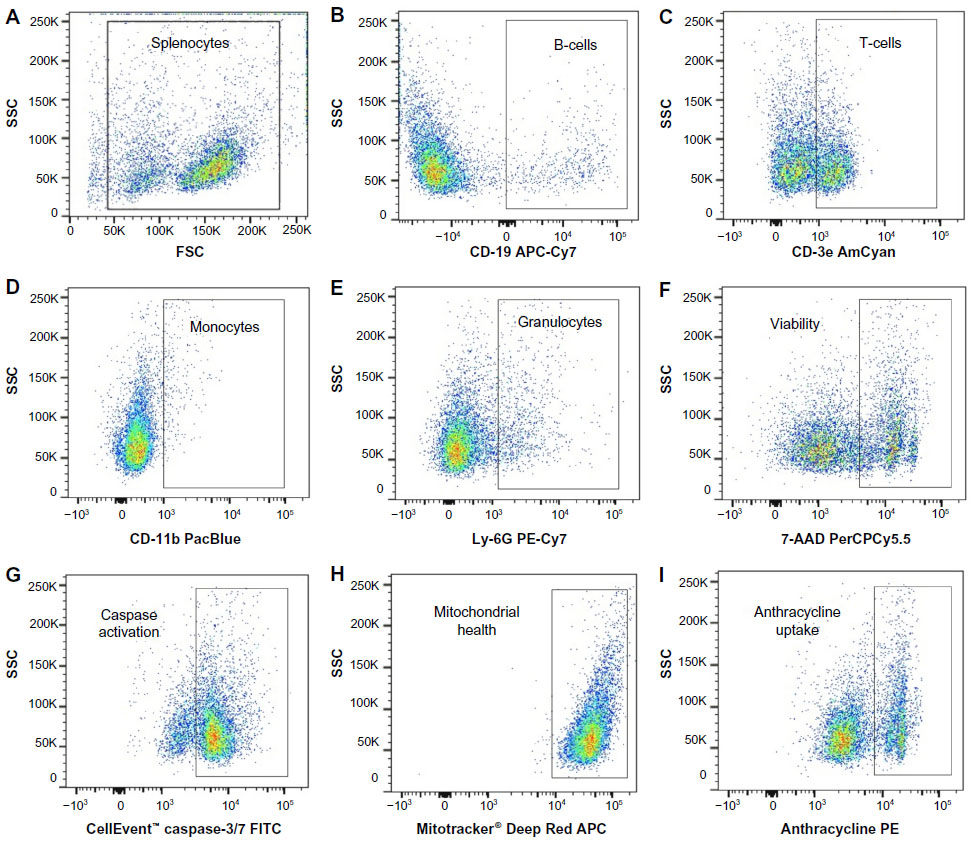 | Figure 2 Flow cytometry gating strategy. |
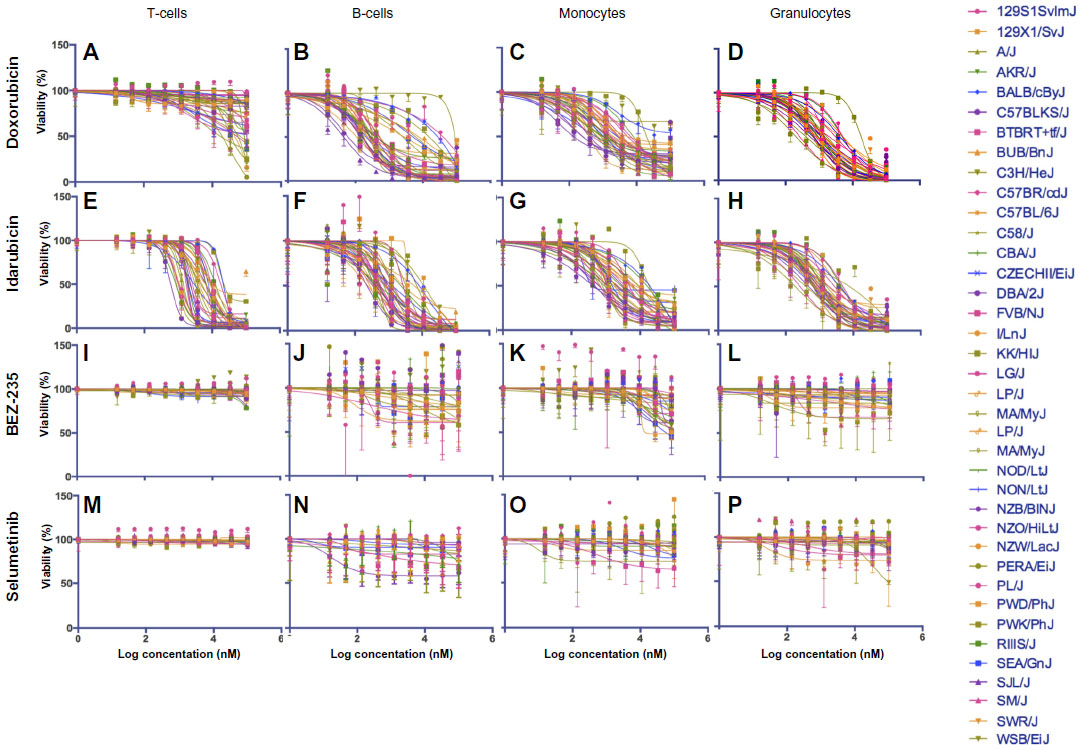
Dose-response curves of the percent viability of splenocyte cell subpopulations exposed to chemotherapeutic drugs from nine of 36 total strains are represented in Figure 3. These nine strains were chosen to enhance clarity of visualization and to display diversity across the various phenotypes. Dose-response curves were generated for these strains across all phenotypes. T-cells, B-cells, monocytes, and granulocytes, respectively, exposed to doxorubicin (Figure 3A–D), idarubicin (Figure 3E–H), BEZ-235 (Figure 3I–L), and selumetinib (Figure 3M–P) are represented. Corresponding phenotypes for all 36 strains are represented in Figure S2A–P. Over 16,000 viability measurements were collected for T-cells, B-cells, and monocytes exposed to different concentrations of these targeted and cytotoxic anticancer agents. Heritability results were also calculated for viability at individual drug concentrations (Table S1). As shown in Figure 3, all splenocyte immune cell subpopulations were less sensitive to the more selective mTOR/PI3K and MEK inhibitors than the anthracyclines. Interestingly, B-cells appear to be most sensitive to the effects of all anticancer agents while T-cells appear to be the least sensitive. For example, a paired t-test indicated that T-cells were less sensitive than B-cells to idarubicin (P<0.0001). T-cells appeared least sensitive to doxorubicin compared to other cell populations, with few strains reaching the IC50 at the highest concentration of 100 μM, a concentration that is higher than physiological maximum concentration (Cmax) values in humans. Furthermore, T-cells appear less sensitive and less variable to BEZ-235 and selumetinib than other cell populations, with larger error bars for individual viability points for B-cells, monocytes, and granulocytes than T-cells in Figure 3 and Figure S2 (of note, the scale of the axes is the same across all phenotypes). Also, viability does not decrease with increasing drug concentration. To demonstrate the replicability of the results, we selected a set of eight strains for confirmation experiments. The repeatability of this experiment is shown in Figure 4, using the most heritable phenotypes: T-cells exposed to idarubicin (Figure 4A) and B-cells exposed to doxorubicin (Figure 4B). In the second replicated experiment, interstrain variability to the anticancer agents was maintained, and the strain order for sensitivity was similar though not identical to the first experiment. For instance, the P-values for the Wilcoxon rank sum tests were >0.05 for these most heritable phenotypes, providing no compelling evidence that the replicate IC50 values from these eight strains differ from those of the original assay, although the small sample size provides reduced power to detect a difference.38 Also, the Spearman correlation of IC50 values for T-cells exposed to idarubicin was 0.75 (P=0.03) between the original and replicated mouse strains when the most variable strain 129S1/SvlmJ was removed. Although the strain order for drug sensitivity is unique between the anticancer agents and cell type, several strains repeatedly appear to be more sensitive (eg, C57BLKS/J and DBA/2J) or less sensitive (eg, BALB/cByJ, KK/HiJ, and WSB/EiJ) to the cytotoxic effects of the different anthracycline agents across cell type (Figure 5: T-cells exposed to idarubicin [Figure 5A], B-cells exposed to doxorubicin [Figure 5B], B-cells exposed to idarubicin [Figure 5C], monocytes exposed to doxorubicin [Figure 5D], and monocytes exposed to idarubicin [Figure 5E]).
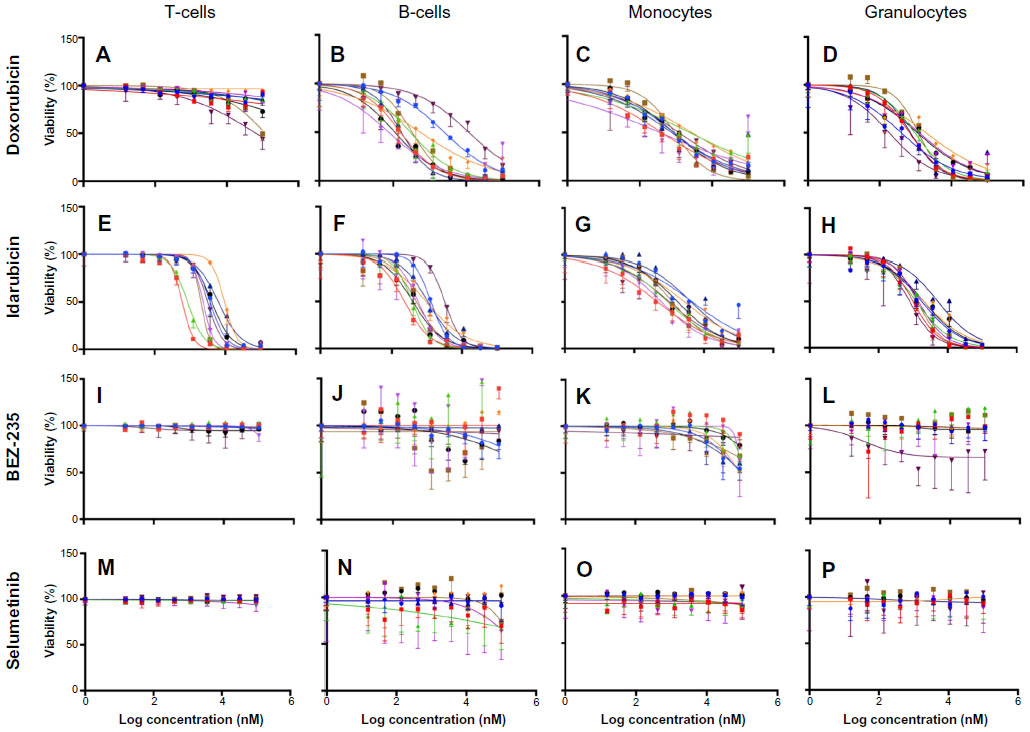 | Figure 3 Interstrain variation of viability across immune cell types and anticancer drugs. |
 , C57BLKS/J
  , CBA/J
  , DBA/2J
  , FVB/NJ
  , LP/J
  , NOD/LtJ
  , NZB/BINJ
  , and PWK/PhJ
  .
.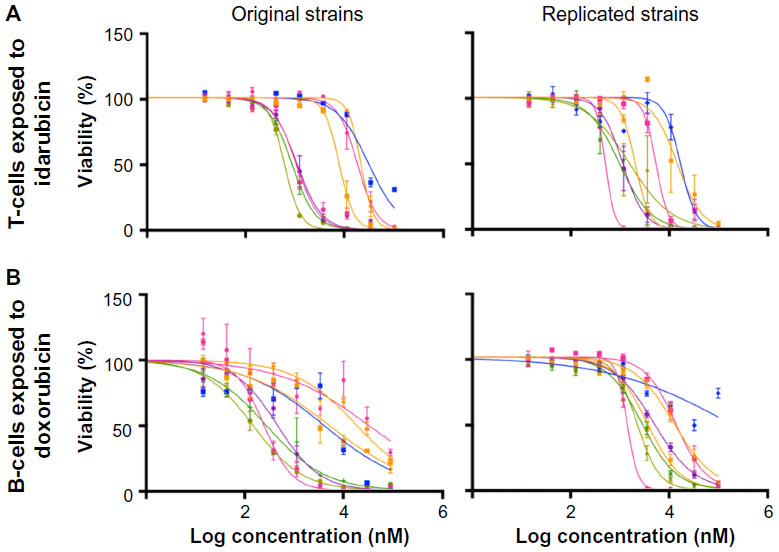 | Figure 4 Replicability of dose-response curves. |
 , BALB/cByJ
  , C57BLKS/J
  , CBA/J
  , KK/HiJ
  , LG/J
  , NZO/HiLtJ
  , and SEA/GnJ
  .
.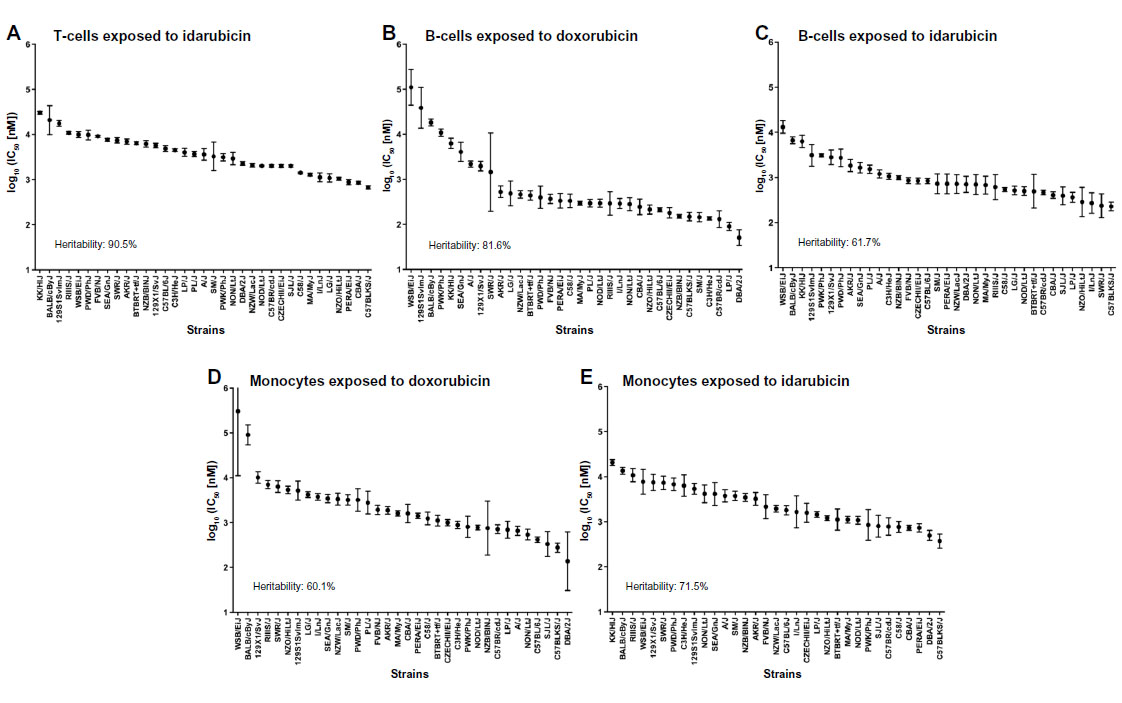 | Figure 5 Interstrain phenotype comparisons for log10 (IC50 [nM]). |
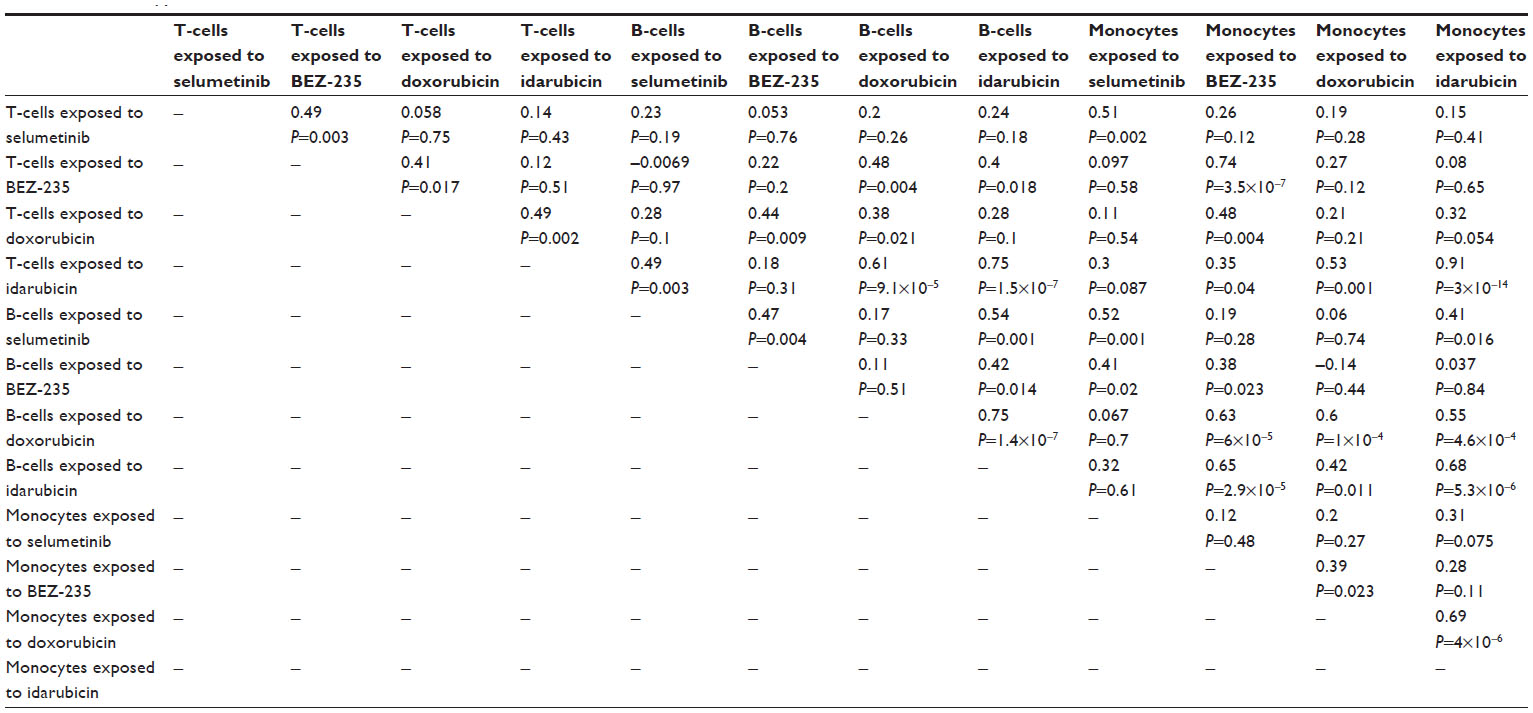
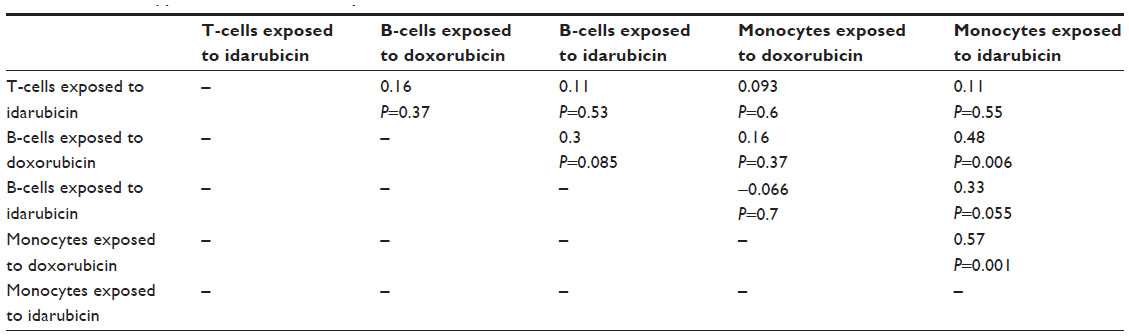
The interstrain variability within dose-response curves exposed to anthracyclines is more ideal for genetic analysis, and this is echoed in heritability calculations and differential log10 (IC50) values as shown in Figure 5. The relatively high heritability of the viability of T-cells exposed to idarubicin (90.5%) and B-cells exposed to doxorubicin (81.6%) makes these phenotypes most suitable to carry forward in future genetic studies. Pearson correlations in IC50 values between T-cells exposed to idarubicin, B-cells exposed to doxorubicin, B-cells exposed to idarubicin, monocytes exposed to doxorubicin, and monocytes exposed to idarubicin were statistically significant, indicating correlative effects of the different anthracycline agents on the immune cells (Table 2).
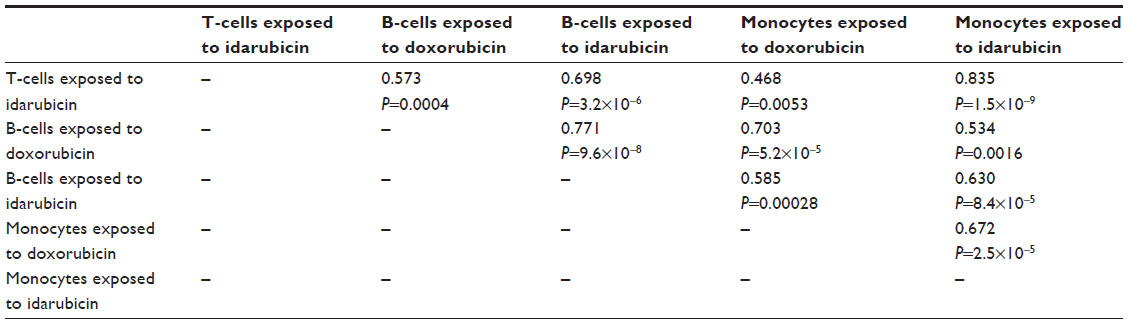 | Table 2 Phenotype correlations for log10 (IC50 [nM]) values across strains |
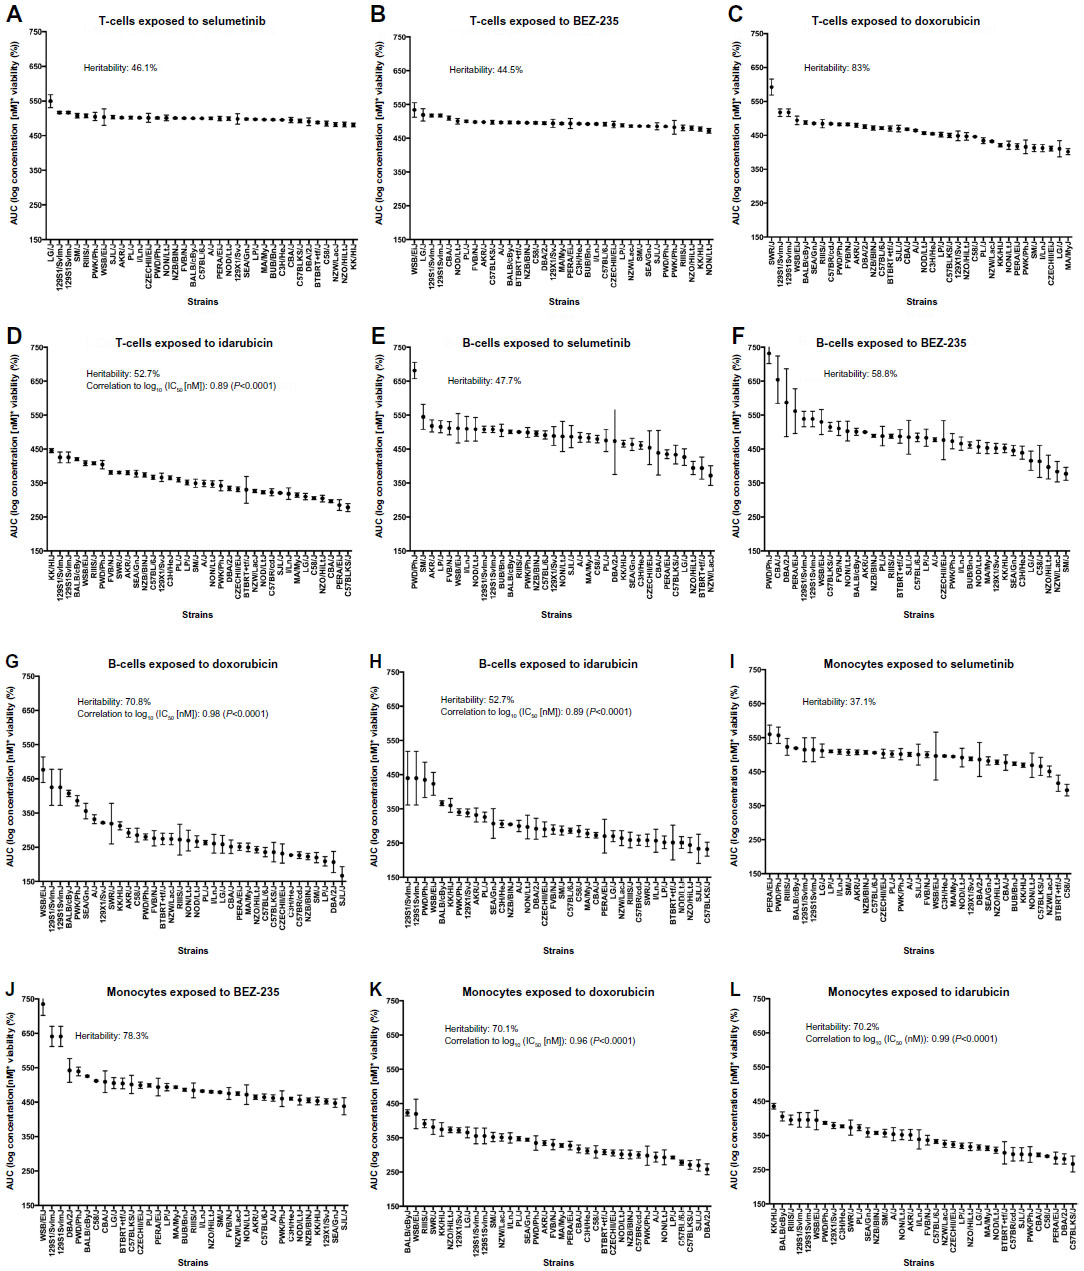
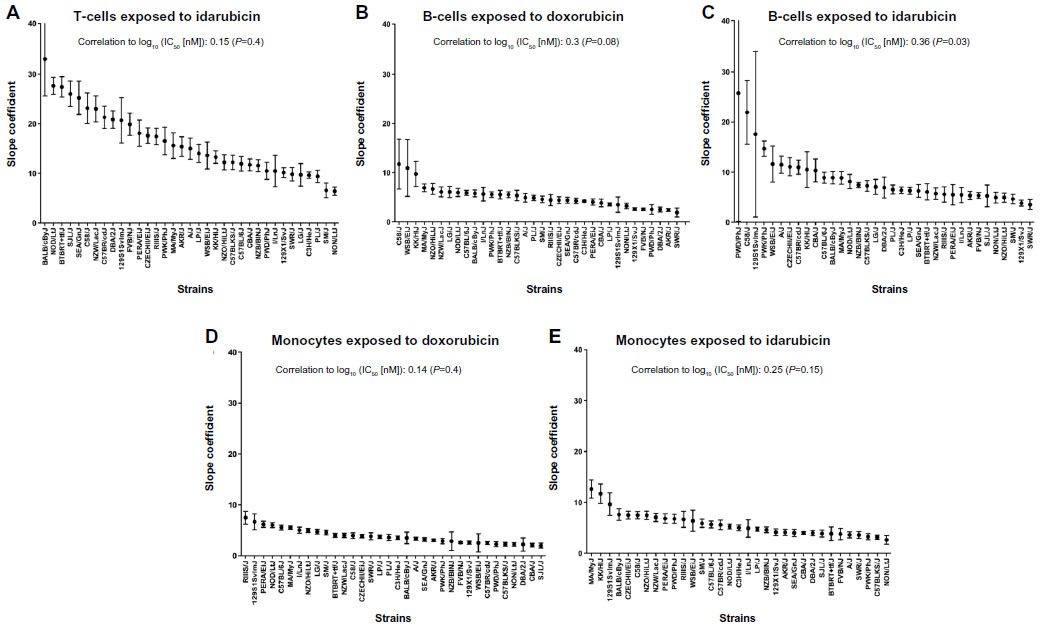
Because IC50 values were not always achieved in this screen, AUC values (Figure S3: T-cells exposed to selumetinib [Figure S3A], T-cells exposed to BEZ-235 [Figure S3B], T-cells exposed to doxorubicin [Figure S3C], T-cells exposed to idarubicin [Figure S3], B-cells exposed to selumetinib [Figure S3E], B-cells exposed to BEZ-235 [Figure S3F], B-cells exposed to doxorubicin [Figure S3G], B-cells exposed to idarubicin [Figure S3H], monocytes exposed to selumetinib [Figure S3I], monocytes exposed to BEZ-235 [Figure S3J], monocytes exposed to doxorubicin [Figure S3K], and monocytes exposed to idarubicin [Figure S3L]) and slope coefficients (Figure S4Figure S4A], B-cells exposed to doxorubicin [Figure S4B], B-cells exposed to idarubicin [Figure S4C], monocytes exposed to doxorubicin [Figure S4D], and monocytes exposed to idarubicin [Figure S4E]) were calculated for comparison when appropriate. The Pearson correlations of AUC to IC50 values when available were significant: T-cells exposed to idarubicin, 0.89 (P<0.0001); B-cells exposed to doxorubicin, 0.98 (P<0.0001); B-cells exposed to idarubicin, 0.89 (P<0.0001); monocytes exposed to doxorubicin, 0.96 (P<0.0001); and monocytes exposed to idarubicin, 0.99 (P<0.0001). However, heritability was comparatively reduced for AUC. In contrast, slope coefficients varied greatly from IC50 values. Also, the results of the Pearson’s correlation test for AUC (Table S2) and slope coefficients (Table S3) suggest reduced correlative anthracycline effects in these parameters.
Discussion
It has been predicted that the future of cancer treatment will involve precision medicine approaches combining targeted therapy or chemotherapies with immunomodulation.39 There is particular interest in the adaptive immune system as an additional “drug” in chemotherapeutic regimens due to its essential role in recognizing and eliminating tumor cells. However, tumor cells can adapt to evade immune surveillance, a characteristic acknowledged as an emerging hallmark of cancer.40 The importance of the adaptive immune system in cancer and treatment is reflected in recent therapeutic advances targeting cytotoxic T-lymphocyte antigen 4 and the programmed death 1 receptor and its ligands (PD-L1/2). These antibody therapeutics essentially reverse tumor inhibition of the adaptive immune system, leading to more favorable clinical outcomes.41
Although eliciting the adaptive immune response may be an effective means to recognize and eliminate tumor cells, this strategy may also present a risk as the immune-adjuvant effects of many cytotoxic compounds rely on antigen-presenting cells processing tumor antigens for T-cell recognition.2 For example, the anthracyclines are involved in immunomodulation by inducing calreticulin on tumor cells.4 Thus, the success of cytotoxic chemotherapy may depend on a delicate balance between preservation of the immune system and tumor cell death. Here, we used a wide concentration range for our compounds, a typical approach within toxicological studies and multiplexed drug screens in order to generate dose-response curves. For instance, a simulation of doxorubicin concentrations in women with breast cancer at the end of a 60 mg/m2 intravenous infusion (0.66 hour) calculated a plasma Cmax of approximately 1.3 μM in women with a body mass index <25.42 Following a 48-hour infusion of 70 mg/m2 idarubicin for consolidation therapy for metastatic breast cancer, the plasma Cmax was approximately 0.3 μM.43 Clinical trials to determine the pharmacokinetics of BEZ-235 and selumetinib are underway. However, at a dose of 50 mg/kg in PC3M tumor-bearing nude mice, the plasma Cmax of BEZ-235 was approximately 1.68 μM at 0.5 hour and 0.03 μM at 24 hours.44 Cell-based studies, including our assay, allow for greater resolution of drug response across a spectrum of concentrations rather than limited concentrations traditionally used in toxicology studies.28 In this assay, we are able to differentiate the variable cytotoxic response of different immune cells to anticancer agents, which will likely have applications in drug development and clinical settings. We identified strains with cell types universally more (eg, C57BLKS/J and DBA/2J) or less (eg, BALB/cByJ, KK/HiJ, and WSB/EiJ) sensitive to the cytotoxic effects of the anthracyclines. These strains may be useful for testing additional drugs in the future to gauge their toxicity on the immune system. T-cells were generally less sensitive to the effects of the anthracyclines, perhaps indicating that they are a favorable target for immunomodulating drugs and adaptive immune system stimulation in anticancer drug regimens. B-cells, on the other hand, appear to be more sensitive at lower concentrations of the drugs than T-cells. Similar differences in adaptive immune cell sensitivities to chemotherapeutic agents have been previously reported in patients.45 Because our data correspond to these findings, our screen across multiple strains of mice provides an interesting starting point as a model system for examining immune cell toxicity following exposure to anticancer agents.
A broad examination of chemotherapy-induced cytotoxic responses was elicited because the success of several chemotherapeutics requires interplay from a normal, functional immune system. Here, we focus on viability results obtained from broad splenic subpopulations of the adaptive immune system (ie, T- and B-cells) and monocytes exposed to various anticancer agents. In the spleen, B-cells promote both T-cell independent and dependent immune responses. The spleen redistributes T-cells to nonlymphoid tissue following antigen recognition. Splenic monocytes differentiate into macrophages and dendritic cells, which are antigen presenting cells and cellular components that act as liaisons between the innate and adaptive immune systems.46 Primary cells were also used in this study to innovatively examine the effects of anticancer agents on normal immune cells rather than cancerous or immortalized cells. The markers of caspase-3/7 activity and mitochondrial stress were not as mechanistically useful as viability. We could not detect interstrain differences in these parameters, and a large error indicated that our results were not very robustly replicable (data not shown). The viability parameter was most heritable, particularly among immune cells exposed to the anthracyclines, making viability the focus of our paper and future genetic analyses. Unfortunately, the lack of unique findings among our drugs and additional parameters at the doses used for our assay is a limitation of this screening process, where we focused on more generalized viability and mechanized endpoints. Ideally, this screening process should include biomarkers specific for drugs (eg, protein targets or gene expression changes) where we can identify change in response in a more concise approach.
A general, replicable screening approach was used in mice to examine the effects of cytotoxic and targeted agents on the viability of normal immune cells. To be able to maximize the use of this data and identify genetic components of phenotype differences, genome-wide association analysis requires sufficient diversity of both genotype and phenotype among individuals in a mapping population, and both of these traits are reflected in this experiment. A panel of 36 strains from the Jackson Laboratory’s Mouse Phenome Database Mouse Diversity Panel was selected to model genetic diversity, while phenotypic diversity was measured using IC50 values for viability in immune cells exposed to anthracycline agents. Importantly, this assay also identified heritable drug response phenotypes (60.1% to 90.5% for IC50 phenotypes), making it suitable for pharmacogenomic screening of anticancer effects on immune cells. Remarkably, the heritability for the anthracyclines was unexpectedly high, as multifactorial pathways of action may dilute phenotypic association to genetic components. Phenotypes generated from this approach will be used in genome-wide association studies to generate candidate genes, which may identify individuals more susceptible to immune system toxicity.47 We have identified loci of significance from our approach, but the extension and validation of this work will be presented in a separate manuscript. Harrill et al used a similar translational approach in a panel of inbred mouse strains to determine that acetaminophen-induced liver injury may be mediated by variation in immunogenic surface antigens affecting leukocyte signaling, particularly CD44.48
However, a general screening approach using IC50 values for viability as a phenotypic endpoint is not always appropriate. In a large screen, defining the best parameter for measurement is often difficult due to dose-response curve fitting. Within this experiment, dose-response curves for the PI3K/mTOR and MEK inhibitors did not achieve IC50 levels. Fallahi-Sichani et al found that drugs targeting the Akt/PI3K/mTOR pathway also had shallow dose-response curves in breast cancer cell lines due to significant cell-to-cell variability.49 Going forward, more specific assays may be incorporated into high-throughput screens to examine pathways affected by these targeted agents, as more sensitive markers are needed to produce a larger phenotypic gradient between more and less sensitive strains. Additionally, the appropriateness of IC50 values as a summary variable of dose-response curves for genetic analysis has been contested.29,32,49–51 IC50 values, corresponding to the potency of a compound, are physiologically relevant. Nonetheless, biological and statistical assumptions are not always met, namely that differential response can be defined by one parameter from a complex nonlinear model. In this study, supplementary AUC values, regarded as a global measure of compound activity,32 and slope coefficients of curves were generated for comparison to IC50 values. The correlations of AUC to IC50 values when available were significant, while slope coefficients varied greatly from IC50 values. When IC50 values are not achieved or nonlinear curve fitting is not appropriate, AUC could perhaps be a surrogate for differential interstrain response. Furthermore, a combination of biological, pharmacokinetic, and pharmacodynamic endpoints may be used to better understand the cytotoxic response to anticancer agents. In the future, these and additional approaches can be tested for use in detecting genetic associations in in vitro genetic association studies.
Conclusion
A cellular genetics screening approach with robust, replicable, multiplexed assays was developed to accurately describe toxicity response in normal immune cells. In this study, phenotypes were quantified using flow cytometry, yielding interstrain variation for measured endpoints in different immune cells. The more targeted agents, BEZ-235 and selumetinib, were less toxic to normal immune cells than the anthracycline agents. Also, heritability for the viability of immune cells was higher for anthracyclines than the novel agents, making them ideal for genetic analysis. This assay provides a novel way of identifying mouse strains that will model sensitivity or resistance to anthracyclines in normal immune cells. High heritability indicates a very strong genetic component of response to treatment, and the genetic determinants of response including candidate genes and cellular toxicity pathways can then be identified and provide hypotheses to test and validate in human studies. Ultimately, the hope is that we can identify biomarkers in patients with immune systems less impaired by chemotherapeutic agents.
Acknowledgments
The project described was supported by the North Carolina Translational and Clinical Sciences Institute, the National Center for Research Resources, the National Center for Advancing Translational Sciences, and the NIH, through grant award number UL1TR000083. BD is supported by NIH grant CA096500. The content is solely the responsibility of the authors and does not necessarily represent the official views of the NIH. This project was also supported by the Pharmaceutical Research and Manufacturers of America Foundation Pre Doctoral Fellowship in Pharmacology/Toxicology. WinNonlin® software was provided to faculty and trainees in the Division of Pharmacotherapy and Experimental Therapeutics, UNC Eshelman School of Pharmacy, by Certara as a member of the Pharsight Academic Center of Excellence Program. We thank Novartis for supplying us with the BEZ-235 compound.
Disclosure
KR received an honorarium from Celgene and is on the advisory board for Genentech. The other authors report no conflicts of interest in this work.
References
Zitvogel L, Kepp O, Senovilla L, Menger L, Chaput N, Kroemer G. Immunogenic tumor cell death for optimal anticancer therapy: the calreticulin exposure pathway. Clin Cancer Res. 2010;16(12):3100–3104. | |
Zitvogel L, Apetoh L, Ghiringhelli F, Kroemer G. Immunological aspects of cancer chemotherapy. Nat Rev Immunol. 2008;8(1):59–73. | |
Laoui D, Van Overmeire E, Van Ginderachter JA. Unsuspected allies: chemotherapy teams up with immunity to fight cancer. Eur J Immunol. 2013;43(10):2538–2542. | |
Obeid M, Tesniere A, Ghiringhelli F, et al. Calreticulin exposure dictates the immunogenicity of cancer cell death. Nat Med. 2006;13(1):54–61. | |
Ghiringhelli F, Apetoh L. Chemotherapy and immunomodulation: from immunogenic chemotherapies to novel therapeutic strategies. Future Oncol. 2013;9(4):469–472. | |
Hodge JW, Garnett CT, Farsaci B, et al. Chemotherapy-induced immunogenic modulation of tumor cells enhances killing by cytotoxic T lymphocytes and is distinct from immunogenic cell death. Int J Cancer. 2013;133(3):624–636. | |
Garnett CT, Schlom J, Hodge JW. Combination of docetaxel and recombinant vaccine enhances T-cell responses and antitumor activity: effects of docetaxel on immune enhancement. Clin Cancer Res. 2008;14(11):3536–3544. | |
Zitvogel L, Galluzzi L, Smyth MJ, Kroemer G. Mechanism of action of conventional and targeted anticancer therapies: reinstating immunosurveillance. Immunity. 2013;39(1):74–88. | |
Galon J, Angell HK, Bedognetti D, Marincola FM. The continuum of cancer immunosurveillance: prognostic, predictive, and mechanistic signatures. Immunity. 2013;39(1):11–26. | |
Chen DS, Mellman I. Oncology meets immunology: the cancer-immunity cycle. Immunity. 2013;39(1):1–10. | |
Andre F, Dieci MV, Dubsky P, et al. Molecular pathways: involvement of immune pathways in the therapeutic response and outcome in breast cancer. Clin Cancer Res. 2013;19(1):28–33. | |
Ghiringhelli F, Apetoh L, Tesniere A, et al. Activation of the NLRP3 inflammasome in dendritic cells induces IL-1beta–dependent adaptive immunity against tumors. Nat Med. 2009;15(10):1170–1178. | |
Kreisel D, Gelman AE, Higashikubo R, et al. Strain-specific variation in murine natural killer gene complex contributes to differences in immunosurveillance for urethane-induced lung cancer. Cancer Res. 2012;72(17):4311–4317. | |
Liu S, Kurzrock R. Toxicity of targeted therapy: implications for response and impact of genetic polymorphisms. Cancer Treat Rev. 2014;40(7):883–891. | |
Ross CJ, Visscher H, Rassekh SR, et al. Pharmacogenomics of serious adverse drug reactions in pediatric oncology. J Popul Ther Clin Pharmacol. 2011;18:e134–e151. | |
van Kuilenburg AB, Haasjes J, Richel DJ, et al. Clinical implications of dihydropyrimidine dehydrogenase (DPD) deficiency in patients with severe 5-fluorouracil-associated toxicity: identification of new mutations in the DPD gene. Clin Cancer Res. 2000;6(12):4705–4712. | |
Stocco G, Cheok MH, Crews KR, et al. Genetic polymorphism of inosine triphosphate pyrophosphatase is a determinant of mercaptopurine metabolism and toxicity during treatment for acute lymphoblastic leukemia. Clin Pharmacol Ther. 2009;85(2):164–172. | |
Beck JA, Lloyd S, Hafezparast M, et al. Genealogies of mouse inbred strains. Nat Genet. 2000;24(1):23–25. | |
Pletcher MT, McClurg P, Batalov S, et al. Use of a dense single nucleotide polymorphism map for in silico mapping in the mouse. PLoS Biol. 2004;2(12):e393. | |
ClinicalTrials.gov [homepage on the Internet]. Bethesda, MD: National Institutes of Health; 2014. Available from: https://clinicaltrials.gov. Accessed September 30, 2014. | |
Roberts PJ, Usary JE, Darr DB, et al. Combined PI3K/mTOR and MEK inhibition provides broad antitumor activity in faithful murine cancer models. Clin Cancer Res. 2012;18(19):5290–5303. | |
Bekaii-Saab T, Phelps MA, Li X, et al. Multi-institutional phase II study of selumetinib in patients with metastatic biliary cancers. J Clin Oncol. 2011;29(17):2357–2363. | |
International Clinical Trials Registry Platform [homepage on the Internet]. Geneva: World Health Organization; 2014. Available from: http://apps.who.int/trialsearch/Trial2.aspx?TrialID=ACTRN12613001351707. Accessed October 1, 2014. | |
Burris H, Rodon J, Sharma S, et al. First-in-human phase I study of the oral PI3K inhibitor BEZ235 in patients (pts) with advanced solid tumors. 2010 ASCO Annual Meeting Abstracts. J Clin Oncol. 2010;28(Suppl 15):3005. | |
Banerji U, Camidge DR, Verheul HM, et al. The first-in-human study of the hydrogen sulfate (Hyd-sulfate) capsule of the MEK1/2 inhibitor AZD6244 (ARRY-142886):a phase I open-label multicenter trial in patients with advanced cancer. Clin Cancer Res. 2010;16(5):1613–1623. | |
Bogue MA, Grubb SC. The Mouse Phenome Project. Genetica. 2004;122:71–74. | |
Johnson I, Spence MT, editors. The Molecular Probes® Handbook – A Guide to Fluorescent Probes and Labeling Technologies. 11th ed. Life Technologies Corporation; 2010. Available from: http://www.lifetechnologies.com/us/en/home/brands/molecular-probes.html. Accessed July 17, 2014. | |
Buchser W, Collins M, Garyantes T, et al. Assay Guidance Manual: Assay Development Guidelines for Image-Based High Content Screening, High Content Analysis and High Content Imaging [webpage on the Internet]. Eli Lilly & Company and the National Center for Advancing Translational Sciences. PMID: 22553861; 2012. Available from: http://www.ncbi.nlm.nih.gov/books/NBK53196/. Accessed July 17, 2014. | |
Beam A, Motsinger-Reif A. Beyond IC50s: towards robust statistical methods for in vitro association studies. J Pharmacogenomics Pharmacoproteomics. 2014;5(1):1000121. | |
Reed DR, Bachmanov AA, Tordoff MG. Forty mouse strain survey of body composition. Physiol Behav. 2007;91(5):593–600. | |
Moeller M, Hirose M, Mueller S, et al. Inbred mouse strains reveal biomarkers that are pro-longevity, antilongevity or role switching. Aging Cell. 2014;13(4):729–738. | |
Brown C, Havener TM, Everitt L, McLeod H, Motsinger-Reif AA. A comparison of association methods for cytotoxicity mapping in pharmacogenomics. Front Genet. 2011;2:86. | |
Nichols JL, Gladwell W, Verhein KC, et al. Genome-wide association mapping of acute lung injury in neonatal inbred mice. FASEB J. 2014;28(6):2538–2550. | |
Mouse Phenome Database [homepage on the Internet]. Flow-cytometric analysis of 11 inbred strains of mice. MPD: Jaxpheno6. Bar Harbor, ME: The Jackson Laboratory; 2014. Available from: http://phenome.jax.org/db/q?rtn=projects/details&sym=Jaxpheno6. Accessed July 17, 2014. | |
Mouse Phenome Database [homepage on the Internet]. Toxicity of anti-cancer agents in immune cells from 36 inbred mouse strains. MPD: Wiltshire4. Bar Harbor, ME: The Jackson Laboratory; 2014. Available at: http://phenome.jax.org/db/q?rtn=projects/projdet&reqprojid=524. Accessed August 26, 2014. | |
Lu SX, Na IK, Howe L, et al. Construction of Multicolor Antibody Panels for the Flow Cytometric Analysis of Murine Thymic Stromal Cells. BD Biosciences Application Note; 2009. Available from: https://www.bdbiosciences.com/documents/lsr_appnote02.pdf. Accessed August 7, 2014. | |
An Introduction to Compensation for Multicolor Assays on Digital Flow Cytometers. BD Biosciences Technical Bulletin; 2009. Available from: http://www.bdbiosciences.com/documents/Compensation_Multicolor_TechBulletin.pdf. Accessed August 7, 2014. | |
GraphPad Software. GraphPad Prism 5.0 learning guide [webpage on the Internet]. La Jolla, CA: GraphPad Software, Inc.: 2007. Available from: http://www.graphpad.com/help/Prism5/Prism5Help.html?using_regression_guide_2.htm. Accessed September 30, 2014. | |
Heuvers ME, Aerts JG, Cornelissen R, Groen H, Hoogsteden HC, Hegmans JP. Patient-tailored modulation of the immune system may revolutionize future lung cancer treatment. BMC Cancer. 2012;12(1):580. | |
Hanahan D, Weinberg RA. Hallmarks of cancer: the next generation. Cell. 2011;144(5):646–674. | |
Taube JM, Klein A, Brahmer JR, et al. Association of PD-1, PD-1 ligands, and other features of the tumor immune microenvironment with response to anti-PD-1 therapy. Clin Cancer Res. 2014;20(19):5064–5074. | |
Barpe DR, Rosa DD, Froehlich PE. Pharmacokinetic evaluation of doxorubicin plasma levels in normal and overweight patients with breast cancer and simulation of dose adjustment by different indexes of body mass. Eur J Pharm Sci. 2010;41(3–4):458–463. | |
Bengala C, Danesi R, Guarneri V, et al. High-dose consolidation chemotherapy with idarubicin and alkylating agents following induction with gemcitabine–epirubicin–paclitaxel in metastatic breast cancer: a dose finding study. Bone Marrow Transplant. 2003;31(4):275–280. | |
Maira SM, Stauffer F, Brueggen J, et al. Identification and characterization of NVP-BEZ235, a new orally available dual phosphatidylinositol 3-kinase/mammalian target of rapamycin inhibitor with potent in vivo antitumor activity. Mol Cancer Ther. 2008;7(7):1851–1863. | |
Bracci L, Schiavoni G, Sistigu A, Belardelli F. Immune-based mechanisms of cytotoxic chemotherapy: implications for the design of novel and rationale-based combined treatments against cancer. Cell Death Differ. 2014;21(1):15–25. | |
Bronte V, Pittet MJ. The spleen in local and systemic regulation of immunity. Immunity. 2013;39(5):806–818. | |
Frick A, Suzuki O, Butz N, Chan E, Wiltshire T. In vitro and in vivo mouse models for pharmacogenetic studies. Methods Mol Biol. 2013;1015:263–278. | |
Harrill AH, Watkins PB, Su S, et al. Mouse population-guided resequencing reveals that variants in CD44 contribute to acetaminophen-induced liver injury in humans. Genome Res. 2009;19(9):1507–1515. | |
Fallahi-Sichani M, Honarnejad S, Heiser LM, Gray JW, Sorger PK. Metrics other than potency reveal systematic variation in responses to cancer drugs. Nat Chem Biol. 2013;9(11):708–714. | |
Haibe-Kains B, El-Hachem N, Birkbak NJ, et al. Inconsistency in large pharmacogenomic studies. Nature. 2013;504(7480):389–393. | |
Paolini GV, Lyons RA, Laflin P. How desirable are your IC50s? A way to enhance screening-based decision making. J Biomol Screen. 2010;15(10):1183–1193. |
Supplementary materials
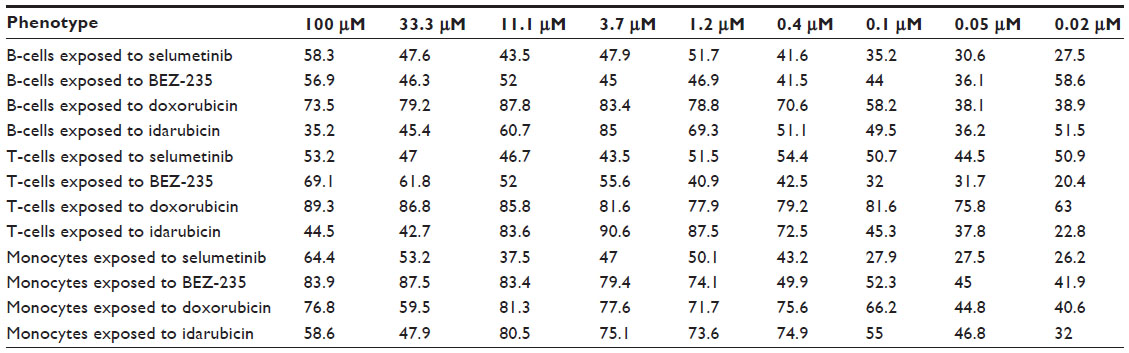 | Table S1 Heritability (%) of viability (%) at specific drug doses (μM) among different phenotypes |
 | Table S2 Phenotype correlations for area under the curve values across strains |
 | Table S3 Phenotype correlations for slope coefficient values across strains |
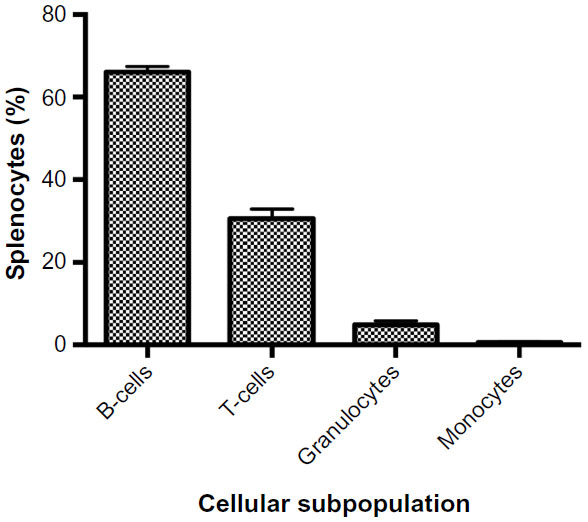 | Figure S1 Cellular subpopulations of freshly isolated splenocytes. |
 | Figure S2 Interstrain variation of viability across immune cell types and anticancer drugs. |
 | Figure S3 Interstrain phenotype comparisons for area under the curve. |
 | Figure S4 Interstrain phenotype comparisons for slope coefficients. |
 © 2015 The Author(s). This work is published and licensed by Dove Medical Press Limited. The
full terms of this license are available at https://www.dovepress.com/terms
and incorporate the Creative Commons Attribution
- Non Commercial (unported, 3.0) License.
By accessing the work you hereby accept the Terms. Non-commercial uses of the work are permitted
without any further permission from Dove Medical Press Limited, provided the work is properly
attributed. For permission for commercial use of this work, please see paragraphs 4.2 and 5 of our Terms.
© 2015 The Author(s). This work is published and licensed by Dove Medical Press Limited. The
full terms of this license are available at https://www.dovepress.com/terms
and incorporate the Creative Commons Attribution
- Non Commercial (unported, 3.0) License.
By accessing the work you hereby accept the Terms. Non-commercial uses of the work are permitted
without any further permission from Dove Medical Press Limited, provided the work is properly
attributed. For permission for commercial use of this work, please see paragraphs 4.2 and 5 of our Terms.