Back to Journals » International Journal of Nanomedicine » Volume 10 » Issue 1
Immobilization of collagen peptide on dialdehyde bacterial cellulose nanofibers via covalent bonds for tissue engineering and regeneration
Authors Wen X, Zheng Y, Wu J, Wang L ![]() , Yuan Z, Peng J, Meng H
, Yuan Z, Peng J, Meng H
Received 12 March 2015
Accepted for publication 1 May 2015
Published 21 July 2015 Volume 2015:10(1) Pages 4623—4637
DOI https://doi.org/10.2147/IJN.S84452
Checked for plagiarism Yes
Review by Single anonymous peer review
Peer reviewer comments 4
Editor who approved publication: Professor Lei Yang
Xiaoxiao Wen,1 Yudong Zheng,1 Jian Wu,2 Lu-Ning Wang,1 Zhenya Yuan,1 Jiang Peng,3 Haoye Meng3
1School of Materials Science and Engineering, University of Science and Technology Beijing, Beijing, People’s Republic of China; 2Suzhou Institute of Nano-Tech and Nano-Bionics, Chinese Academy of Sciences, Soochow, People’s Republic of China; 3Institute of Orthopedics, Chinese PLA General Hospital, Beijing, People’s Republic of China
Abstract: Bacterial cellulose (BC) is an alternative nanostructured biomaterial to be utilized for a wide range of biomedical applications. Because of its low bioactivity, which restricted its practical application, collagen and collagen hydrolysate were usually composited into BC. It is necessary to develop a new method to generate covalent bonds between collagen and cellulose to improve the immobilization of collagen on BC. This study describes a facile dialdehyde BC/collagen peptide nanocomposite. BC was oxidized into dialdehyde bacterial cellulose (DBC) by regioselective oxidation, and then composited with collagen peptide (Col-p) via covalent bonds to form Schiff’s base type compounds, which was demonstrated by the results of microstructures, contact angle, Col-p content, and peptide-binding ratio. The peptide-binding ratio was further affected by the degree of oxidation, pH value, and zeta potential. In vitro desorption measurement of Col-p suggested a controlled release mechanism of the nanocomposite. Cell tests indicated that the prepared DBC/Col-p composite was bioactive and suitable for cell adhesion and attachment. This work demonstrates that the DBC/Col-p composite is a promising material for tissue engineering and regeneration.
Keywords: bacterial cellulose, dialdehyde cellulose, collagen peptide, composite materials, cytoactivity
Introduction
Tissue engineering has shown tremendous promise in creating biological alternatives to harvested tissues, implants, and prostheses.1 The selection of biomaterials is important for the generation of scaffolds for tissue engineering. Bacterial cellulose (BC) is a natural polymer synthesized during fermentation of Gluconacetobacter xylinus. This natural polymer resembles extracellular matrix (ECM) in that it is soft, highly hydrated, and composed of a three-dimensional nanofibrous network structure with high mechanical strength,2 and has shown superior mechanical, physical, and biological properties. In vitro studies with endothelial cells,3 epidermal cells,4 and osteoprogenitor cells2 showed that BC has excellent cell compatibility. Many studies have emerged in recent years in which BC has been developed as tissue engineering scaffolds of blood vessel,3 cartilage,5 and bone.6
One of the key elements in tissue engineering is the biocompatibility of scaffold materials. The scaffold should be so implanted in the body as to coexist with tissue without causing deleterious changes.7 As a potential scaffold for tissue engineering, the biocompatibility of BC can still be improved when it is used in its natural state. Several attempts have been made to fabricate collagen/BC and collagen hydrolysate/BC composites for implantation.2,6,8,9 Collagen not only plays a supporting role in cell adhesion but also enhances cell proliferation and function.6 In most of these methods to form collagen/BC composites, connections between collagen and BC nanofibers rely on physical bonds (adsorption, coating, etc). For instance, BC was immersed in a collagen-dissolved acetic acid solution in which collagen was adsorbed onto the surface of BC nanofibers via electrostatic attraction without strong chemical interaction.9 In another work, collagen was incorporated into BC during the fermentation process. In this process, bacteria were shown to affect the activity of collagen and were not able to be removed from the composites completely.8 In another study, BC membranes were modified by glycine esterification followed by cross-linking of type I collagen employing 1-ethyl-3-(3-dimethylaminopropyl)-carbodiimide (EDAC).6 However, it was still questionable whether the excess reagents (such as N,N-dimethylformamide [DMF], EDAC) were thoroughly removed. Thus, it is necessary to develop new methods to form strong bonds between BC and collagen to effectively immobilize collagen on BC.
In our previous study,10 BC was modified into C2, 3-oxidized dialdehyde BC (DBC) by regioselective oxidation with sodium periodate. DBC has a nanofiber network structure, which is similar to ECM, and so can be favorable for cell growth and attachment. Collagen peptides (Col-p) have a unique collagen-like triple helical conformation and have been shown to associate with collagen via a strand invasion process.11–13 Col-p, which have a molecular weight of less than 1,000, can easily be absorbed by the tissues.14 Small molecular weight is beneficial to the uniformity of Col-p incorporated into the DBC nanofiber networks. It is expected that the novel nanocomposites formed by Col-p and DBC may exhibit good biocompatibility and cell activity when used as scaffold materials.
The aim of this work was to develop a nanocomposite based on DBC and Col-p for tissue engineering, in which the Col-p could be covalently and homogeneously incorporated into DBC. The composite (DBC/Col-p) with covalent bonds was prepared by immersing DBC with various degrees of oxidation into Col-p solution. The morphology, composition, thermal stability, and wettability of DBC/Col-p were investigated using a scanning electron microscope, Fourier transform infrared (FTIR) spectroscope, thermogravimetric analysis as well as contact angle measurements. The effects of pH value of solutions, degree of oxidation (DO), and zeta potential on peptide-binding ratio were investigated. Desorption tests of Col-p from BC/Col-p and DBC/Col-p were carried out to study the stability of Col-p in nanonetworks of DBC. Finally, the biocompatibility of DBC/Col-p was evaluated by culturing with fibroblasts.
Materials and methods
Materials
BC membranes were obtained from Hainan Yida Food Co., Ltd (Guangzhou, People’s Republic of China), cleansed with distilled water, immersed in 0.1 N NaOH solution at 100°C for 1 hour to remove the biomass, and finally rinsed with distilled water to pH =7.0. Col-p (molecular weight less than 1,000) was obtained from Beijing Taiaitai Biotech Co., Ltd (Beijing, People’s Republic of China). Sodium periodate (NaIO4) was purchased from Sinopharm Chemical Reagent Beijing Co., Ltd (Beijing, People’s Republic of China). BCA protein assay kit was offered by Yuanpinghao Biothech Co., Ltd (Beijing, People’s Republic of China). The 2,4,6-trinitrobenzenesulfonic acid (TNBS) was purchased from Aladdin Industrial Inc. (South Salt Lake, UT, USA). Diamine tetraacetic acid (EDTA), ethylene tetrazolium bromide (MTT), and trypsin were offered by Merck Ltd (Kenilworth, NJ, USA). All other reagents and solvents were purchased from domestic suppliers and used as received.
Preparation of DBC membranes
The DBC membranes were prepared according to the following steps: 1) BC membranes (diameter =15 mm, thickness =2.8 mm) were mixed with 2 mL of 0.01–0.1 M sodium periodate (NaIO4); 2) the mixtures were stirred gently at 20°C in the dark for desired reaction times (24, 72, 120, and 168 hours); 3) after the excess periodate was decomposed with ethylene glycol, the products (C2, 3-oxidized dialdehyde BC, DBC) were washed with distilled water.
The aldehyde content of the DBC was then analyzed by Schiff base reaction with hydroxylamine.15 Five kinds of DBC membranes with different degrees of oxidation (DO =0%, 23.8%, 43.9%, 59.7%, 80.1%) were prepared for further experiments.
Preparation of DBC/Col-p composite membranes
Col-p solution (10%, w/v) was prepared by dissolving Col-p powder in distilled water and then it was kept at 37°C for 30 minutes at pH 6.0, 7.0, and 8.0 under continuous stirring. The wet DBC membranes with different DO were placed between two sheets of filter paper, to remove free water on the surface, and then immersed in Col-p solution at room temperature for 24 hours. After that, the excess Col-p solution was removed using filter paper. Finally, samples were dried by a freeze dryer at −40°C for 3 days. The obtained membranes were named DBC/Col-p. The contents of Col-p in each DBC/Col-p membrane were evaluated by BCA protein assay kits.
Measurement of peptide-binding ratio
The peptide-binding ratio was determined by measuring the available amino groups before and after reaction using TNBS.16 The unreacted Col-p in DBC/Col-p membranes was treated with TNBS to form a soluble complex. The absorbance of the complex was measured at 334 nm after dilution. The unmodified Col-p was also treated with TNBS in a similar manner. All the experiments were carried out in triplicate. The peptide-binding ratio was calculated as follows:
|
|
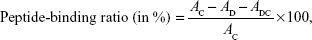
where AC is absorbance of Col-p, AD is absorbance of DBC, ADC is absorbance of DBC/Col-p.
Characterization of DBC/Col-p composite membrane
FTIR spectra of BC, DBC, and DBC/Col-p were obtained by a TENSOR 27 infrared spectrometer with an attenuated total reflectance accessory (Bruker, Ettlingen, Germany) between 4,000 and 750 cm−1 at a resolution of 4 cm−1. BC and DBC/Col-p were dehydrated by vacuum freeze dryer at −50°C. Scanning electron microscopy (SEM) images were taken at different magnifications with an Auriga Cross Beam FIB/SEM station (Carl Zeiss Meditec AG, Jena, Germany). Contact angles of distilled water on DBC/Col-p were measured with an optical contact angle meter (OCA20; Dataphysics Inc., Filderstadt, Germany) at ambient temperature. The thermogravimetric (TG) analyses were conducted on a Netzsch STA449F3 DSC-TG analyzer. The samples were heated at a heating rate of 10°C/min under high purity argon with a purge rate of 50 mL/min. Zeta potential was carried out using Delsa™ Nano C Particle Analyzer (Beckman Coulter®, Pasadena, California, USA).
Release of Col-p in vitro
In order to monitor the Col-p releasing from BC/Col-p and DBC/Col-p in vitro, the membranes were cut into round pieces, each with a diameter of 15 mm. These samples were then immersed into 10 mL phosphate buffered saline (PBS, pH =6.0, 7.0, and 8.0) at 37°C±0.1°C. Two hundred microliters of solution was taken at regular time intervals (6, 12, 24, 36, 48, and 60 hours) and analyzed for the amount of Col-p released using BCA protein assay kits.
Cultivation of fibroblast cells on DBC/Col-p composite membrane
Cultivation of fibroblasts was designed to investigate the possible effects of samples on cell growth. Westar fetal rat fibroblast cells were incubated in 2 mL DMEM (Dulbecco’s Modified Eagle’s Medium) supplemented with 10% fetal bovine serum. BC/Col-p and DBC/Col-p membranes were cut into 15 mm diameter to fit 24-well cell culture polystyrene plates. Westar fetal rat fibroblast cells (1×10⁵/mL) were seeded in the plates and cultured in 5% CO2 at 37°C for 1, 4, 7, and 10 days. To observe cell morphology and distribution, samples were fixed with 10% formaldehyde for 30 minutes and then rinsed with PBS. Cells were stained with 1% Rhodanile blue. After a wash with distilled water, fibroblast cells were observed using a Leica DMI 4000 biological microscope (Leica Microsystems, Wetzlar, Germany).
MTT assays were carried out on days 1, 4, 7, and 10 after culture. Cells cultured in wells without membranes served as controls. One hundred microliters of MTT solution (5 mg/mL) was added to each well and incubated for 4 hours at 37°C. Mitochondrial dehydrogenases of viable cells selectively cleaved the tetrazolium ring, yielding blue/purple formazan crystals. The medium was then replaced with 500 μL of dimethyl sulfoxide to completely dissolve the MTT crystals by shaking homogeneously for about 10 minutes. Solubilized formazan products were quantified by spectrophotometry at 570 nm.
Statistical analysis of data was performed by one-way analysis of variance (ANOVA), assuming confidence level of 95% (P<0.05) for statistical significance. All the data were expressed as mean ± standard deviation (SD).
Results and discussion
Chemical structure
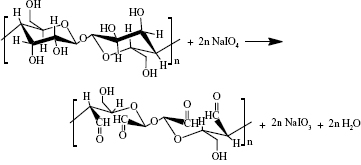
DBC membranes with different dialdehyde content were accomplished with periodate oxidation. Periodate oxidation specifically cleaves the vicinal glycols in polysaccharides to form their dialdehyde derivatives. This reaction is generally used for the elucidation of polysaccharide structure17,18 because the advantage of periodic acid lies in the specificity of its oxidation (shown in Equation 2).19
|
|
In our previous study,10 the DO was readily controlled as the oxidation level varies between 0% and 100%, depending on the quantity of sodium periodate employed. DBC membranes with different DO (=0%, 23.8%, 43.9%, 59.7%, 80.1%) were prepared to composite with Col-p.
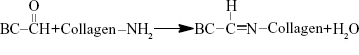
The amino groups presented in the collagen can react with dialdehydes.20,21 The main product has the Schiff base structure (Figure 1).22–24 The reaction between the amino groups of Col-p and the aldehyde group of DBC is represented by Equation 3:
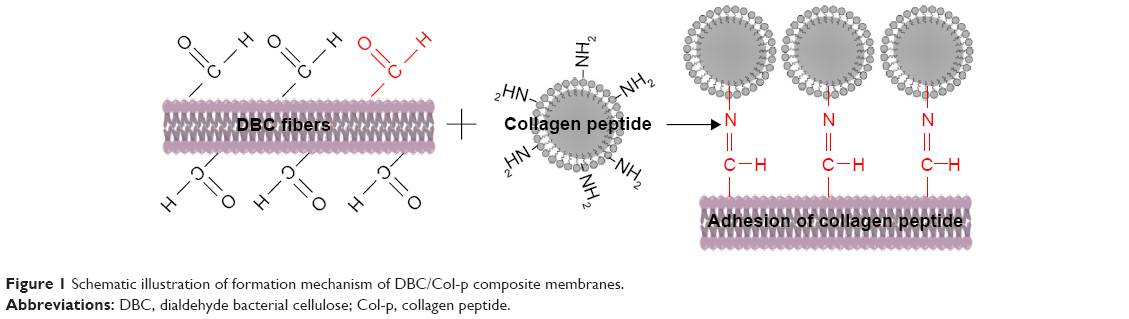 | Figure 1 Schematic illustration of formation mechanism of DBC/Col-p composite membranes. |
|
|
For effective binding, DBC should possess difunctionality to exhibit reactivity between DBC and Col-p. Hence, dialdehydes in DBC can act as good reactive sites for Col-p (Figure 1). This type of reaction between dialdehydes and collagen has been confirmed and utilized in many reports.25,26
As shown in Equation 2, the C–C bond between C2 and C3 of BC was ruptured, and the hydroxyl groups at C2, 3 of BC may be converted to aldehyde groups through the redox reaction; this reaction was just the same as that in cellulose.15,27 The results of FTIR spectra of BC, DBC, and DBC/Col-p supported the accomplishment of the reaction. As shown in Figure 2, the characteristic bands of DBC appeared in the 1,745 and 889 cm−1 regions. A diffusion band at 889 cm−1 can be assigned to the hemiacetal or hydrated structure.10 The sharp peak at 1,745 cm−1 represents a characteristic vibration of carbonyl groups.15 These new absorption peaks implied the oxidation of BC which supports the reaction of Equation 2. In the FTIR spectrum of DBC/Col-p, a group of new characteristic bands of amide II appeared in the 1,545 cm−1 regions, and the absorption peaks in the 2,700–3,000 cm−1 regions are the characteristic bands of NH+3, NH+2, or NH+ stretching.28 These results demonstrated the existence of Col-p in DBC/Col-p composite membranes. Furthermore, a significant variation of intensity can be found at ~1,649 cm−1, which represents the characteristic peaks of –C=N– band.28 The absorption peak at 1,745 cm−1 due to C=O stretching disappeared in the spectrum of DBC/Col-p compared with DBC. The missing absorption peaks and the strong absorption peaks at ~1,649 cm−1 supported the reaction of Equation 3. All these results showed that Col-p was immobilized onto DBC nanofibers, as described in Figure 1.
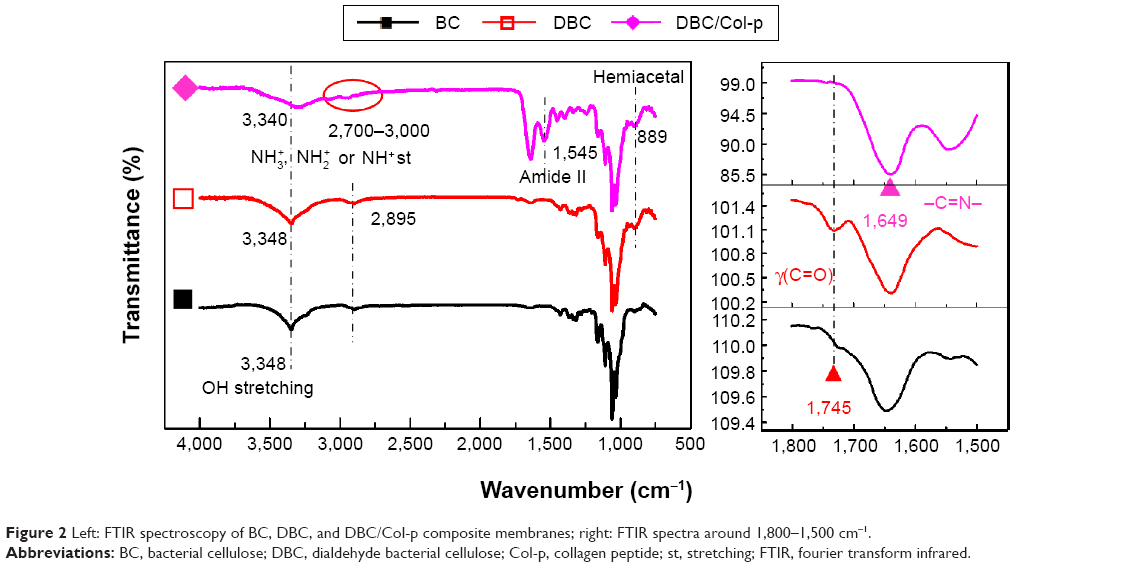 | Figure 2 Left: FTIR spectroscopy of BC, DBC, and DBC/Col-p composite membranes; right: FTIR spectra around 1,800–1,500 cm−1. |
Structure of DBC/Col-p composite membranes
The micromorphologies and structures of BC, DBC, BC/Col-p, and DBC/Col-p composite membranes can be observed by field emission-SEM images, as shown in Figure 3. The microstructure of pure BC before oxidation (Figure 3A) showed a clear 3D nanofiber network structure. The fibrils were straight and loosely arranged with large pores. Figure 3B shows the morphology of DBC. Some fibrils of DBC became thicker after oxidation. They also showed a rough and slightly curved character. The three dimensional nanofiber network structure with randomly assembled nanofibers and interconnected pores presented in BC was still preserved in DBC.
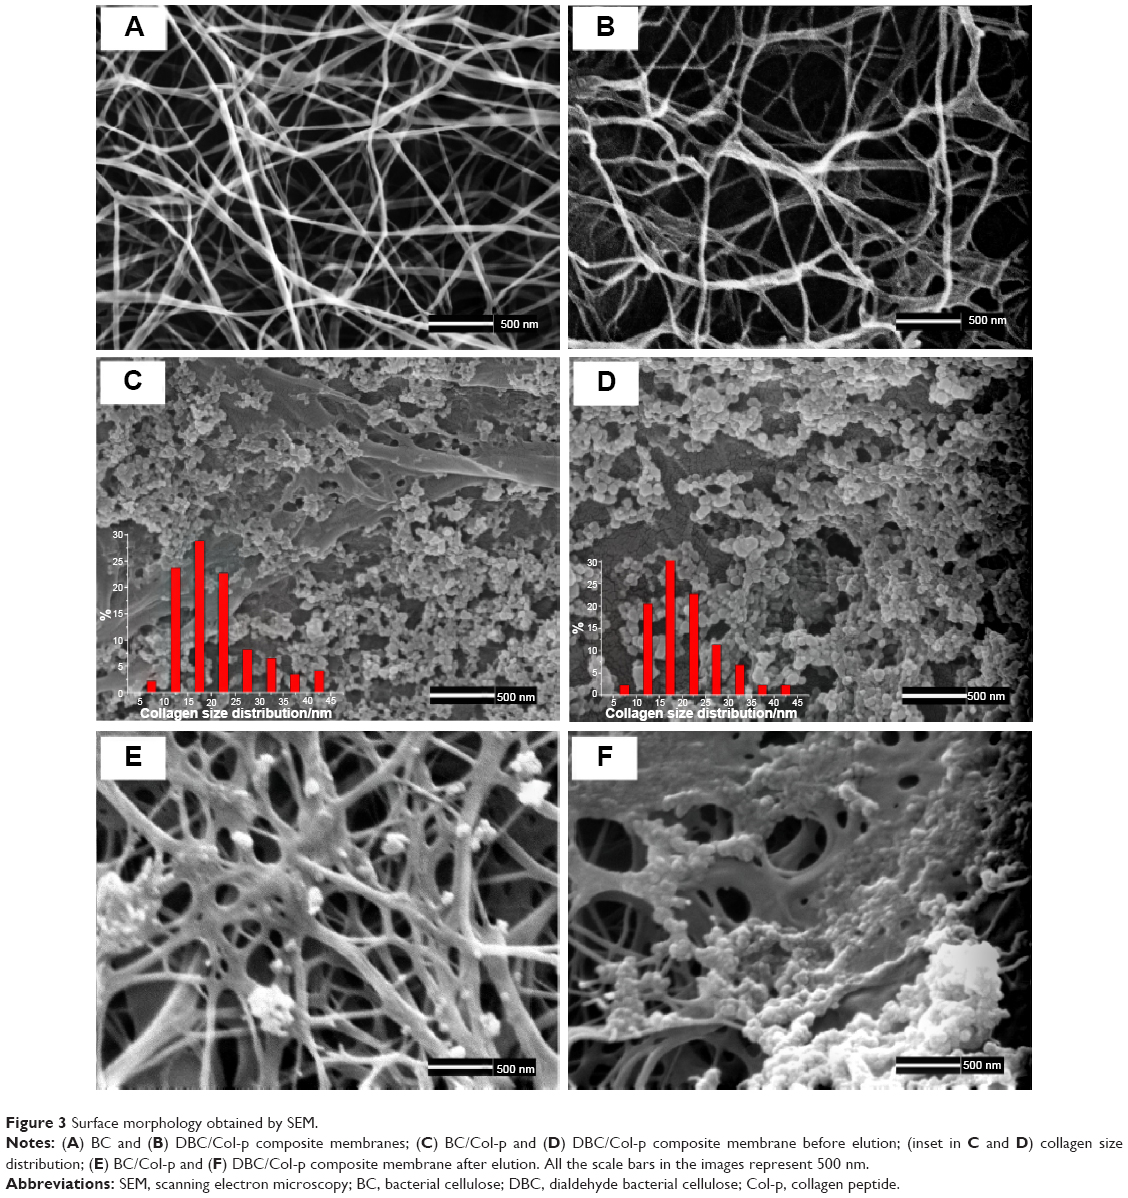 | Figure 3 Surface morphology obtained by SEM. |
After immobilization, thin Col-p coatings were formed and enwrapped in BC and DBC nanofibers (Figure 3C and D). The diameter of Col-p granule on the surfaces of BC and DBC was determined in the range of 10–25 nm (inset of Figure 3C and D). Figure 3E and F depict the morphologies and structures of BC/Col-p and DBC/Col-p composite membranes after elution in distilled water at pH 7.0. It is obvious that there is a significant difference between BC/Col-p and DBC/Col-p. Only a small amount of agglomeration of Col-p was observed on the surfaces of BC after elution with distilled water (Figure 3E), while there was a large amount of Col-p on the surfaces of DBC (Figure 3F). These differences suggested that the reaction took place between Col-p and DBC (Equation 3).
Contact angle measurements
The contact angle of the BC (Figure 4A) and DBC (Figure 4D) membranes demonstrated that these membranes were hydrophilic. The contact angle of the BC membrane is 25.1°±2.6°, while it is 34.7°±2.2° for DBC membrane. The increase in the contact angle of the DBC membrane after oxidization is likely due to the decrease of the free surface hydroxyl groups because the hydroxyl groups in C2, C3 of BC were oxidized into aldehyde groups. However, when Col-p was incorporated into the BC and DBC networks, the surface wettability changed significantly (Figure 4B and E). The contact angle of BC/Col-p is 93.5°±6.2° (Figure 4B), while it is 98.2°±3.1° for the DBC/Col-p membrane (Figure 4E). There was no significant difference between BC/Col-p and DBC/Col-p. According to the literature,6 there was a change in the distribution of charge in the collagen molecule, affecting the wettability of the material. Because a large amount of Col-p existed in the BC/Col-p and DBC/Col-p membranes, and covered entirely the surface of the membranes, the BC/Col-p and DBC/Col-p membranes showed similar wettability with very closed contact angle value.
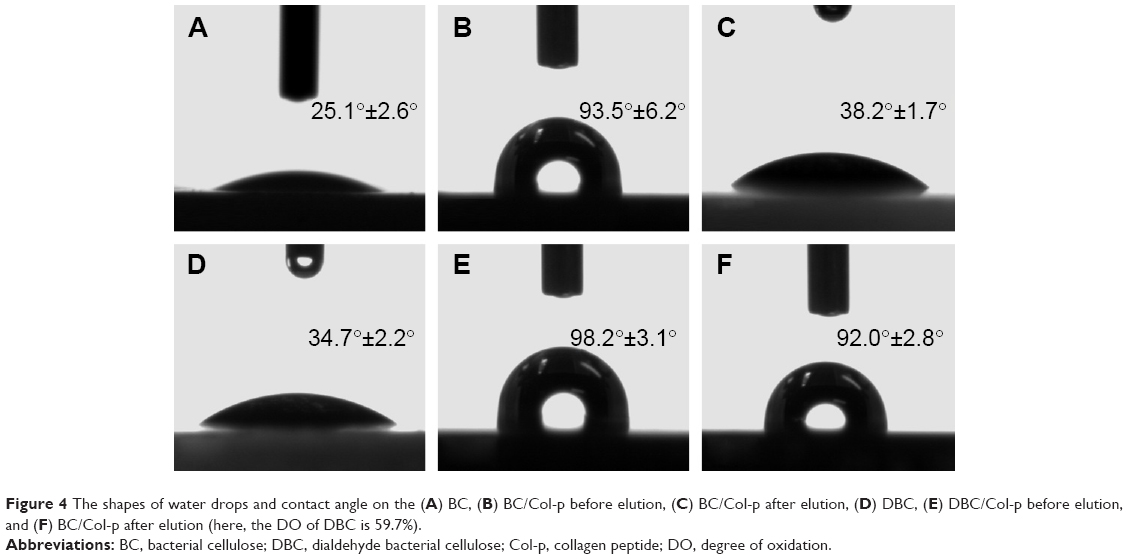 | Figure 4 The shapes of water drops and contact angle on the (A) BC, (B) BC/Col-p before elution, (C) BC/Col-p after elution, (D) DBC, (E) DBC/Col-p before elution, and (F) BC/Col-p after elution (here, the DO of DBC is 59.7%). |
Figure 4C and F show the shapes of water drops and the contact angle on the surface of BC/Col-p and DBC/Col-p after elution. The contact angle of BC/Col-p was 38.2°±1.7° (Figure 4C) after elution. The significant decrease in the contact angle of BC/Col-p may be due to the decrease in the amount of Col-p on the surface of the membranes after elution. However, the contact angle of DBC/Col-p was 92.0°±2.8° (Figure 4F) after elution, resulting in a tiny reduction in value. This change in DBC/Col-p may be due to the presence of a large amount of Col-p on the surface of the membranes after elution. The difference between the BC/Col-p and DBC/Col-p membranes was in agreement with the following studies where we have demonstrated the difference in amount of Col-p on the surface of BC/Col-p and DBC/Col-p after elution (Figure 6A). The results of wettability measurement suggested that, due to the reaction between Col-p and DBC, DBC/Col-p could change the surface wettability, effectively improving biocompatibility.
Thermal stability
The decomposition behaviors of BC, DBC, and Col-p as well as their composite membranes were analyzed by the TG technique (Figure 5). The BC membrane showed an onset of degradation at about 265°C and degraded in a single main step, with the maximal rate of mass loss of 359.84°C, whereas the DBC membranes with DO of 59.7% decomposed in one step with an onset occurring at about 270°C and one peak mass loss rate at 362.50°C (Table 1). These events could be associated with a cellulose degradation process including depolymerization, dehydration, and decomposition of glucosyl units followed by the formation of a charred residue.6,29 Col-p decomposed into two overlapping steps and two peak mass loss rates at 303.34°C and 313.32°C.
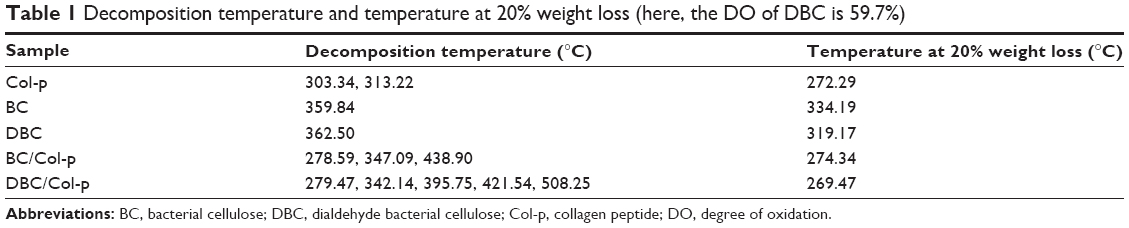 | Table 1 Decomposition temperature and temperature at 20% weight loss (here, the DO of DBC is 59.7%) |
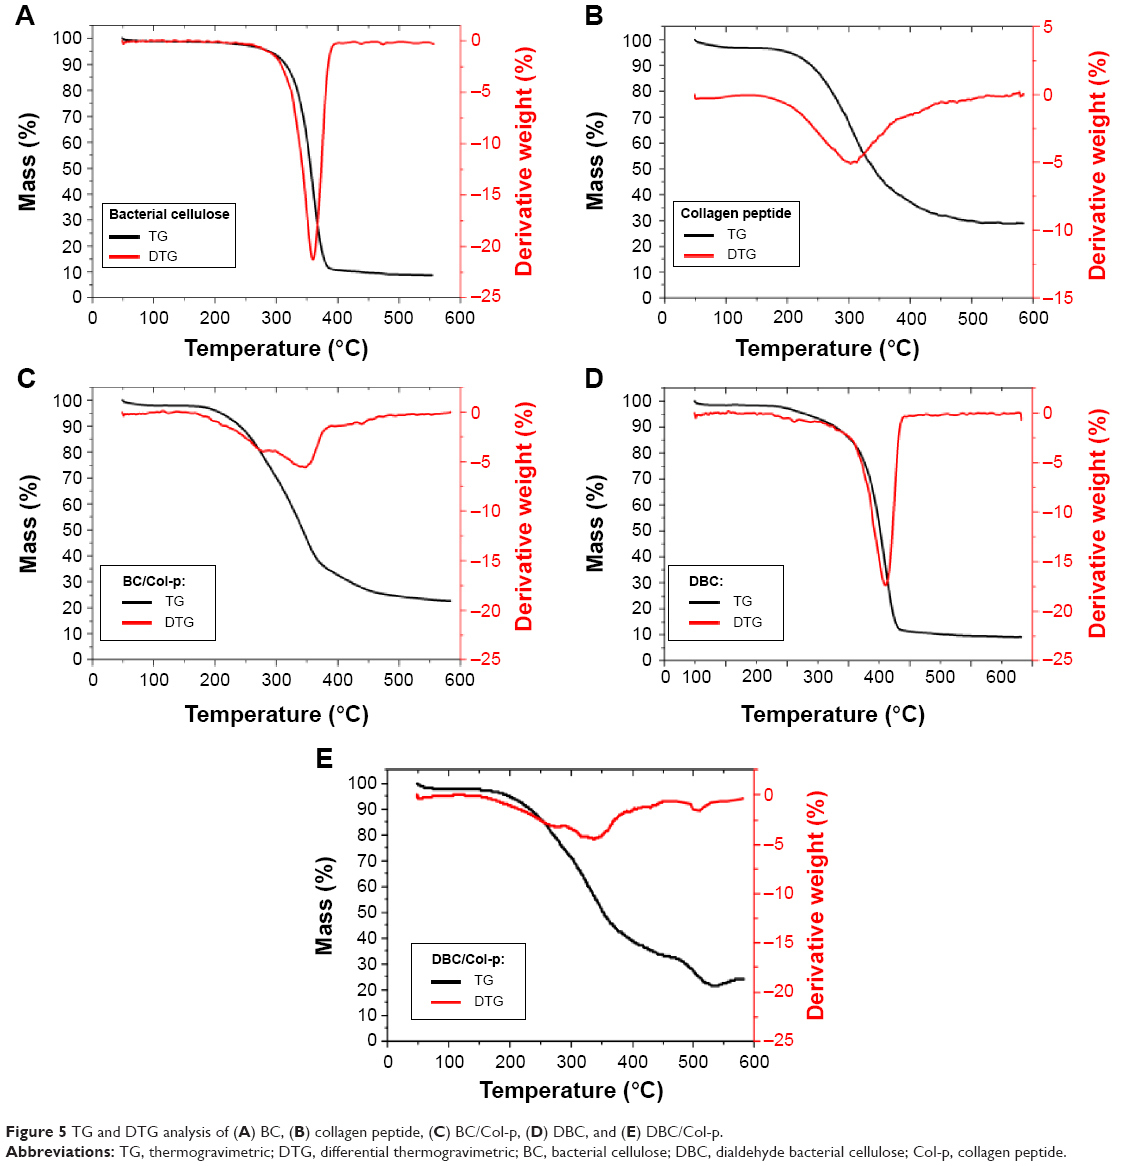 | Figure 5 TG and DTG analysis of (A) BC, (B) collagen peptide, (C) BC/Col-p, (D) DBC, and (E) DBC/Col-p. |
BC/Col-p degraded in three main steps, with three mass losses at 278.59°C, 347.09°C, and 438.90°C. The degradations of Col-p and BC in the BC/Col-p composite shifted to lower temperature. The carbonaceous residue observed for the BC and DBC membranes at ~600°C was around 8.51% and 9.12%, respectively. BC/Col-p and DBC/Col-p composites have ~22.66% and ~24.30% residue after the temperature rose to ~600°C. The difference of carbonaceous residue could confirm the incorporation of Col-p into the BC and DBC membranes, which was similar to the report by Saska et al.6 Furthermore, a new peak appeared at 438.90°C, which may be due to the electrostatic adherence between the Col-p and BC membranes. DBC/Col-p degraded in several main steps, similar to BC/Col-p, with mass losses at about 279.47°C and 342.14°C. Unlike BC/Col-p, three small loss stages appeared at about 395.75°C, 421.54°C, and 508.25°C. The new loss stages may be due to the reaction between the amino groups of Col-p and the aldehyde group of DBC.
Effects of DO, pH, and zeta potential on peptide-binding
Col-p content and peptide-binding rate assay were used to estimate the ability of DBC to react with Col-p. As shown in Figure 6A, the pH =8 showed the greatest amount of Col-p content, indicating that this condition is favorable for penetration and dispersion of Col-p to access more functional sites to react with DBC. This is consistent with a previous study, which indicated that pH =8 was conducive to interaction of aldehydes with collagen.21
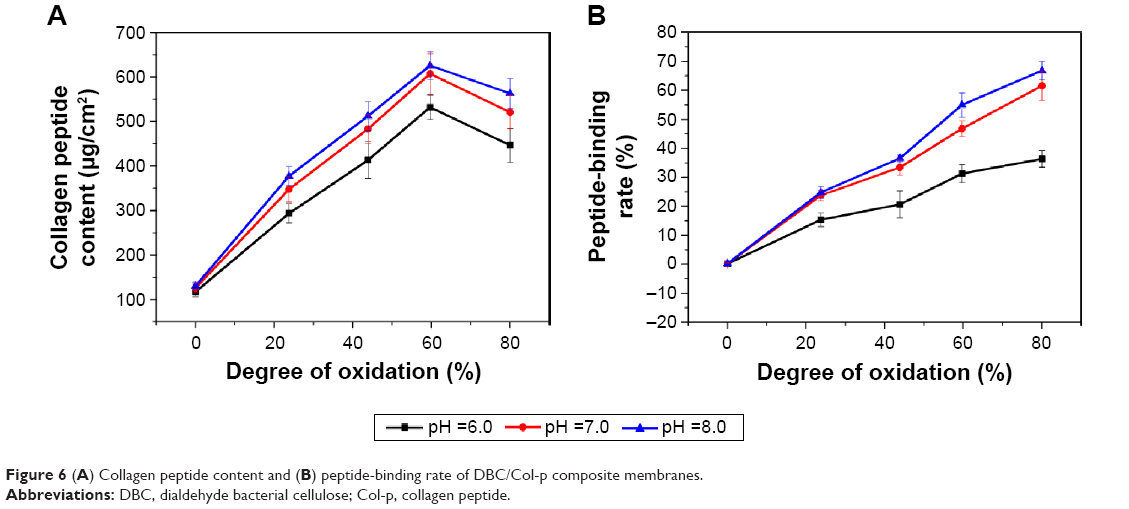 | Figure 6 (A) Collagen peptide content and (B) peptide-binding rate of DBC/Col-p composite membranes. |
From Figure 6B, it is observed that the peptide-binding rate increased with the enhancement of pH value. For instance, DBC with DO of 59.7% resulted in a peptide-binding rate of 31.26% at pH =6 as compared with 46.79% at pH =7 and 54.99% at pH =8. Higher DO of DBC could facilitate a higher peptide-binding rate. The high peptide-binding ability of DBC can be attributed to both covalent and noncovalent interactions with Col-p. There is also an increase in the uncharged amino groups (NH2) of amino acids with increased pH,30 such as lysine and arginine, which enables Col-p to be immobilized on DBC through aldehyde groups. It is well known that aldehydic groups can covalently cross-link with collagen by amino functional groups of the protein.31,32
Furthermore, pH can affect the zeta potential and isoelectric point (IEP, the pH when zeta potential =0 mV) of materials.33 The zeta potential and isoelectric point with respect to the pH value of DBC and Col-p are shown in Figure 7. BC showed weakly positive surface charges since its zeta potential measured merely 0.24 mV, and its zeta potential remained constant despite the change in pH value. However, the zeta potential of DBC decreased with increasing pH. There was a sharp decrease in the zeta potential of Col-p at a pH lower than 9. Col-p became less stable at a pH higher than 9, which may be due to the collagen degeneration. The zeta potential of DBC with DO 59.7% was in the range of 5–20 mv (Figure 7A). The amino groups are generally protonated at lower pH values,34 and thus the interaction between DBC and Col-p is preferable at a pH value above IEP of the Col-p. Col-p had an IEP at pH 6.52,35,36 above which Col-p will be negatively charged and amino sites are available for the interaction of aldehydes. As reported in the previous papers,37–39 the zeta potential would affect the electrostatic and adsorbing interaction between two different materials. As a consequence, the electrostatic interaction between the negatively charged surface of Col-p and the cationic surfaces of DBC would facilitate absorption of Col-p in the BC network. For all the reasons discussed above, the favorable range of pH was selected as 7.0–9.0. In this pH range, Col-p and DBC demonstrated opposite signs of charge with absolute value more than 10 mV, which could render sufficient electrostatic interaction between them and result in effective absorption and impregnation of Col-p into DBC fibril network. This also explains why the pH =8 showed the largest amount of Col-p content and the highest peptide-binding rate in Figure 6.
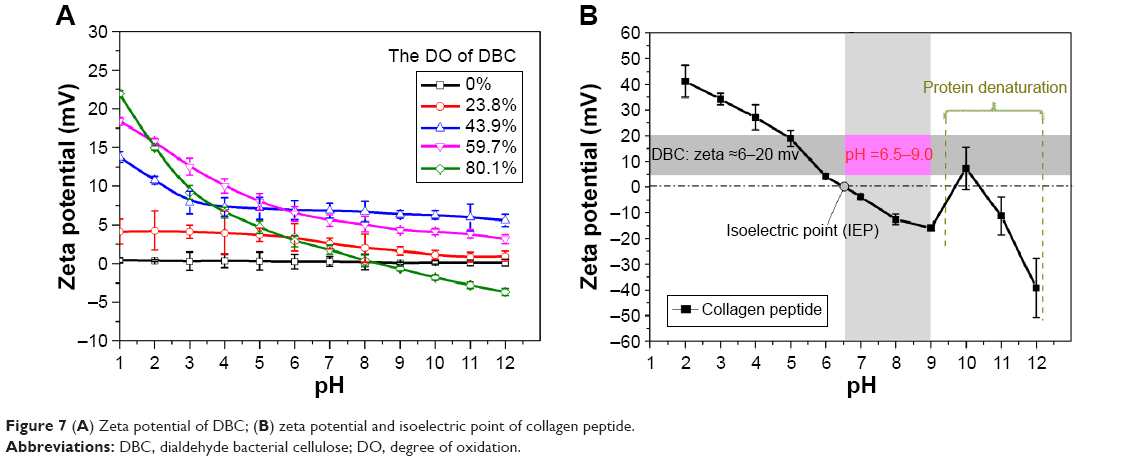 | Figure 7 (A) Zeta potential of DBC; (B) zeta potential and isoelectric point of collagen peptide. |
In vitro desorption of Col-p
Desorption of Col-p from BC/Col-p and DBC/Col-p depends upon the pH of the medium, the DO of the DBC and Col-p concentration in the membranes. In the following section, the effect of various factors has been described.
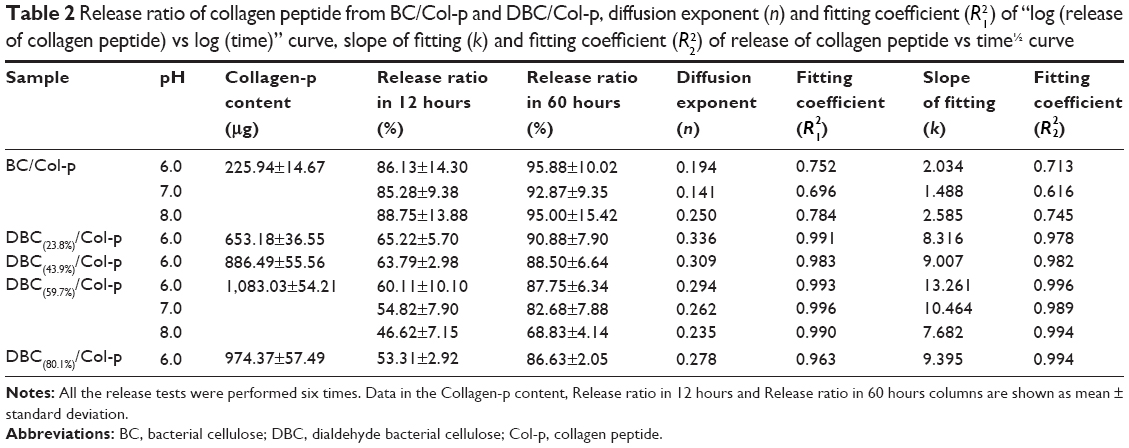
The amount of Col-p released from BC/Col-p and DBC/Col-p in phosphate buffer (pH =6.0, 7.0, and 8.0) at 37°C±0.1°C was plotted as a function of time (Figure 8A). Col-p was fully released (above 85% as shown in Table 2) from BC/Col-p within 12 hours, while 45%–60% Col-p was released from DBC/Col-p. After 60 hours, more than 92% Col-p was released from the BC/Col-p, while about 68%–87% Col-p was released from the DBC/Col-p. The Col-p remnants in DBC/Col-p increased with the increase in pH value. However, there was no difference in BC/Col-p with various pH values. Figure 8B depicts the variation of Col-p releasing from DBC/Col-p with different DO of DBC in phosphate buffer (pH =6.0) at 37°C±0.1°C. The release of Col-p in 12 hours was 53.31%–65.22% from DBC/Col-p, while the release of Col-p from BC/Col-p was 86.63%–90.88%. The Col-p remnants of DBC/Col-p increased with the increase in the DO of DBC (Table 2) probably because the reaction between Col-p and DBC restricted the release of Col-p into solution. In an attempt to further characterize the release characteristics of Col-p, the data of Col-p releasing from BC/Col-p and DBC/Col-p composite membranes were fitted to two mathematical models, the power-law model and the Higuchi model.
 | Table 2 Release ratio of collagen peptide from BC/Col-p and DBC/Col-p, diffusion exponent (n) and fitting coefficient ( |
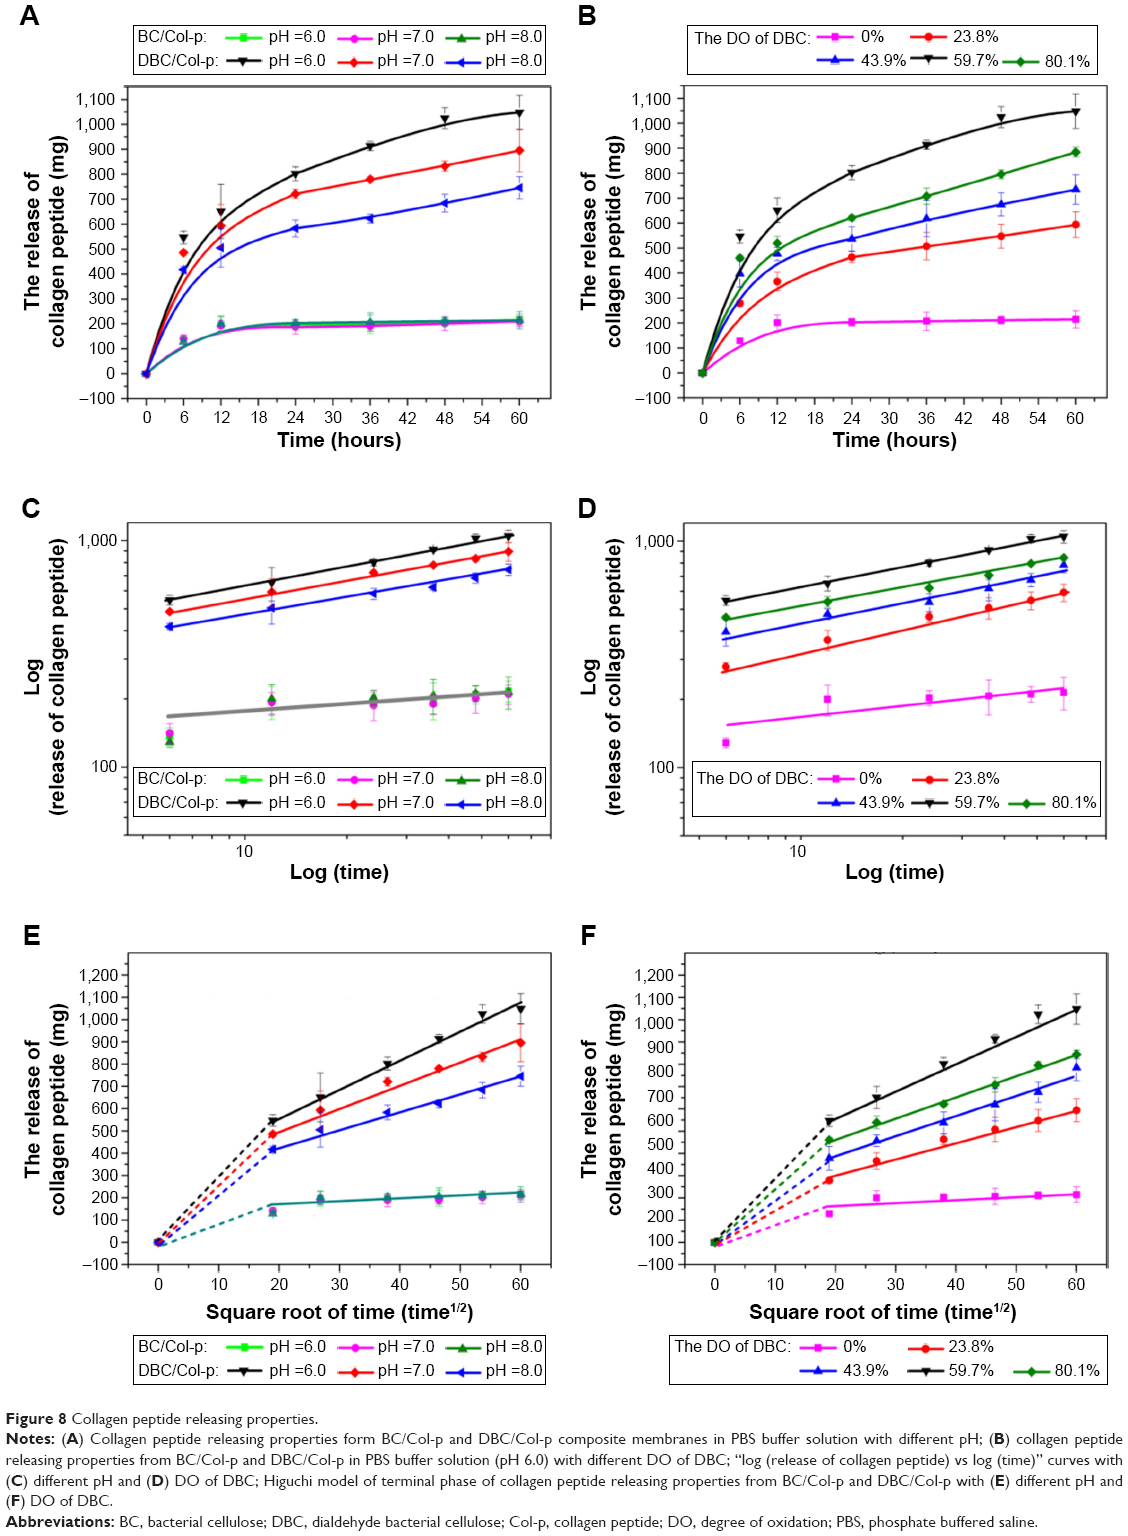 | Figure 8 Collagen peptide releasing properties. |
First, Col-p releasing from BC/Col-p and DBC/Col-p composite membranes was described by the power-law model (Peppas model) presented as follows:40
Mt = M∞tn | (4) |
where Mt and M∞ are the respective mass release at time t and infinity. n is the diffusion exponent. Information about the release mechanism can be derived by fitting the release data and comparing the value of n to the semiempirical value of various geometries reported by Ritger and Peppas.41,42
The data from the release profile of Figure 8A and B were fitted to Equation 4, as shown in Figure 8C and D. The diffusion exponent (n) and fitting coefficient ( ) are summarized in Table 2. The diffusion exponent for the Col-p release curve was found to be in the range of 0.141–0.250 (for 60 hours) in the case of BC/Col-p, but the fitting coefficient () was in the range of 0.696–0.784 and shows a low degree of fitting. However, the diffusion exponent (n) for the Col-p release curve of DBC/Col-p was found to be in the range of 0.235–0.336 (for 60 hours), and the fitting coefficient () of DBC/Col-p was above 0.960.
It is known that the Peppas model is widely used to confirm whether the release mechanism is Fickian diffusion or non-Fickian diffusion. The “n” value could be used to characterize different release mechanisms. The interpretation of n values was done in the following manner:43,44
- n<0.5 (0.45) – quasi-Fickian diffusion
- n=0.5 (0.45) – diffusion mechanism
- 0.5<n<1 – anomalous (non-Fickian) diffusion – both diffusion and relaxation
- n=1 (0.89) – case 2 transport (zero order release)
- n>1 (0.89) – super case 2 transport (relaxation).
So when the value of (n) is 0.45 or less, the drug release mechanism corresponds to the Fickian diffusion mechanism.40 The diffusion exponent (n) for the Col-p release curve of DBC/Col-p was found to be in the range of 0.235–0.336 (n<0.45), indicating that Fickian diffusion plays an important role in Col-p release from DBC/Col-p. In addition, a biphasic release pattern has been observed in Figure 8E and F, and the initial phase (0–12 hours) of release of Col-p is faster than the terminal phase (24–60 hours). The initial rapid release may be due to the releasing of Col-p that adsorbed in the networks of DBC by electrostatic adsorption. The other part of Col-p, which was composited with DBC through the reaction between the amino groups and the aldehyde group, still existed and adsorbed in the networks of DBC. As a result, a controlled release phase followed the initial rapid release.
In the terminal phase of controlled release, the Col-p could be released from DBC/Col-p via hydrolysis reaction as follows:
|
|
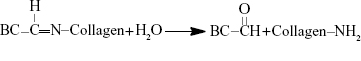
In the hydrolysis reaction, the double bonds of –C=N– were opened to form –C=O and –NH, respectively. The chemical structure of Col-p was not changed, so the bioavailability was retained once the Col-p was detached. The hydrolysis reaction occurred slowly, and hence a controlled release phase followed the initial rapid release.
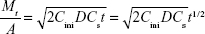
In order to unravel the release mechanism of the terminal phase of controlled release, the data of Col-p releasing from BC/Col-p and DBC/Col-p were fitted to the Higuchi model as follows:45,46
| (6) |
Note that Equation 6 can also be written in the following, more general, form:
Mt = kt1/2 | (7) |
with
| (8) |
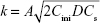
where Mt is the accumulative amount of solute released up to time t from unit area of surface and D is the diffusion coefficient of the solute in the matrix; A denotes the surface area of the film exposed to the tissue; Cini and Cs denote the initial drug concentration and drug solubility, respectively.
Figure 8E and F shows the Higuchi model of the terminal phase of Col-p releasing from BC/Col-p and DBC/Col-p; the slope of fitting (k) and fitting coefficient ( ) are summarized in Table 2. The slope of fitting (k) was found to be in the range of 1.488–2.585 in the case of BC/Col-p. The fitting coefficient () was just in the range of 0.616–0.745 and showed a low fitting degree. However, the slope of fitting (k) for the DBC/Col-p groups was found to be in the range of 8.316–13.261. The fitting coefficient () of DBC/Col-p was above 0.97. The mathematical model of the data indicated that the terminal phase of Col-p release from the DBC/Col-p was best characterized by the Higuchi model (Figure 8E and F), suggesting a similarity to collagen release from other substrate matrix.45,46 Due to the reaction between Col-p and DBC, DBC/Col-p showed a controlled release phase. The in vitro release properties of the complex of Col-p and DBC were confirmed to be affected by pH (Figure 8E) and the DO of DBC (Figure 8F), indicating a possible interaction between peptide and DBC. The results suggested a potential application of DBC in absorption and release of protein, peptide drugs, or growth factors for tissue engineering applications.
Effect of BC/Col-p and DBC/Col-p on cell compatibility
The biocompatibility of BC/Col-p and DBC/Col-p was evaluated by culturing with fibroblasts of neonatal rats on the 1st, 4th, 7th, and 10th days. Cell proliferations and morphologic changes are shown in Figure 9, where the violet spindle-shaped cells observed under an optical microscope are mouse fibroblasts.
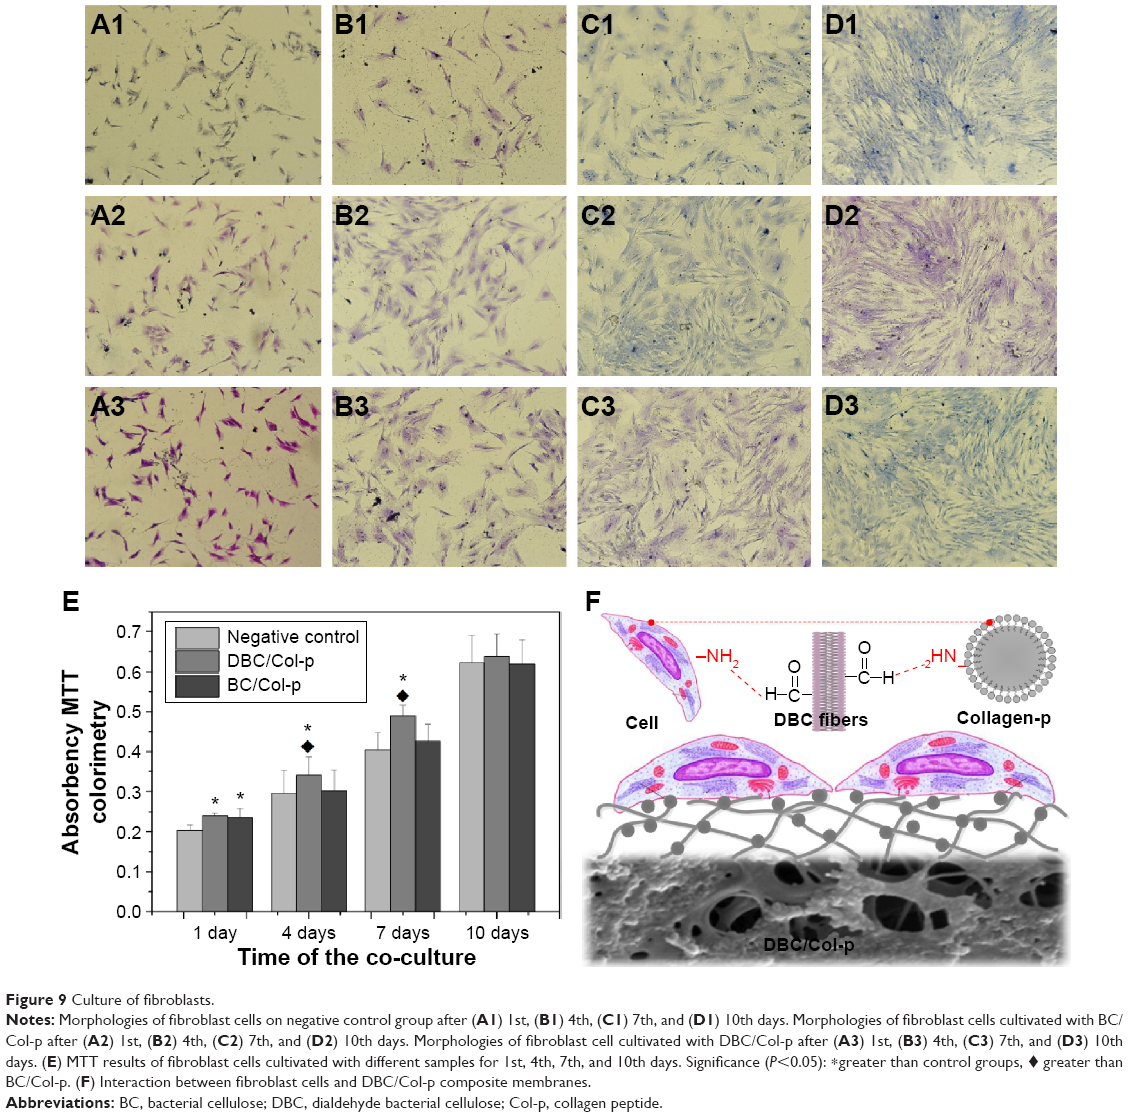 | Figure 9 Culture of fibroblasts. |
After culturing for 1 day, most mouse fibroblasts appeared in spindle shape. There were no significant differences between negative control (Figure 9A1) and BC/Col-p (Figure 9A2). It seems that there were more cells on the surface of DBC/Col-p (Figure 9A3). On the 4th day, the number of cells increased obviously with more spindle and larger flat fibroblast cells produced, demonstrating that fibroblast cells began to proliferate. There were more cells on the surface of BC/Col-p (Figure 9B2) and DBC/Col-p (Figure 9B3) compared with the negative control group (Figure 9B1), which showed no significant differences between DBC/Col-p and BC/Col-p. Fibroblasts continued to grow in well spread ways on the 7th day. The confluence of fibroblasts occurred on the 7th day (Figure 9C1– 3). On the 10th day, fibroblasts grew densely. There were no significant differences among the groups (Figure 9D1–3). The diversity of cell number among the groups was observed on the 1st, 4th, and 7th days. It would be further proved by the following statistical analysis of cellular proliferation and viability of cell growth.
The MTT data describe the relative viability of fibroblasts growing on different samples. The results (Figure 9E) showed that with increasing culture time, the viability of cells on each sample increased significantly. On the 1st day, similar to the result of morphologies observation, the absorbances of the BC/Col-p and DBC/Col-p group were greater than that of the negative control group (P<0.05). There were no obvious differences between BC/Col-p and DBC/Col-p. On the 4th and 7th days, there were no obvious differences in absorbance between the negative control group and BC/Col-p, while the absorbance of DBC/Col-p were greater than those of the negative control group and BC/Col-p (P<0.05). On the 10th day, there were no significant differences in MTT absorbances among all the groups.
The results of the morphologies observation and MTT absorbances demonstrated good biocompatibility of BC/Col-p and DBC/Col-p. Both BC/Col-p and DBC/Col-p can promote the growth and survival of fibroblasts, which can be attributed to the existence of Col-p in the nanofiber networks of BC/Col-p and DBC/Col-p. In addition, DBC/Col-p showed greater biocompatibility than BC/Col-p on the 4th and 7th days, mainly because of the higher Col-p content. Because of the reaction (Equation 2), there were still plenty of Col-p residues in DBC/Col-p after the medium was changed on the 4th and 7th days. As shown in Figure 9F, cross-linking may form between the protein of fibroblasts and Col-p on the surface of DBC fibers, as the amino groups of the protein of fibroblasts could react with the aldehyde group of DBC. The cross-linking and reactions were beneficial to the attachment and growth of fibroblast cells on the surface of DBC/Col-p. Further work such as more detailed investigation of in vitro and in vivo behaviors is underway to gain insights into the bioactivity of the obtained composite.
Conclusion
The DBC/Col-p composites have been obtained via covalent bonds between the amino functional groups in Col-p and the aldehyde group of DBC. FTIR results supported the reaction between DBC and Col-p. SEM images revealed that Col-p was immobilized into DBC nanofibers uniformly. The results of microstructures, contact angle, and Col-p content also demonstrated the reaction between DBC and Col-p. Furthermore, the degree of oxidation, pH, and zeta potential could affect the peptide-binding rate. The results of Col-p release from DBC/Col-p in vitro suggested a controlled release mechanism. Fibroblast cells cultured on the DBC/Col-p composite demonstrated that the composites encountered healthy cellular morphological features. DBC/Col-p composite also had a good cellular affinity for adhesion and proliferation. The results revealed that the DBC/Col-p composite could be used as a potential candidate for tissue engineering and regeneration.
Acknowledgments
This study is financially supported by the National Natural Science Foundation of China Project (Grant number 51473019 and Grant number 51273021), the National Science and Technology Support Project of China (Grant number 2011BAK15B04), and the National Basic Research Program of China (Grant number 2014CB542201).
Disclosure
The authors report no conflicts of interest in this work.
References
Yang S, Leong K-F, Du Z, Chua C-K. The design of scaffolds for use in tissue engineering. Part I. Traditional factors. Tissue Eng. 2001;7(6):679–689. | ||
Martinez H, Brackmann C, Enejder A, Gatenholm P. Mechanical stimulation of fibroblasts in micro-channeled bacterial cellulose scaffolds enhances production of oriented collagen fibers. J Biomed Mater Res A. 2012;100(4):948–957. | ||
Klemm D, Schumann D, Udhardt U, Marsch S. Bacterial synthesized cellulose – artificial blood vessels for microsurgery. Prog Polymer Sci. 2001;26(9):1561–1603. | ||
Luan JB, Wu J, Zheng YD, et al. Impregnation of silver sulfadiazine into bacterial cellulose for antimicrobial and biocompatible wound dressing. Biomed Mater. 2012;7(6):065006. | ||
Dugan JM, Gough JE, Eichhorn SJ. Bacterial cellulose scaffolds and cellulose nanowhiskers for tissue engineering. Nanomedicine. 2013;8(2):287–298. | ||
Saska S, Teixeira LN, de Oliveira PT, et al. Bacterial cellulose-collagen nanocomposite for bone tissue engineering. J Mater Chem. 2012;22(41):22102–22112. | ||
Lin N, Dufresne A. Nanocellulose in biomedicine: current status and future prospect. Eur Polym J. 2014;59:302–325. | ||
Luo H, Xiong G, Huang Y, He F, Wang Y, Wan Y. Preparation and characterization of a novel COL/BC composite for potential tissue engineering scaffolds. Mater Chem Phys. 2008;110(2–3):193–196. | ||
Cai ZJ, Yang G. Bacterial cellulose/collagen composite: characterization and first evaluation of cytocompatibility. J Appl Polym Sci. 2011;120(5):2938–2944. | ||
Wu J, Zheng YD, Yang Z, et al. Influence of dialdehyde bacterial cellulose with the nonlinear elasticity and topology structure of ECM on cell adhesion and proliferation. RSC Adv. 2014;4(8):3998–4009. | ||
Jung Y, Kim JE, Kim SH. In situ chondrogenic differentiation of bone marrow stromal cells in bioactive self-assembled peptide gels. J Tissue Eng Regen Med. 2012;6:227–237. | ||
Yu SM, Li Y, Kim D. Collagen mimetic peptides: progress towards functional applications. Soft Matter. 2011;7(18):7927–7938. | ||
Acevedo-Jake AM, Jalan AA, Hartgerink JD. Comparative NMR analysis of collagen triple helix organization from N- to C-termini. Biomacromolecules. 2015;16(1):145–155. | ||
Tan X, Feldman SR, Chang J, Balkrishnan R. Topical drug delivery systems in dermatology: a review of patient adherence issues. Expert Opin Drug Deliv. 2012;9(10):1263–1271. | ||
Kim UJ, Kuga S, Wada M, Okano T, Kondo T. Periodate oxidation of crystalline cellulose. Biomacromolecules. 2000;1(3):488–492. | ||
Bubnis WA, Ofner CM III. The determination of є-amino groups in soluble and poorly soluble proteinaceous materials by a spectrophotometrie method using trinitrobenzenesulfonic acid. Anal Biochem. 1992;207(1):129–133. | ||
d’Ayala GG, Malinconico M, Laurienzo P. Marine derived polysaccharides for biomedical applications: chemical modification approaches. Molecules. 2008;13(9):2069–2106. | ||
Balakrishnan B, Jayakrishnan A. Self-cross-linking biopolymers as injectable in situ forming biodegradable scaffolds. Biomaterials. 2005;26(18):3941–3951. | ||
Fernandes R, Correia R, Fonte R, Prudencio C. Human salivary alpha-amylase (EC.3.2.1.1) activity and periodic acid and Schiff reactive (PAS) staining – a useful tool to study polysaccharides at an undergraduate level. Biochem Mol Biol Edu. 2006;34(4):294–299. | ||
Bowes J, Cater C. The interaction of aldehydes with collagen. Biochim Biophys Acta. 1968;168(2):341–352. | ||
Kanth SV, Ramaraj A, Rao JR, Nair BU. Stabilization of type I collagen using dialdehyde cellulose. Process Biochem. 2009;44(8):869–874. | ||
Mitsumori S, Zhang H, Cheong PHY, Houk KN, Tanaka F, Barbas CF. Direct asymmetric anti-mannich-type reactions catalyzed by a designed amino acid. J Am Chem Soc. 2006;128(4):1040–1041. | ||
Cordova A, Watanabe S, Tanaka F, Notz W, Barbas CF. A highly enantioselective route to either enantiomer of both alpha- and beta-amino acid derivatives. J Am Chem Soc. 2002;124(9):1866–1867. | ||
Liu Y, Acharya G, Lee CH. Effects of dialdehyde starch on calcification of collagen matrix. J Biomed Mater Res A. 2011;99A(3):485–492. | ||
Eyre DR, Paz MA, Gallop PM. Cross-linking in collagen and elastin. Annu Rev Biochem. 1984;53:717–748. | ||
Draye JP, Delaey B, Van de Voorde A, Van Den Bulcke A, De Reu B, Schacht E. In vitro and in vivo biocompatibility of dextran dialdehyde cross-linked gelatin hydrogel films. Biomaterials. 1998;19(18):1677–1687. | ||
Singh M, Ray AR, Vasudevan P. Biodegradation studies on periodate oxidized cellulose. Biomaterials. 1982;3(1):16–20. | ||
Pretsch E, Bühlmann P, Badertscher M. Structure Determination of Organic Compounds. Berlin, Heidelberg: Springer; 2009. | ||
Shebani AN, van Reenen AJ, Meincken M. The effect of wood extractives on the thermal stability of different wood species. Thermochim Acta. 2008;471(1–2):43–50. | ||
Fuchs D, Fischer J, Tumakaka F, Sadowski G. Solubility of amino acids: influence of the pH value and the addition of alcoholic cosolvents on aqueous solubility. Ind Eng Chem Res. 2006;45(19):6578–6584. | ||
Oliver RF, Grant RA, Cox RW, Cooke A. Effect of aldehyde cross-linking on human dermal collagen implants in the rat. Br J Exp Pathol. 1980;61(5):544–549. | ||
Fathima NN, Madhan B, Rao JR, Nair BU, Ramasami T. Interaction of aldehydes with collagen: effect on thermal, enzymatic and conformational stability. Int J Biol Macromol. 2004;34(4):241–247. | ||
Salgin S, Salgin U, Bahadir S. Zeta potentials and isoelectric points of biomolecules: the effects of ion types and ionic strengths. Int J Electrochem Sci. 2012;7(12):12404–12414. | ||
Suh J, Paik HJ, Hwang BK. Ionization of poly(ethylenimine) and poly(allylamine) at various phs. Bioorg Chem. 1994;22(3):318–327. | ||
Jackson DS, Neuberger A. Observations on the isoionic and isoelectric point of acid-processed gelatin from insoluble and citrate-extracted collagen. Biochim Biophys Acta. 1957;26(3):638–639. | ||
Cassel JM, Kanagy JR. Studies on the purification of collagen. J Res Nat Bur Stand. 1949;42(6):557–565. | ||
Honary S, Zahir F. Effect of zeta potential on the properties of nano-drug delivery systems – a review (part 1). Trop J Pharm Res. 2013;12(2):255–264. | ||
Patil S, Sandberg A, Heckert E, Self W, Seal S. Protein adsorption and cellular uptake of cerium oxide nanoparticles as a function of zeta potential. Biomaterials. 2007;28(31):4600–4607. | ||
Rezwan K, Meier LP, Rezwan M, Voros J, Textor M, Gauckler LJ. Bovine serum albumin adsorption onto colloidal Al2O3 particles: a new model based on zeta potential and UV-vis measurements. Langmuir. 2004;20(23):10055–10061. | ||
Changez M, Burugapalli K, Koul V, Choudhary V. The effect of composition of poly(acrylic acid)–gelatin hydrogel on gentamicin sulphate release: in vitro. Biomaterials. 2003;24(4):527–536. | ||
Ritger PL, Peppas NA. A simple equation for description of solute release I. Fickian and non-Fickian release from non-swellable devices in the form of slabs, spheres, cylinders or discs. J Control Relea se. 1987;5(1):23–36. | ||
Ritger PL, Peppas NA. A simple equation for description of solute release II. Fickian and anomalous release from swellable devices. J Control Release. 1987;5(1):37–42. | ||
Costa P, Manuel J, Lobo S. Modeling and comparison of dissolution profiles. Eur J Pharm Sci. 2001;13(2):123–133. | ||
Larraneta E, Martinez-Oharriz C, Velaz I, Zornoza A, Machin R, Isasi JR. In vitro release from reverse poloxamine/alpha-cyclodextrin matrices: modelling and comparison of dissolution profiles. J Pharm Sci. 2014;103(1):197–206. | ||
Paul DR. Elaborations on the Higuchi model for drug delivery. Int J Pharm. 2011;418(1):13–17. | ||
Siepmann J, Peppas NA. Higuchi equation: derivation, applications, use and misuse. Int J Pharm. 2011;418(1):6–12. |
 © 2015 The Author(s). This work is published and licensed by Dove Medical Press Limited. The
full terms of this license are available at https://www.dovepress.com/terms
and incorporate the Creative Commons Attribution
- Non Commercial (unported, 3.0) License.
By accessing the work you hereby accept the Terms. Non-commercial uses of the work are permitted
without any further permission from Dove Medical Press Limited, provided the work is properly
attributed. For permission for commercial use of this work, please see paragraphs 4.2 and 5 of our Terms.
© 2015 The Author(s). This work is published and licensed by Dove Medical Press Limited. The
full terms of this license are available at https://www.dovepress.com/terms
and incorporate the Creative Commons Attribution
- Non Commercial (unported, 3.0) License.
By accessing the work you hereby accept the Terms. Non-commercial uses of the work are permitted
without any further permission from Dove Medical Press Limited, provided the work is properly
attributed. For permission for commercial use of this work, please see paragraphs 4.2 and 5 of our Terms.