
Back to Journals » International Journal of Women's Health » Volume 18
Identifying Potential Drivers of the Polycystic Ovary Syndrome Burden in the European Union: GBD 2023 SEV Exposure Profiling and Mendelian Randomization
Authors Lu S, Ye S, Luo X, Zhang B
Received 2 January 2026
Accepted for publication 11 April 2026
Published 23 April 2026 Volume 2026:18 593314
DOI https://doi.org/10.2147/IJWH.S593314
Checked for plagiarism Yes
Review by Single anonymous peer review
Peer reviewer comments 2
Editor who approved publication: Dr Vinay Kumar
Shengnan Lu, Sha Ye, Xiaofang Luo, Biyun Zhang
Department of Gynecology, Cixi Maternity & Child Health Care Hospital, Ningbo, Zhejiang, People’s Republic of China
Correspondence: Biyun Zhang, Department of Gynecology, Cixi Maternity & Child Health Care Hospital, No. 1288, Erzao Tan Road, Baisha Road Sub-District, Cixi, Ningbo, Zhejiang, 315300, People’s Republic of China, Email [email protected] Xiaofang Luo, Department of Gynecology, Cixi Maternity & Child Health Care Hospital, No. 1288, Erzao Tan Road, Baisha Road Sub-District, Cixi, Ningbo, Zhejiang, 315300, People’s Republic of China, Email [email protected]
Background: The Global Burden of Disease (GBD) study quantifies the burden of polycystic ovary syndrome (PCOS) but does not include PCOS-specific attributable risks. We combined GBD 2023 Summary Exposure Value (SEV) profiling with Mendelian randomization (MR) to identify and prioritize potential drivers of PCOS burden.
Methods: We analyzed PCOS incidence, prevalence, disability-adjusted life years (DALYs), and age-standardized rates (ASRs) from 1990 to 2023. Temporal trends were assessed using Estimated Annual Percentage Change (EAPC) and Joinpoint regression. Within the European Union (EU), we evaluated associations between disease burden and Socio-demographic Index (SDI) and cross-checked these findings against Human Development Index (HDI) and Universal Health Coverage (UHC). Expert-screened SEVs were correlated with country-level age-standardized incidence rate (ASIR) using Pearson correlation with Benjamini–Hochberg adjustment; significant exposures were then clustered. Two-sample MR was used to test the effect of nitrogen dioxide (NO2) on PCOS risk, accompanied by standard sensitivity analyses.
Results: In 2023, the EU ASIR exceeded the global level despite a smaller EAPC, with marked heterogeneity across countries. SDI was positively correlated with PCOS ASRs. SEV screening identified eight exposures associated with ASIR, of which childhood sexual abuse and NO2 pollution most clearly distinguished high- from low-ASIR countries. MR analysis supported a positive association between genetically predicted NO2 exposure and PCOS risk (IVW OR 6.60, 95% CI 1.85– 23.58; P = 0.00365), with broadly consistent results across sensitivity analyses.
Conclusion: Combining SEV profiling with MR offers a practical approach for prioritizing modifiable drivers of PCOS burden within the GBD framework. NO2 demonstrated a causal signal, suggesting that air pollution control may represent a viable target for PCOS prevention.
Keywords: polycystic ovary syndrome, Global Burden of Disease, European Union, summary exposure value, nitrogen dioxide, Mendelian randomization
Introduction
Polycystic ovary syndrome (PCOS) is among the most common reproductive–metabolic disorders in women of reproductive age. Core clinical phenotypes include ovulatory dysfunction, hyperandrogenism, and/or polycystic ovarian morphology.1 The pathophysiology of PCOS is highly heterogeneous, often driven by multiple interconnected mechanisms: dysregulation of the hypothalamic–pituitary–ovarian axis, impaired ovarian steroidogenesis, insulin resistance with hyperinsulinemia, 2 adipose tissue inflammation, and genetic susceptibility.2,3 Prevalence estimates vary substantially across populations and are strongly influenced by diagnostic criteria and population characteristics; systematic reviews report a wide range of overall prevalence.4
Beyond its role as a major cause of anovulatory infertility and menstrual irregularities, PCOS is associated with adverse metabolic outcomes (eg, impaired glucose tolerance and increased risk of type 2 diabetes), 6 clustering of cardiovascular risk factors,5 and psychological burden including anxiety and depression.6,7 The 2023 international evidence-based guideline emphasizes that PCOS management should extend beyond reproductive outcomes to encompass health across the life course; the guideline also highlights the public health impact of delayed diagnosis and suboptimal long-term management.8 In addition to genetic predisposition and adiposity-related factors, prior studies have examined PCOS-related risk factors including dietary patterns,9 tobacco exposure, air pollution,10 and other environmental exposures. However, heterogeneity in study designs and populations has limited the consistency of this evidence.2 Clinical heterogeneity in PCOS may also reflect variation in endocrine and metabolic comorbidities. In a clinical study, Gencer et al found that insulin resistance was associated with enlarged ovarian volume in women with PCOS, whereas coexisting Hashimoto’s thyroiditis did not clearly increase the overall frequency of ovarian volume abnormalities but appeared to modify the pattern of ovarian involvement, highlighting the potential interplay among metabolic dysfunction, thyroid autoimmunity, and ovarian morphology.11
The European Union (EU) provides a relatively harmonized data and policy environment for cross-country comparisons. Official statistical systems and health indicator frameworks in EU member states emphasize comparability and consistency, potentially reducing institutional and statistical heterogeneity in international comparisons. At the same time, gradients in development and health service coverage persist within the EU, enabling evaluation of associations between macro-level development and disease burden within an overall high-development setting. Shared health governance structures and collaborative platforms further facilitate translation of research findings into policy actions. The Human Development Index (HDI), available from the UNDP data center, and the Universal Health Coverage (UHC) service coverage index, which summarizes multiple tracer indicators on a 0–100 scale, provide complementary measures for consistent cross-country assessment. Within the Global Burden of Disease (GBD) framework, PCOS burden can be quantified using estimates of incidence, prevalence, and disability-adjusted life years (DALYs); however, GBD does not currently provide PCOS-specific attributable risk assessments.12
This study aimed to identify potential drivers of cross-country differences in PCOS burden within the EU. We first assessed associations between PCOS burden and the Socio-demographic Index (SDI), with consistency checks using HDI and the UHC index. We then incorporated the GBD summary exposure value (SEV), a relative risk–weighted summary measure of population exposure, to screen potentially modifiable risk exposures,13 and characterize exposure profiles across EU countries. Finally, we explored causal evidence for key exposures using Mendelian randomization.
Materials and Methods
Data Sources
Disease burden data were obtained from the GBD 2023 database and the GBD Results Tool. We extracted PCOS incidence, prevalence, and disability-adjusted life years (DALYs) as counts and age-standardized rates and reported the corresponding 95% uncertainty intervals (UIs) provided by GBD.14 All rates in this study are presented per 100,000 population. Age-standardized incidence, prevalence, and DALY rates are denoted as ASIR, ASPR, and ASDR, respectively. DALYs comprise years of life lost (YLLs) and years lived with disability (YLDs): DALYs = YLLs + YLDs.15 Because PCOS is rarely directly fatal and GBD does not provide estimates for deaths or YLLs attributable to PCOS, we did not analyze mortality-related outcomes. Under this framework, PCOS DALYs are entirely driven by YLDs and are numerically equivalent to YLDs. To maintain comparability with other burden-of-disease studies, we used DALYs rather than YLDs as the overall metric of health loss.
This study included all 27 European Union member states as defined by 2023 EU membership. Based on country-level PCOS ASIR in 2023, we applied unsupervised k-means clustering to classify countries into high- and low-ASIR groups (k = 2, nstart = 50). The grouping cutoff was defined as the midpoint between the maximum ASIR in the low-ASIR group and the minimum ASIR in the high-ASIR group; this classification was used for subsequent SEV exposure profile comparisons and descriptive analyses.
Statistical Analysis and Trend Quantification
We used the estimated annual percentage change (EAPC) to quantify long-term temporal trends in age-standardized rates (ASRs) from 1990 to 2023.16 Briefly, a log-linear regression model was fitted as ln(ASR) = α + β × year + ε, and EAPC was calculated as 100 × (exp(β) − 1). An increasing trend was defined when both the EAPC estimate and the lower bound of its 95% confidence interval (CI) were greater than 0. A decreasing trend was defined when both the EAPC estimate and the upper bound of its 95% CI were less than 0. Otherwise, the trend was considered stable.17
To identify phase-specific changes in long-term trends, we applied Joinpoint regression to annual ASRs using the Joinpoint Regression Program (version 5.4.0). A grid-search approach was used to locate candidate joinpoints, allowing 0–5 joinpoints, with at least two observations at each end of the series and between adjacent joinpoints. The final model was selected using the Monte Carlo permutation test (overall α = 0.05; 4499 permutations).18 Segment-specific annual percentage changes (APCs) were reported with 95% CIs estimated using the parametric method. All statistical analyses and visualizations were performed in R (version 4.5.1). Two-sided P values < 0.05 were considered statistically significant.
Socioeconomic and Health System Indices
At the EU country level, we evaluated associations between PCOS burden and macro-level development and health system indicators, using ASIR as the primary outcome and ASPR and ASDR as complementary outcomes. Exposures included three composite indices: the Socio-demographic Index (SDI),15 the Human Development Index (HDI), and the Universal Health Coverage (UHC) service coverage index. Pearson correlation was used to quantify linear associations between each index and ASRs, and simple linear regression was conducted as a complementary analysis to estimate the direction and magnitude of associations. Because HDI and UHC data were missing for some countries, single-index analyses included all countries with available data for that index, whereas comparative analyses involving multiple indices were restricted to countries with complete data across all three indices to ensure comparability.
SEV-Based Exposure Profiling
We extracted summary exposure values (SEVs) for 68 detailed risk exposures from GBD. SEV is a relative risk–weighted summary measure of population exposure, ranging from 0 to 100, where 0 indicates no excess risk in the population and 100 indicates exposure at the highest risk level.13 After excluding exposures with no clear relevance to PCOS based on expert input, 33 SEVs were retained for subsequent analyses.
At the EU country level, ASIR was used as the primary outcome. We calculated Pearson correlation coefficients between each retained SEV and country-level ASIR and adjusted P values for multiple comparisons using the Benjamini–Hochberg procedure.19 For exposures that remained significant after adjustment, we compared exposure profile differences between the high- and low-ASIR groups. To improve interpretability, SEVs were converted into country-specific ranks from highest to lowest exposure (smaller ranks indicating higher relative exposure). Based on the rank matrix, Ward.D2 hierarchical clustering was performed jointly on countries and exposures, and heatmaps with dendrograms were used to visualize clustering structure and between-group patterns.21 SEV-related analyses focused on ASIR because incidence more directly reflects disease onset, whereas prevalence and DALYs are more likely to be influenced by disease duration, diagnostic accessibility, and disability weighting.
Mendelian Randomization
We performed two-sample Mendelian randomization (MR) to infer the potential causal effect of exposure on the outcome using genetic variants as instrumental variables. Summary-level genome-wide association study (GWAS) statistics for both exposure and outcome were obtained from the IEU OpenGWAS platform, without access to any identifiable individual-level information. For the exposure dataset, single-nucleotide polymorphisms (SNPs) significantly associated with the exposure were selected at P < 5 × 10⁻⁸, and linkage disequilibrium clumping was applied (r2 < 0.001, 10 kb window) to obtain independent instrumental variables.20 Instrument SNPs were then harmonized with the outcome dataset to align effect alleles, and palindromic SNPs that could not be reliably oriented were excluded. F-statistics were calculated for each instrument, and only SNPs with F > 10 were retained to minimize weak-instrument bias.21 Detailed information on the retained instrumental variables, including R, F statistics, r.exposure, and r.outcome, is provided in Table S1.
The inverse-variance weighted (IVW) method was used as the primary estimator, with MR-Egger, weighted median, simple mode, and weighted mode methods applied for robustness comparisons.22–24 We conducted a comprehensive set of sensitivity analyses, including Cochran’s Q test for heterogeneity, the MR-Egger intercept test to assess directional horizontal pleiotropy, and the MR-PRESSO global test to detect horizontal pleiotropy and potential outlier influence.25 Causal direction was evaluated using the Steiger directionality test,26 and funnel plots and leave-one-out analyses were used to assess robustness. Effect estimates (β) were obtained on the log scale and exponentiated to odds ratios (ORs), with corresponding 95% confidence intervals and P values reported.
Results
Overview of PCOS Burden at the Global Level and in the EU
As shown in Table 1, the global number of incident PCOS cases in 2023 was 2,257,811.49 (95% UI: 1,617,520.98–3,099,796.61), with an age-standardized incidence rate (ASIR) of 60.34 per 100,000 (95% UI: 43.21–83.04). This represented an increase from 49.34 per 100,000 in 1990 (95% UI: 35.92–68.23), corresponding to an EAPC of 0.74% (95% CI: 0.70–0.77) during 1990–2023. In the EU, incident cases in 2023 totaled 163,648.35 (95% UI: 116,195.77–227,338.30), fewer than the 179,025.48 cases in 1990 (95% UI: 127,076.15–247,649.91). Despite this decline in absolute numbers, ASIR increased from 106.36 per 100,000 (95% UI: 75.47–147.54) to 121.35 per 100,000 (95% UI: 85.60–169.55), with an EAPC of 0.54% (95% CI: 0.50–0.57). The EU consistently showed higher ASIR than the global level (Figure S1) but with a smaller growth rate.
 |
Table 1 Global and EU Burden of PCOS in DALYs, Incidence, and Prevalence, 1990 and 2023, and EAPCs During 1990–2023 with 95% CI |
For prevalence, the global number of prevalent cases in 2023 was 67,906,819.97 (95% UI: 48,176,989.26–93,056,147.90), with an age-standardized prevalence rate (ASPR) of 1697.82 per 100,000 (95% UI: 1203.25–2328.52) and an EAPC of 0.72% (95% CI: 0.68–0.76). In the EU, prevalent cases totaled 5,979,900.66 (95% UI: 4,407,134.92–8,203,526.49), with an ASPR of 3079.36 per 100,000 (95% UI: 2274.12–4249.76) and an EAPC of 0.29% (95% CI: 0.25–0.33). For DALYs, the global total in 2023 was 652,802.10 (95% UI: 287,345.51–1,431,442.63), with an age-standardized DALY rate (ASDR) of 16.34 per 100,000 (95% UI: 7.19–35.75) and an EAPC of 0.74% (95% CI: 0.70–0.78). EU DALYs totaled 57,101.88 (95% UI: 25,941.73–122,272.78), with an ASDR of 29.44 per 100,000 (95% UI: 13.31–62.95) and an EAPC of 0.31% (95% CI: 0.27–0.36). Overall, the EU had higher age-standardized rates than global estimates for all three metrics, while EAPCs were consistently smaller. In absolute terms, incident cases declined in the EU, whereas prevalent cases and total DALYs increased modestly.
Building on the long-term trends indicated by EAPC, we applied Joinpoint regression to annual ASIR, ASPR, and ASDR to identify phase-specific changes. Figure S1 (segment-specific APCs and 95% CIs in Table S2; observed annual ASRs and fitted Joinpoint values in Table S3) shows broadly similar temporal patterns for ASIR in global and EU populations: sustained increases before 2021 followed by declines during 2021–2023, with larger absolute APCs at the global level. Temporal patterns for ASDR and ASPR differed notably between global and EU populations. In the EU, ASDR and ASPR showed significant decreases during 2004–2010 and 2003–2010, with APCs of −0.22 (95% CI: −0.29 to −0.14) and −0.18 (95% CI: −0.22 to −0.13), respectively. Over similar periods globally, APCs were 0.30 (95% CI: 0.20–0.41) for ASDR and 0.28 (95% CI: 0.18–0.38) for ASPR, indicating opposite phase-specific directions.
Cross-Country Heterogeneity within the EU
Substantial cross-country heterogeneity was observed within the EU (Figure 1D and E; annual country-level ASRs in Table S4; country-specific EAPCs for 1990–2023 in Table S5). In 1990, Italy had the highest ASIR (361.56 per 100,000; 95% UI: 258.96–504.62), whereas Romania had the lowest (5.82 per 100,000; 95% UI: 3.76–8.65). In 2023, Italy remained highest (320.98 per 100,000; 95% UI: 227.93–451.97), while Czechia had the lowest ASIR (8.09 per 100,000; 95% UI: 5.41–11.88).
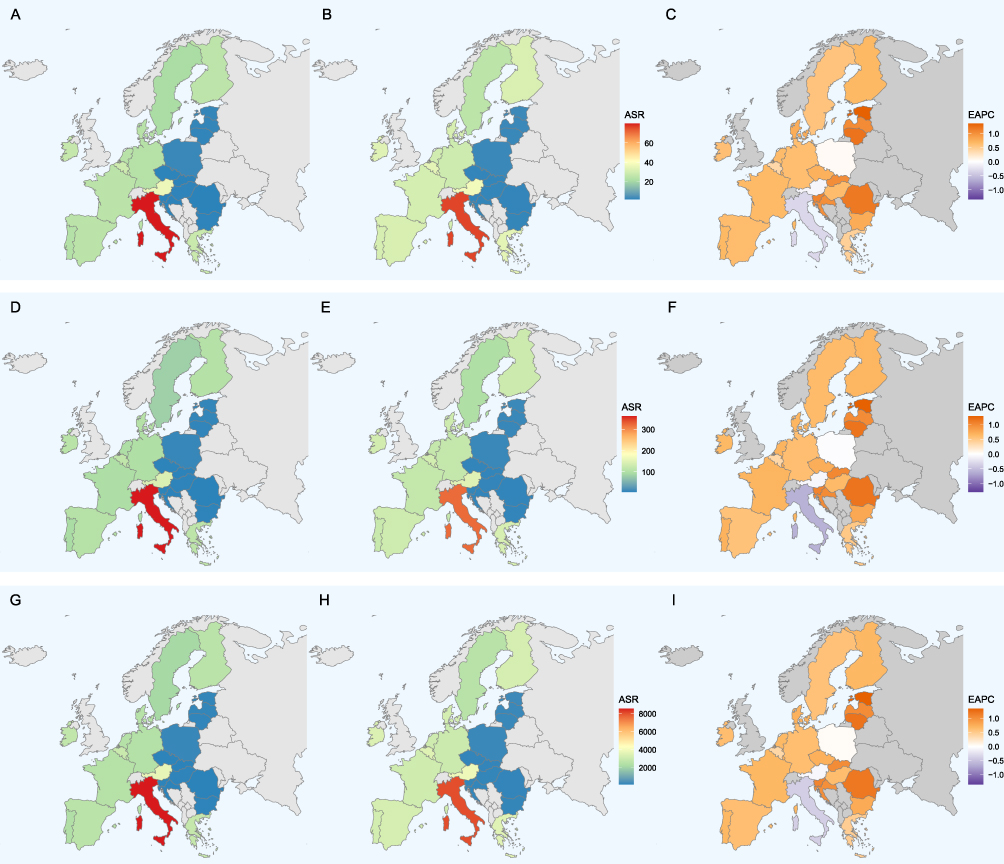 |
Figure 1 Spatial distribution of PCOS burden across EU countries. (A and B) ASDR in 1990 and 2023; (C) EAPC of ASDR from 1990 to 2023. (D and E) ASIR; (F) EAPC of ASIR. (G and H) ASPR; (I) EAPC of ASPR. |
EAPCs for ASIR varied markedly across countries during 1990–2023. Estonia showed the largest increase (EAPC 1.28; 95% CI: 1.19–1.38), whereas Italy showed the largest decrease (EAPC −0.59; 95% CI: −0.72 to −0.45) (Figure 1F). Similar patterns of cross-country variation were observed for DALYs and prevalence (Figure 1A–C and G–I). For ASDR and ASPR, Italy consistently had the highest ASRs in both 1990 and 2023, while Romania had the lowest. Estonia showed the largest increases in both ASDR (EAPC 1.35; 95% CI: 1.25–1.45) and ASPR (EAPC 1.35; 95% CI: 1.25–1.45), whereas Italy showed the largest decreases (ASDR EAPC −0.32; 95% CI: −0.43 to −0.21; ASPR EAPC −0.38; 95% CI: −0.50 to −0.26).
Associations with SDI, HDI, and UHC within the EU
At the regional level, PCOS ASIR showed a clear gradient across global SDI quintiles, with higher SDI quintiles generally corresponding to higher ASIR. Several high-income regions (eg, Australasia, high-income Asia Pacific, high-income North America, and Western Europe) exhibited relatively high ASIR (Figure S2 and Tables S6, S7). ASDR and ASPR followed similar distribution patterns and temporal trends (Figures S3 and S4). We then assessed associations between PCOS burden and SDI within EU member states, with HDI and UHC included as complementary indicators for consistency validation.
As shown in Figure 2, SDI was positively correlated with ASRs at the EU country level: ASDR (r = 0.362, P < 0.001), ASIR (r = 0.348, P < 0.001), and ASPR (r = 0.358, P < 0.001). HDI showed consistent directions, with r values of 0.418, 0.403, and 0.414 for ASDR, ASIR, and ASPR, respectively (all P < 0.001). UHC was similarly correlated, with r values of 0.322, 0.313, and 0.320 for ASDR, ASIR, and ASPR, respectively (all P < 0.001). Raw country-level values for ASRs and the three indices are provided in Table S8.
 |
Figure 2 Correlations of PCOS burden with SDI in EU countries (A–C), with HDI (D–F) and UHC (G–I) as complementary indicators. Pearson r and p values are shown. |
SEV Correlation Screening for PCOS Burden
To identify specific risk exposures associated with PCOS burden, we applied expert-informed screening to the 68 candidate SEVs (exclusion rationale provided in Table S9). Pearson correlation analyses were performed between each retained SEV and the country-level incidence burden, with P values adjusted using the Benjamini–Hochberg procedure. To examine the consistency of these associations across burden metrics, parallel analyses were additionally conducted for prevalence and DALYs, and the complete results for all three indicators, including non-significant associations, are provided in Table S10. After adjustment and cross-metric evaluation, eight SEVs were prioritized from the incidence analysis (Table 2).
 |
Table 2 SEVs Prioritized from the ASIR-Based Correlation Screening for PCOS Burden |
Positively correlated SEVs were childhood sexual abuse (r = 0.519, P_adj = 0.0376) and nitrogen dioxide pollution (r = 0.508, P_adj = 0.0376). Negatively correlated SEVs were diet low in fruits (r = −0.713, P_adj = 0.00101), household air pollution from solid fuels (r = −0.572, P_adj = 0.0267), diet low in nuts and seeds (r = −0.559, P_adj = 0.0267), diet high in sodium (r = −0.508, P_adj = 0.0376), secondhand smoke (r = −0.482, P_adj = 0.0483), and chewing tobacco (r = −0.478, P_adj = 0.0483). These inverse associations likely reflect collinearity among social development, lifestyle patterns, and diagnostic practices rather than true biological protective effects.
Exposure-Profile Clustering Based on Ranked SEVs
Across EU countries, ASIR did not display a smooth gradient but appeared in several clearly separated color bands. Figure S5 indicates a truncated distribution of PCOS ASIR within the EU, supporting dichotomization into a high-ASIR group (including Italy and Sweden) and a low-ASIR group (including Estonia and Czechia).
Based on this dichotomization, countries were ranked from highest to lowest exposure for each SEV, with smaller ranks indicating higher relative exposure within the EU. A rank-based heatmap was constructed, and Ward.D2 hierarchical clustering was applied simultaneously to countries and SEVs (Figure 3). Countries separated into “High” and “Low” clusters on the dendrogram, corresponding to the high- and low-ASIR groups. As shown in Table 2, among the eight significant SEVs, childhood sexual abuse and nitrogen dioxide pollution exhibited the most consistent and contrasting patterns between country groups. These two exposures generally showed smaller ranks (higher exposure) in the “High” group and larger ranks (lower exposure) in the “Low” group, producing clear stratification. The remaining SEVs showed more dispersed rank distributions without group-wise differences consistently aligned with the ASIR-based classification. Together with macro-level SDI associations, these findings highlight exposure profile features that distinguish high- and low-incidence EU countries and prioritize candidate exposures associated with PCOS burden.
 |
Figure 3 Ranked heatmap of the eight significant SEVs across 27 EU countries with Ward.D2 hierarchical clustering. |
Mendelian Randomization
To evaluate whether risk exposures identified from GBD-based ecological analyses have individual-level causal effects, we conducted two-sample Mendelian randomization. For the outcome, we used IEU OpenGWAS dataset ebi-a-GCST90044902 (phenotype: polycystic ovary syndrome [adjusted for age]; total sample size = 141,355; cases/controls = 797/140,558; European ancestry).29 For the exposure, we used ukb-b-2618 (phenotype: nitrogen dioxide air pollution; 2005; sample size = 456,380; European ancestry), 30 corresponding to the GBD SEV “nitrogen dioxide pollution.” No suitable GWAS dataset was available for childhood sexual abuse.
As shown in Figure 4 and Table S11, IVW analysis indicated that genetically predicted higher NO2 exposure was associated with increased PCOS risk (OR = 6.60, 95% CI: 1.85–23.58; P = 0.00365). The SNP-specific associations and fitted causal lines across MR methods are visualized in the MR scatter plot (Figure S6). The weighted median method yielded a consistent direction (OR = 7.57, 95% CI: 1.41–40.52; P = 0.0181). MR-Egger showed an opposite direction and was not statistically significant (OR = 0.027, 95% CI: 0.000047–16.06; P = 0.290); simple mode and weighted mode estimates were also not significant (P = 0.115 and P = 0.114, respectively).
 |
Figure 4 Single-SNP and IVW Mendelian randomization estimates for the effect of NO2 on PCOS risk, shown as odds ratios with 95% CIs. |
Sensitivity analyses did not indicate substantial violations of MR assumptions. Heterogeneity testing showed no significant heterogeneity (IVW Cochran’s Q = 14.98, P = 0.309; MR-Egger Q = 12.03, P = 0.444) (Table S12). The MR-Egger intercept test did not suggest directional horizontal pleiotropy (intercept = 0.0769, SE = 0.0448; P = 0.112) (Table S13). The MR-PRESSO global test did not indicate significant horizontal pleiotropy or outlier influence (RSSobs = 17.51, P = 0.309) (Table S14). The Steiger directionality test supported causal direction from NO2 to PCOS (Steiger P = 4.07 × 10⁻¹¹) (Table S15). The funnel plot showed no marked asymmetry (Figure S7), and leave-one-out analyses indicated that the overall effect direction remained consistent after removing any single SNP (Figure S8), suggesting findings were not driven by a single instrumental variant.
Discussion
In this study, we systematically compared the global and EU burden of PCOS within the GBD framework and characterized substantial spatial heterogeneity across EU countries. The EU consistently showed higher ASIR than the global level but a smaller long-term growth rate, suggesting that within a high-development setting, cross-country differences in PCOS burden are likely shaped by health system factors (eg, diagnostic accessibility, health care utilization, and case ascertainment intensity) combined with potentially modifiable exposure patterns. ASIR was positively correlated with SDI, HDI, and UHC within the EU. This macro-level association more plausibly reflects differences in detection and reporting rather than a direct biological effect of development, highlighting the need to examine specific exposures and system-level determinants to explain burden stratification.
To move beyond macro indicators, we incorporated the GBD summary exposure value (SEV) and identified eight exposures significantly associated with incidence burden among 68 candidates. Childhood sexual abuse and nitrogen dioxide pollution showed the most consistent stratification between high- and low-ASIR country groups. Nitrogen dioxide pollution emerged as the most consistently prioritized candidate exposure given its stable association pattern and subsequent MR support. However, SEV is a population-level summary metric rather than a direct measure of individual exposure, and NO2 should be interpreted primarily as an indicator of traffic-related air pollution rather than as an isolated environmental agent.
Prior individual-level studies have linked air pollution to PCOS risk. A nationwide Taiwanese cohort linking health insurance records with air quality monitoring reported significantly increased PCOS risk under higher NO2 exposure.27 A Korean population-based cohort observed that both NO2 exposure levels and duration were associated with higher PCOS risk.28 A US cohort assessing residential air pollution across preconception, gestation, and childhood windows identified PCOS outcomes during follow-up, suggesting that early-life exposure may be relevant and that sensitive windows may exist.10 At the ecological level, a global analysis integrating GBD outcomes with multi-pollutant databases reported a positive association between NO2 and PCOS ASIR, with suggested nonlinearity, while jointly considering temperature change and other factors.29
Mechanistically, NO2 serves as a marker of traffic-related air pollution and has been linked to oxidative stress and inflammatory responses.30 PCOS is commonly characterized by chronic low-grade inflammation; a pro-oxidative and pro-inflammatory milieu induced by air pollution may therefore exacerbate reproductive-endocrine dysregulation.29 33 Air pollution may also interfere with insulin signaling and promote insulin resistance, a central metabolic component of PCOS,31 Insulin resistance is closely related to hyperinsulinemia, disrupted ovarian steroidogenesis, and hyperandrogenic phenotypes, providing a biologically coherent pathway linking NO2 exposure to PCOS risk.32 This mechanistic interpretation is also compatible with prior clinical evidence indicating that insulin resistance in PCOS is associated with ovarian morphological changes. Gencer et al further reported that concomitant Hashimoto’s thyroiditis did not simply amplify ovarian volume abnormalities overall, but may contribute to phenotypic heterogeneity in the ovarian manifestation of PCOS, suggesting that environmental exposures may operate against a background of metabolic and autoimmune susceptibility.11 Broader gynecologic and reproductive health consensus statements emphasize that environmental exposures, including air pollution, can influence hormonal function and ovarian reserve, supporting the incorporation of environmental determinants into women’s life-course health strategies.33 Our MR analysis provided additional genetically informed evidence supporting an association between higher genetically predicted NO2 exposure and increased PCOS risk, with sensitivity analyses broadly supporting robustness. However, this result should be interpreted under the core assumptions of Mendelian randomization, namely relevance, independence, and exclusion restriction. Although weak instruments were excluded and sensitivity analyses were conducted, residual bias from horizontal pleiotropy, population structure, or associations between the selected instruments and correlated environmental or socioeconomic traits cannot be fully excluded. Therefore, the MR finding is better viewed as supportive evidence consistent with a possible causal signal than as definitive proof of a direct environmental effect. Importantly, the MR effect estimate should not be directly translated into a real-world risk increase per measured unit of ambient NO2 concentration, because genetically proxied exposure may reflect lifelong liability or exposure propensity rather than short-term environmental increments.
One methodological contribution of this work is a reproducible analytic workflow. Because GBD does not provide PCOS-specific attributable risk estimates, we combined macro-level stratification, SEV-based screening, exposure-profile comparison, and MR as a complementary line of evidence for selected exposures. This workflow is intended to organize cross-country differences in burden into interpretable candidate exposure sets that may help inform hypothesis generation and regional priority setting. The high–low ASIR grouping was used for descriptive profiling and should not be interpreted as a clinical cutoff or as evidence of causality. Accordingly, this framework is more suitable for exposure prioritization and hypothesis generation than for direct causal policy attribution.
Childhood sexual abuse showed the clearest exposure-profile stratification between high- and low-ASIR country groups, suggesting that psychosocial and trauma-related exposures may contribute to heterogeneity within the EU.34 Childhood maltreatment and trauma are associated with altered hypothalamic–pituitary–adrenal (HPA) axis functioning; chronic stress dysregulation may increase PCOS risk through effects on metabolic inflammation and reproductive endocrine regulation.35 Small clinical studies have suggested that childhood abuse or neglect may be associated with the presence or worsening of PCOS-related features, supporting this exposure as a priority signal for validation.36 However, owing to the lack of suitable GWAS datasets, we could not perform genetic causal inference for childhood sexual abuse. The current evidence should therefore be interpreted as an ecological and literature-supported hypothesis signal rather than a confirmed causal factor, and it warrants validation in larger cohorts, mechanistic studies, and future genetic analyses when suitable datasets become available. Although several diet- and tobacco-related SEVs reached statistical significance in correlation screening, their discriminatory consistency was weaker in cluster-based profiling. The observed inverse associations more likely reflect collinearity with national-level lifestyle structures, social behavior patterns, and diagnostic accessibility rather than true biological protective effects.
To provide broader geographic context and support external comparison, we mapped the global distribution of the eight significant SEVs across 204 countries and territories (Figure S9). Childhood sexual abuse and nitrogen dioxide pollution showed moderate-to-high exposure levels in the EU, North America, and Latin America, yet their spatial patterns diverged substantially elsewhere. Nitrogen dioxide pollution was higher in many Asian and Middle Eastern countries and lower in much of Africa, whereas childhood sexual abuse showed an opposite pattern. These differences suggest that exposure profiles may vary across regions and therefore warrant region-specific validation before any policy interpretation.
This study has several limitations. First, all GBD- and SEV-based analyses were conducted at the country level and were not validated in clinical cohorts or multi-center individual-level databases, limiting etiologic stratification and mechanistic inference. Accordingly, the observed associations should be interpreted as ecological patterns rather than individual-level exposure–disease relationships, and ecological fallacy cannot be excluded. Second, SEV provides only a summary representation of population-level exposure and cannot capture individual exposure timing, cumulative dose, residential mobility, or mixed-pollutant interactions. Third, although the SDI findings were directionally consistent with those for HDI and UHC, both indices comprise multiple subdimensions and tracer indicators that were not decomposed in the present analysis; therefore, we cannot determine whether education, income, access, or service quality plays the most critical role within the EU. Fourth, owing to data availability, MR validation was conducted only for NO2, and the potential effect of childhood sexual abuse remains supported by ecological associations and literature-based plausibility rather than genetic causal inference. Fifth, although stringent instrument selection was applied, residual pleiotropy and unmeasured confounding related to genetically proxied environmental exposures cannot be completely ruled out. Accordingly, our findings are better suited for prioritizing candidate exposures and generating testable hypotheses than for making definitive causal or interventional claims.
Conclusion
Using GBD 2023 data from 1990 to 2023, this study characterized PCOS burden across 27 European Union member states and identified potential drivers of cross-country heterogeneity. The EU showed consistently higher age-standardized incidence than the global level, with substantial variation across countries even within a high-development setting. SEV-based screening prioritized nitrogen dioxide (NO2) pollution and childhood sexual abuse as the exposures most consistently distinguishing high- from low-incidence countries, and two-sample Mendelian randomization provided evidence consistent with a causal signal for NO2 under standard MR assumptions. These findings suggest that air pollution control may merit consideration in regional strategies for women’s reproductive health. Validation in clinical cohorts is needed to further investigate trauma-related exposures and to identify actionable intervention windows.
Data Sharing Statement
Disease burden estimates were obtained from the Global Burden of Disease Study 2023 (GBD 2023) and are publicly available through the GBD Results Tool. Socioeconomic indicators, including the Socio-demographic Index (SDI), Human Development Index (HDI), and Universal Health Coverage (UHC) service coverage index, were retrieved from corresponding public databases. Summary-level GWAS data used for Mendelian randomization analyses are available from the IEU OpenGWAS platform under the dataset identifiers ebi-a-GCST90044902 and ukb-b-2618.
Ethical Approval
This study used publicly available, de-identified, summary-level data from the Global Burden of Disease (GBD) 2023 database and the IEU OpenGWAS platform and did not involve direct contact with human participants or access to identifiable personal information. Ethical review for this study was exempted by the Cixi Maternal and Child Health Hospital Ethics Review Committee, as documented in the institutional exemption notice dated January 30, 2026. This exemption is consistent with Article 32, Items (1) and (2), of the Measures for Ethical Review of Life Science and Medical Research Involving Human Subjects issued in China on February 18, 2023.
Acknowledgments
We appreciate the excellent works by the Global Burden of Disease Study 2023 collaborators.
Author Contributions
Shengnan Lu is the first author. All authors made a significant contribution to the work reported, whether that is in the conception, study design, execution, acquisition of data, analysis and interpretation, or in all these areas; took part in drafting, revising or critically reviewing the article; gave final approval of the version to be published; have agreed on the journal to which the article has been submitted; and agree to be accountable for all aspects of the work.
Funding
This work was supported by the Cixi Public Welfare Science and Technology Program (Grant No. CN2024016).
Disclosure
The authors report no conflicts of interest in this work.
References
1. Rotterdam ESHRE/ASRM-Sponsored PCOS consensus workshop group. Revised 2003 consensus on diagnostic criteria and long-term health risks related to polycystic ovary syndrome (PCOS). Hum Reprod. 2004;19(1):41–13. doi:10.1093/humrep/deh098
2. Dong J, Rees DA. Polycystic ovary syndrome: pathophysiology and therapeutic opportunities. BMJ Med. 2023;2(1):e000548. doi:10.1136/bmjmed-2023-000548
3. Day F, Karaderi T, Jones MR, et al. Large-scale genome-wide meta-analysis of polycystic ovary syndrome suggests shared genetic architecture for different diagnosis criteria. PLoS Genet. 2018;14(12):e1007813. doi:10.1371/journal.pgen.1007813
4. Bozdag G, Mumusoglu S, Zengin D, Karabulut E, Yildiz BO. The prevalence and phenotypic features of polycystic ovary syndrome: a systematic review and meta-analysis. Hum Reprod. 2016;31(12):2841–2855. doi:10.1093/humrep/dew218
5. Yilmaz B, Vellanki P, Ata B, Yildiz BO. Metabolic syndrome, hypertension, and hyperlipidemia in mothers, fathers, sisters, and brothers of women with polycystic ovary syndrome: a systematic review and meta-analysis. Fertil Steril. 2018;109(2):356–64.e32. doi:10.1016/j.fertnstert.2017.10.018
6. Barry JA, Kuczmierczyk AR, Hardiman PJ. Anxiety and depression in polycystic ovary syndrome: a systematic review and meta-analysis. Hum Reprod. 2011;26(9):2442–2451. doi:10.1093/humrep/der197
7. Brutocao C, Zaiem F, Alsawas M, Morrow AS, Murad MH, Javed A. Psychiatric disorders in women with polycystic ovary syndrome: a systematic review and meta-analysis. Endocrine. 2018;62(2):318–325. doi:10.1007/s12020-018-1692-3
8. Teede HJ, Tay CT, Laven JJE, et al. Recommendations from the 2023 international evidence-based guideline for the assessment and management of polycystic ovary syndrome. J Clin Endocrinol Metab. 2023;108(10):2447–2469. doi:10.1210/clinem/dgad463
9. Kazemi M, Kim JY, Wan C, et al. Comparison of dietary and physical activity behaviors in women with and without polycystic ovary syndrome: a systematic review and meta-analysis of 39 471 women. Hum Reprod Update. 2022;28(6):910–955. doi:10.1093/humupd/dmac023
10. Peebles E, Mitsunami M, Zhang B, et al. Preconception, gestation, and childhood exposure to air pollution and risk of polycystic ovary syndrome (PCOS) in a US girls cohort study. Environ Int. 2025;205:109885. doi:10.1016/j.envint.2025.109885
11. Gencer G, Serin AN, Gencer K. Analysis of the effect of hashimoto’s thyroiditis and insulin resistance on ovarian volume in patients with polycystic ovary syndrome. BMC Womens Health. 2023;23(1):86. doi:10.1186/s12905-023-02200-x
12. Zeng W, Gan D, Ou J, Tomlinson B. Global trends and health system impact on polycystic ovary syndrome: a comprehensive analysis of age-stratified females from 1990 to 2021. Front Reprod Health. 2025;7:1642369. doi:10.3389/frph.2025.1642369
13. Collaborators GBDRF. Global, regional, and national comparative risk assessment of 79 behavioural, environmental and occupational, and metabolic risks or clusters of risks, 1990–2015: a systematic analysis for the Global Burden of Disease Study 2015. Lancet. 2016;388(10053):1659–1724. doi:10.1016/S0140-6736(16)31679-8
14. GBD 2023 Disease and Injury and Risk Factor Collaborators. Burden of 375 diseases and injuries, risk-attributable burden of 88 risk factors, and healthy life expectancy in 204 countries and territories, including 660 subnational locations, 1990–2023: a systematic analysis for the Global Burden of Disease Study 2023. Lancet. 2025;406(10513):1873–1922.
15. GBD 2019 Diseases and Injuries Collaborators. Global burden of 369 diseases and injuries in 204 countries and territories, 1990–2019: a systematic analysis for the Global Burden of Disease Study 2019. Lancet. 2020;396(10258):1204–1222. doi:10.1016/S0140-6736(20)30925-9
16. Fay MP, Tiwari RC, Feuer EJ, Zou Z. Estimating average annual percent change for disease rates without assuming constant change. Biometrics. 2006;62(3):847–854. doi:10.1111/j.1541-0420.2006.00528.x
17. Liu J, Wang K. China diverges from global trends in a 30 year comparative analysis and future projections of ischemic heart disease burden attributable to high LDL cholesterol. Discov Public Health. 2025;22(1). doi:10.1186/s12982-025-00791-4
18. Kim HJ, Fay MP, Feuer EJ, Midthune DN. Permutation tests for joinpoint regression with applications to cancer rates. Stat Med. 2000;19(3):335–351. doi:10.1002/(SICI)1097-0258(20000215)19:3<335::AID-SIM336>3.0.CO;2-Z
19. Benjamini Y, Hochberg Y. Controlling the false discovery rate: a practical and powerful approach to multiple testing. J R Stat Soc Series B. 2018;57(1):289–300. doi:10.1111/j.2517-6161.1995.tb02031.x
20. Hemani G, Zheng J, Elsworth B, et al. The MR-base platform supports systematic causal inference across the human phenome. Elife. 2018;7. doi:10.7554/eLife.34408
21. Burgess S, Davey Smith G, Davies NM, et al. Guidelines for performing Mendelian randomization investigations: update for summer 2023. Wellcome Open Res. 2019;4:186. doi:10.12688/wellcomeopenres.15555.1
22. Bowden J, Davey Smith G, Burgess S. Mendelian randomization with invalid instruments: effect estimation and bias detection through Egger regression. Int J Epidemiol. 2015;44(2):512–525. doi:10.1093/ije/dyv080
23. Bowden J, Davey Smith G, Haycock PC, Burgess S. Consistent estimation in Mendelian Randomization with some invalid instruments using a weighted median estimator. Genet Epidemiol. 2016;40(4):304–314. doi:10.1002/gepi.21965
24. Hartwig FP, Davey Smith G, Bowden J. Robust inference in summary data Mendelian randomization via the zero modal pleiotropy assumption. Int J Epidemiol. 2017;46(6):1985–1998. doi:10.1093/ije/dyx102
25. Verbanck M, Chen CY, Neale B, Do R. Detection of widespread horizontal pleiotropy in causal relationships inferred from Mendelian randomization between complex traits and diseases. Nat Genet. 2018;50(5):693–698. doi:10.1038/s41588-018-0099-7
26. Hemani G, Tilling K, Davey Smith G. Orienting the causal relationship between imprecisely measured traits using GWAS summary data. PLoS Genet. 2017;13(11):e1007081. doi:10.1371/journal.pgen.1007081
27. Lin SY, Yang YC, Chang CY, et al. Risk of polycystic ovary syndrome in women exposed to fine air pollutants and acidic gases: a Nationwide Cohort Analysis. Int J Environ Res Public Health. 2019;16(23):4816. doi:10.3390/ijerph16234816
28. Kim JH, Hong SH, Moon NL, Kang DR. Effects of exposure duration and exposure levels of ambient air pollutants on the risk of polycystic ovarian syndrome: a 2015–2019 Korean Population-Based Cohort Study. Toxics. 2022;10(9):542. doi:10.3390/toxics10090542
29. Chen Y, Dai Y, Qian J, et al. Potential impact of air pollution on polycystic ovary syndrome incidence: a global analysis of 171 countries and regions from 1990 to 2021. J Ovarian Res. 2025;18(1):198. doi:10.1186/s13048-025-01777-1
30. Lu C, Wang F, Liu Q, Deng M, Yang X, Ma P. Effect of NO(2) exposure on airway inflammation and oxidative stress in asthmatic mice. J Hazard Mater. 2023;457:131787. doi:10.1016/j.jhazmat.2023.131787
31. Zhao H, Zhang J, Cheng X, Nie X, He B. Insulin resistance in polycystic ovary syndrome across various tissues: an updated review of pathogenesis, evaluation, and treatment. J Ovarian Res. 2023;16(1):9. doi:10.1186/s13048-022-01091-0
32. Saleem A, Awan T, Akhtar MF. A comprehensive review on endocrine toxicity of gaseous components and particulate matter in smog. Front Endocrinol. 2024;15:1294205. doi:10.3389/fendo.2024.1294205
33. DeNicola N, Zhang J, Hasenburg A, et al. FIGO committee opinion: environmental drivers of gynecologic and reproductive health. Int J Gynaecol Obstet. 2025;171(3):1008–1021. doi:10.1002/ijgo.70547
34. Sharma A, Chaudhary V, Bakshi RK, Devi NK, Saraswathy KN. Adverse childhood experiences and risk of polycystic ovary syndrome among young adult females from Delhi NCR, India. Discov Public Health. 2025;22(1). doi:10.1186/s12982-025-00628-0
35. Schar S, Murner-Lavanchy I, Schmidt SJ, Koenig J, Kaess M. Child maltreatment and hypothalamic-pituitary-adrenal axis functioning: a systematic review and meta-analysis. Front Neuroendocrinol. 2022;66:100987. doi:10.1016/j.yfrne.2022.100987
36. Misra A, Wolfe O, Azziz R. The impact of childhood abuse and neglect on the development of features of polycystic ovary syndrome: a pilot study. Womens Health Rep. 2025;6(1):412–420.
 © 2026 The Author(s). This work is published and licensed by Dove Medical Press Limited. The
full terms of this license are available at https://www.dovepress.com/terms
and incorporate the Creative Commons Attribution
- Non Commercial (unported, 4.0) License.
By accessing the work you hereby accept the Terms. Non-commercial uses of the work are permitted
without any further permission from Dove Medical Press Limited, provided the work is properly
attributed. For permission for commercial use of this work, please see paragraphs 4.2 and 5 of our Terms.
© 2026 The Author(s). This work is published and licensed by Dove Medical Press Limited. The
full terms of this license are available at https://www.dovepress.com/terms
and incorporate the Creative Commons Attribution
- Non Commercial (unported, 4.0) License.
By accessing the work you hereby accept the Terms. Non-commercial uses of the work are permitted
without any further permission from Dove Medical Press Limited, provided the work is properly
attributed. For permission for commercial use of this work, please see paragraphs 4.2 and 5 of our Terms.