Back to Journals » OncoTargets and Therapy » Volume 9
Identifying module biomarkers from gastric cancer by differential correlation network
Received 21 May 2016
Accepted for publication 30 July 2016
Published 19 September 2016 Volume 2016:9 Pages 5701—5711
DOI https://doi.org/10.2147/OTT.S113281
Checked for plagiarism Yes
Review by Single anonymous peer review
Peer reviewer comments 4
Editor who approved publication: Dr William C. Cho
Xiaoping Liu,1–3,* Xiao Chang1,3,*
1College of Statistics and Applied Mathematics, Anhui University of Finance and Economics, Bengbu, Anhui Province, People’s Republic of China; 2Key Laboratory of Systems Biology, Shanghai Institutes for Biological Sciences, Chinese Academy of Sciences, Shanghai, People’s Republic of China; 3Collaborative Research Center for Innovative Mathematical Modeling, Institute of Industrial Science, University of Tokyo, Tokyo, Japan
*These authors contributed equally to this work
Abstract: Gastric cancer (stomach cancer) is a severe disease caused by dysregulation of many functionally correlated genes or pathways instead of the mutation of individual genes. Systematic identification of gastric cancer biomarkers can provide insights into the mechanisms underlying this deadly disease and help in the development of new drugs. In this paper, we present a novel network-based approach to predict module biomarkers of gastric cancer that can effectively distinguish the disease from normal samples. Specifically, by assuming that gastric cancer has mainly resulted from dysfunction of biomolecular networks rather than individual genes in an organism, the genes in the module biomarkers are potentially related to gastric cancer. Finally, we identified a module biomarker with 27 genes, and by comparing the module biomarker with known gastric cancer biomarkers, we found that our module biomarker exhibited a greater ability to diagnose the samples with gastric cancer.
Keywords: biomarkers, gastric cancer, stomach cancer, differential network
Introduction
Gastric cancer (stomach cancer), the second most deadly cancer around the world,1 is prevalent in East Asia, Eastern Europe, and Central and South America. In the US, about 21,500 cases of gastric cancer were diagnosed in 2008.2 However, the mechanism of gastric cancer is not yet clear. Systematic identification of gastric cancer genes can provide insights into the process of tumorigenesis of this deadly disease. Here, cancer-related genes refer to those genes the dysfunctions or mutations of which are causally implicated in cancer.3 However, it is now a well-recognized fact that cancer is not caused by individual genes but by an entire system or network, which involves many correlated genes and dynamic processes. The procedure of identifying cancer-related genes through biological experiments is notoriously difficult and time-consuming.3,4 Nowadays, many computational methods are available to predict cancer-related genes,5,6 most of which focus on the differential expression of genes and static regulation relations between genes7,8 while ignoring the dynamic regulations or network rewiring between molecules at different disease stages. So a dynamic method that depicts the dynamic variety of regulation between molecules will uncover crucial information that cannot be detected in static conditions.9,10 Generally, the regulations or interactions between molecules change dynamically at different times or in different tissues, which are causally related to the disease progression. As the regulations between molecules are changed at different times or in different tissues, these molecules, which interact with different targets on the molecular interaction network, will show a potential correlation with the disease. Therefore, new potential cancer genes can be detected by taking into account the dynamic regulations and network rewiring between molecules, which may have been ignored when investigating differential expressions only9,10 in the previous studies.
In this paper, a novel network-based approach is presented to predict gastric cancer genes by investigating dynamic interactions and network rewiring between molecules. In particular, we assume that the dysfunction or network rewiring of the correlation networks found in people suffering from cancer is possibly related to tumorigenesis or carcinogenesis. Utilizing gene expression to filter genes expressing differently for recognizing rewired networks can improve the power of distinguishing between the normal and cancer samples. As results, we predict 27 gastric cancer genes based on analysis of microarray data of 160 clinic samples. Moreover, results with these 27 genes on three independent validation datasets demonstrate that these genes can be used as effective biomarkers to detect gastric cancers efficiently.
Materials and methods
Gene expression profiles, correlation coefficient, and differential expression
The gene expression profiles for gastric cancer were obtained from the Gene Expression Omnibus (GEO) database (ID: GSE27342). It contains 160 samples from 80 cancer tissues and their adjacent noncancerous tissues of 80 nontreated gastric cancer patients. All gene expression profiles were normalized by the robust multiarray averaging (RMA) method and the probe sets were mapped to the corresponding gene symbols, omitting the nonmapped probe sets. The expression value of a gene symbol was calculated by averaging the expression values of probe sets of this gene symbol. The clinic information for the stage status of samples. The information about stage of gastric cancer was obtained from the original paper of the dataset.11 Since there were fewer samples in Stage I and II than the other stages, the four stages of expression profiles were combined into three phases (Table 1). So, we considered that there were eleven samples in the early phase of gastric cancer from the combination of Stage I and II, 54 samples in the middle phase of gastric cancer from stage III, and 15 samples in the late phase of gastric cancer from stage IV (Table 1). The information for the patients was also included in Table 1. The human network was constructed by calculating the Pearson correlation coefficient (PCC) between any two genes in the dataset; each P-value of PCC was corrected by the false discovery rate (FDR) and the gene pairs with corrected P-value of PCC <0.05 were chosen as the edges of the correlation network. In contrast, if the corrected P-value of PCC for the gene pairs was >0.05, the edges for the gene pairs were ignored in the correlation network. The differentially expressed genes were tested by the P-value of Student’s t-test between normal and cancer samples. If the P-value of a gene for Student’s t-test was <0.05, then the gene would be considered as a differential expressed gene between normal and cancer status. If the P-value of a gene for the Student’s t-test is more than 0.05, then the gene would be considered as a non-differential expressed gene between normal and cancer status.
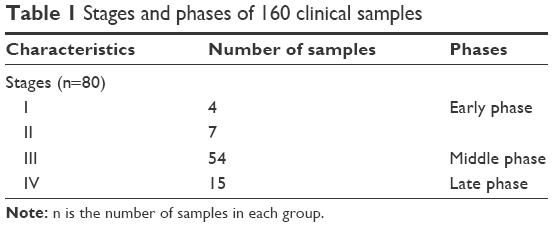 | Table 1 Stages and phases of 160 clinical samples |
For calculating the PCC and Student’s t-test, a free package named “scipy” (https://www.scipy.org/) for python programming language (https://www.python.org/) was employed, and it calculated the P-value of PCC and t-test. The FDR correction for P-value was done by the “stats” package in R programming language.12
Differential network and candidate biomarker genes
The gene expression profiles were divided into three phases based on the stages of gastric cancer, as shown in Table 1; in every phase, the gene expression profiles were divided into two groups of normal and cancer, and each group only contained normal or cancer samples in this phase. The correlation coefficient of each interaction within the correlation network was calculated based on the samples of every group. The highly correlated edges were reserved, and lowly correlated edges were deleted. The highly correlated edges were able to identify the interactions among nodes at the corresponding phenotypes. The correlation network was rewired based on these highly correlated edges from the normal and cancer samples individually. The new correlation networks were called network in normal and network in cancer, and are shown in Figure 1. The correlation coefficient threshold value was set to FDR corrected P-value ≤0.05, and was used to divide the highly correlated edges and lowly correlated edges. The context-specific network will only keep the highly correlated edges in the network. The differential network between normal and cancer samples could show the dynamic changes of interactions between the two samples. The normal-specific and cancer-specific networks were individually built by removing the common edges of correlation network in normal and cancer status. The differential networks were formed to combine the normal-specific and cancer-specific networks (Figure 1).
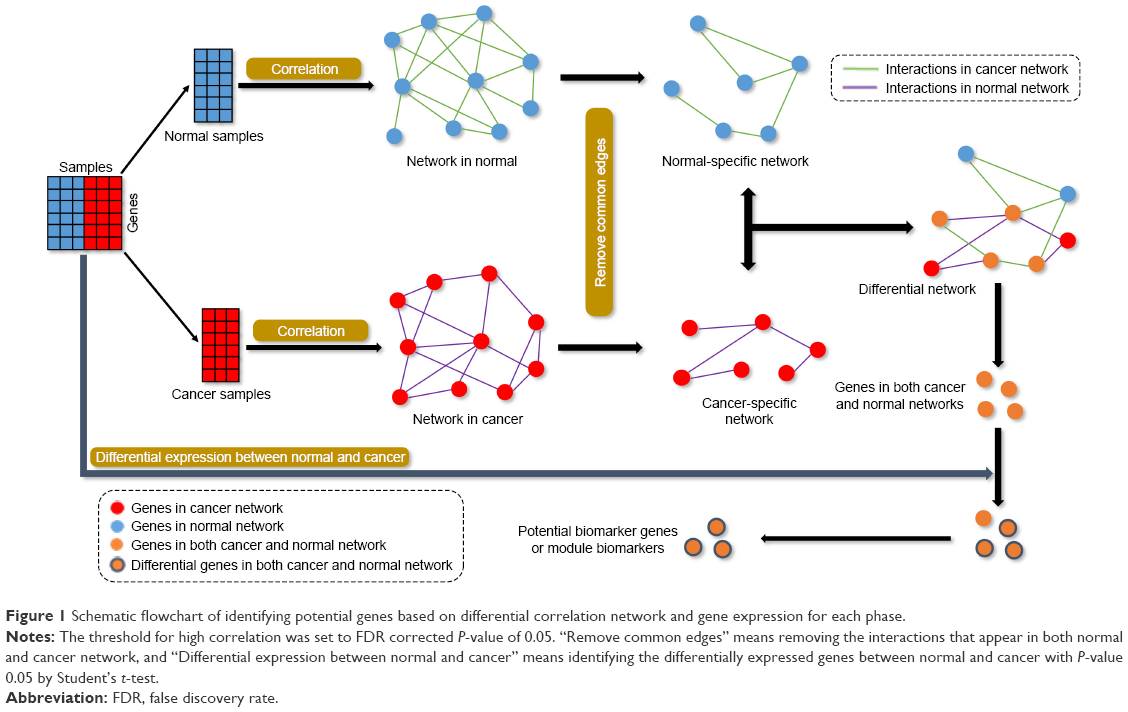 | Figure 1 Schematic flowchart of identifying potential genes based on differential correlation network and gene expression for each phase. |
Every edge in the differential network represents the dynamic interaction between the normal and cancer samples, and the edges in the differential network only appear at one phenotype of normal or cancer samples. The disease-related genes were the common genes in both the normal-specific and cancer-specific networks. These genes appear in both normal-specific and cancer-specific network. It is highly possible that these genes play crucial roles in the transformation from normal to cancer status. Then, the differentially expressed genes were detected by P-value of 0.05 obtained by Student’s t-test, and the genes in the differential network were filtered by the differential expressed genes to obtain the potential biomarker genes or module biomarkers for each phase (Figure 1). The common members of the intersection genes at the three phases of gastric cancer were obtained and regarded as candidate biomarker genes or module biomarkers (Figure 2). The candidate biomarker genes or module biomarkers stably appear in the differential network of every phase and always connect with both normal-specific and cancer-specific networks, and these indicate their important dysfunctions from normal to cancer status.
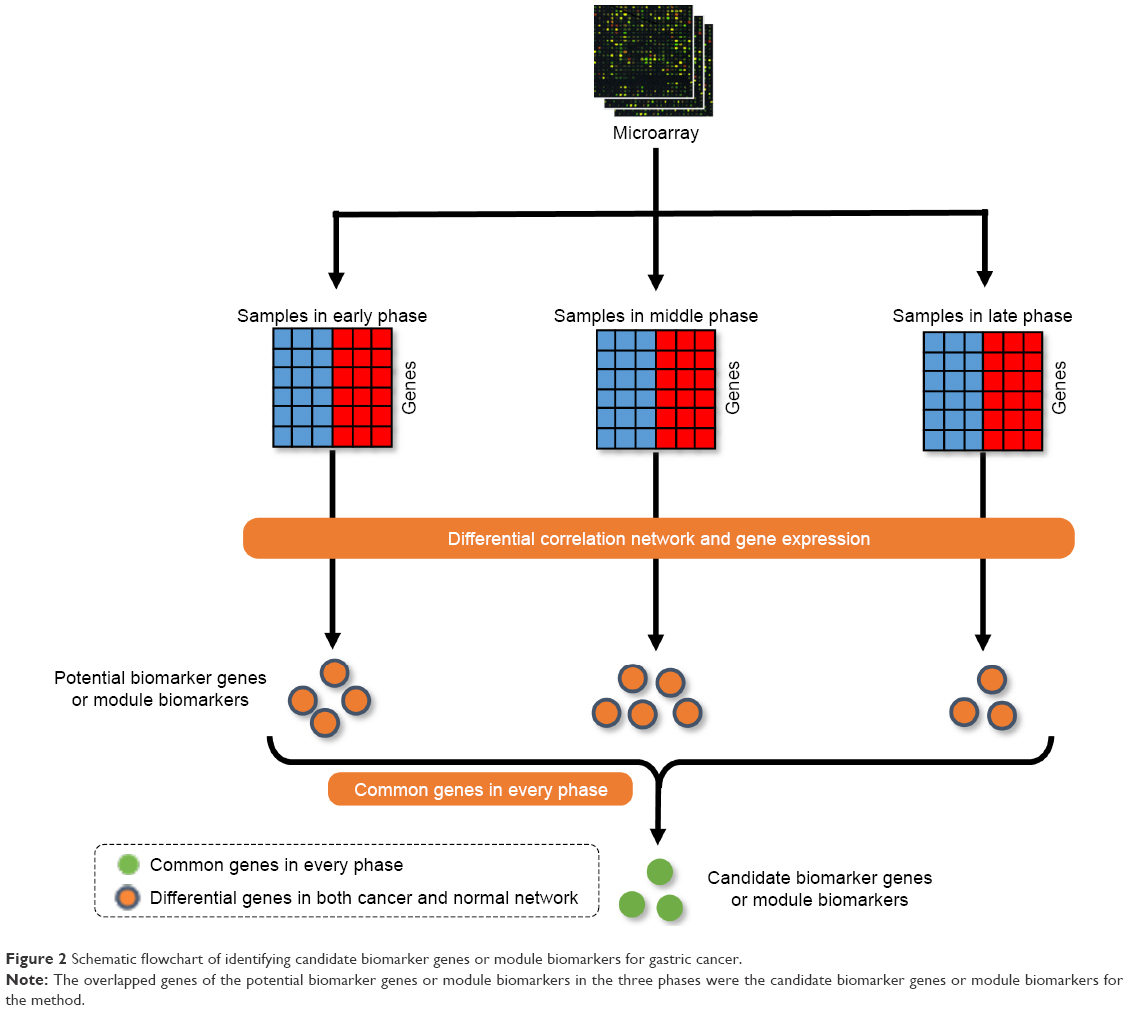 | Figure 2 Schematic flowchart of identifying candidate biomarker genes or module biomarkers for gastric cancer. |
Candidate biomarker genes as module biomarker
The expression profiles of candidate biomarker genes were used to test the classification ability for normal and cancer phenotypes. We used a support vector machine (SVM) regression method to implement the classification. Given a set of training gene expression samples, each categorized as normal or cancer, SVM classifier builds a model to predict whether a new sample falls into normal or gastric cancer phenotypes. Receiver operating characteristic (ROC) curve and area under the curve (AUC) were used to show the classification efficiency. Furthermore, the two independent datasets of the human gastric tumor were also utilized to check the results of classification in these candidate biomarker genes. Two R12 packages “kernlab” and “ROCR” were used to implement the SVM classifier and produce the ROC curve with default parameters. Other three microarray datasets (GSE19826, GSE13911, and GSE2701) and RNA-Seq datasets (The Cancer Genome Atlas [TCGA]) for gastric cancer were chosen for validating the ability of classification for the module biomarkers to distinguish the gastric cancer sample.
Results
Identification of differential correlation network and gastric cancer genes
Figure 1 shows the flowchart of our method. All samples were separated into three phases according to their descriptions (Table 1). The normal- and cancer-specific correlation networks were constructed in each phase based on the gene expression data and human correlation network (the details can be found in Materials and methods), respectively, where the common edges between the normal and cancer networks were removed. The differential network was obtained by merging the normal-specific and cancer-specific networks in the corresponding phase, which included the edges that occurred only in normal- or cancer-specific networks. As a result, only those genes that have edges in the differential network and are differentially expressed in both normal and cancer samples are regarded as potential gastric cancer genes in every phase. Furthermore, the differentially expressed genes between normal and cancer status were used to filter the genes in the differential network, because the differentially expressed genes showed greater ability for distinguishing the phenotype. Finally, the genes that occurred in all three phases were treated as our final predicted gastric cancer biomarker genes. In this study, 27 genes were predicted as gastric cancer biomarker genes. These 27 gastric cancer biomarker genes appear in every phase of gastric cancer but interact with different partners (Figure 3). The simple functional analysis of these biomarker genes in PANTHER database was shown to be associated with the cellular, metabolic, and developmental processes (Figure 4). Furthermore, the function annotations were conducted for the candidate biomarker genes by further analysis of DAVID database13 (Table 2). From gene functions, we could see that some of the candidate biomarker genes had been reported to play an important role in tumorigenesis. For example, MCM3, which encodes one of mini-chromosome maintenance proteins and is involved in the initiation of genome replication, is involved in gastric, lung, and kidney cancers,14 and CHK1, which encodes a Ser/Thr protein kinase and works for checkpoint-mediated cell cycle arrest, is involved in breast 15 and ovarian cancers.16 The functional enrichments of the module biomarkers were involved in mitosis and cell cycle phase (Table 3) according to gene ontology analysis in two web services Gene Ontology Consortium (http://geneontology.org/page/go-enrichment-analysis) and g:Profiler (http://biit.cs.ut.ee/gprofiler/), and the major functions in which the module biomarkers were involved were associated with cancer processes.
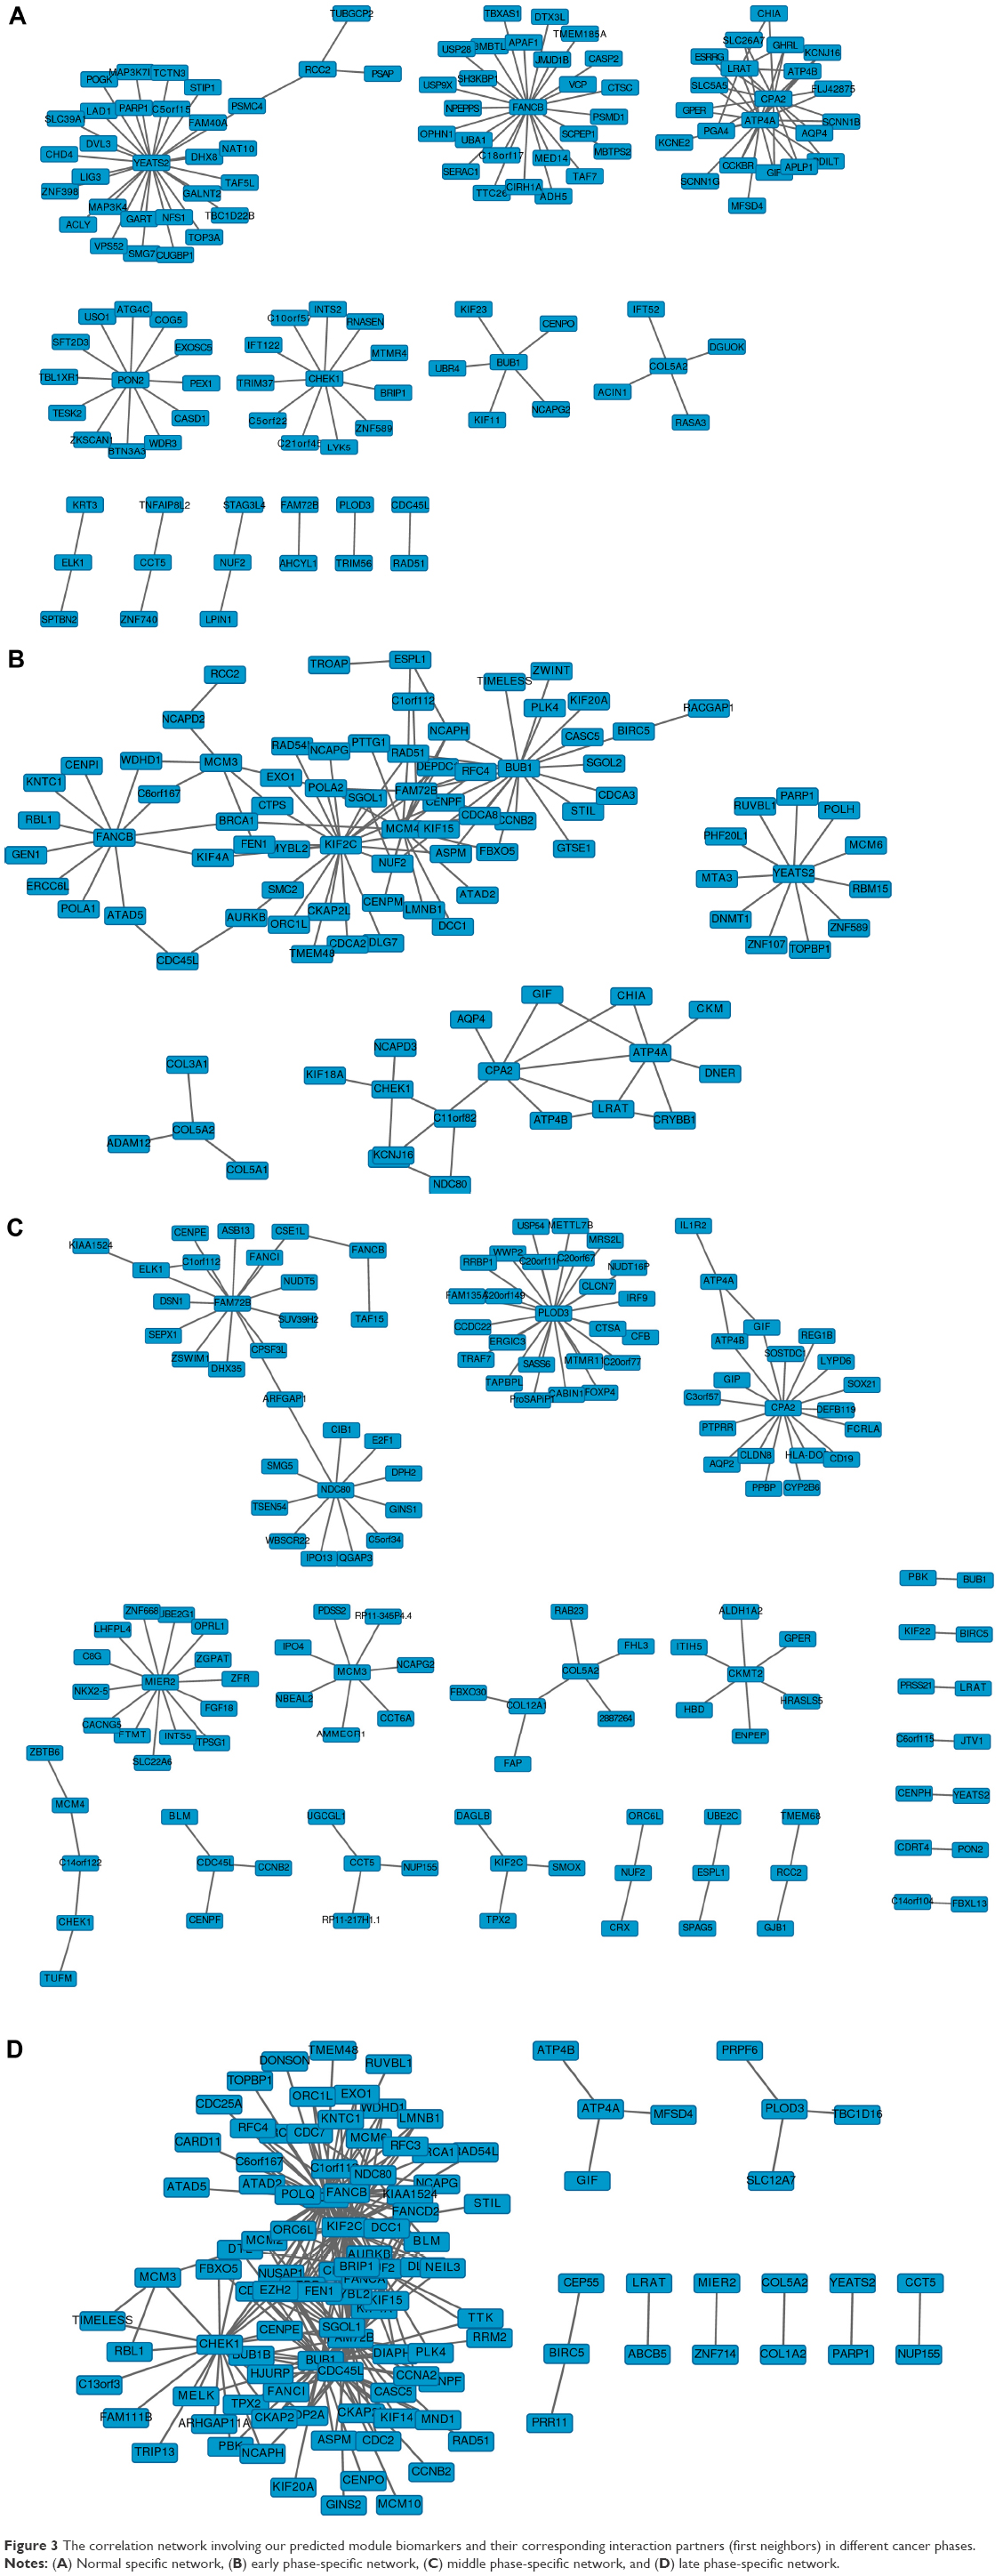 | Figure 3 The correlation network involving our predicted module biomarkers and their corresponding interaction partners (first neighbors) in different cancer phases. |
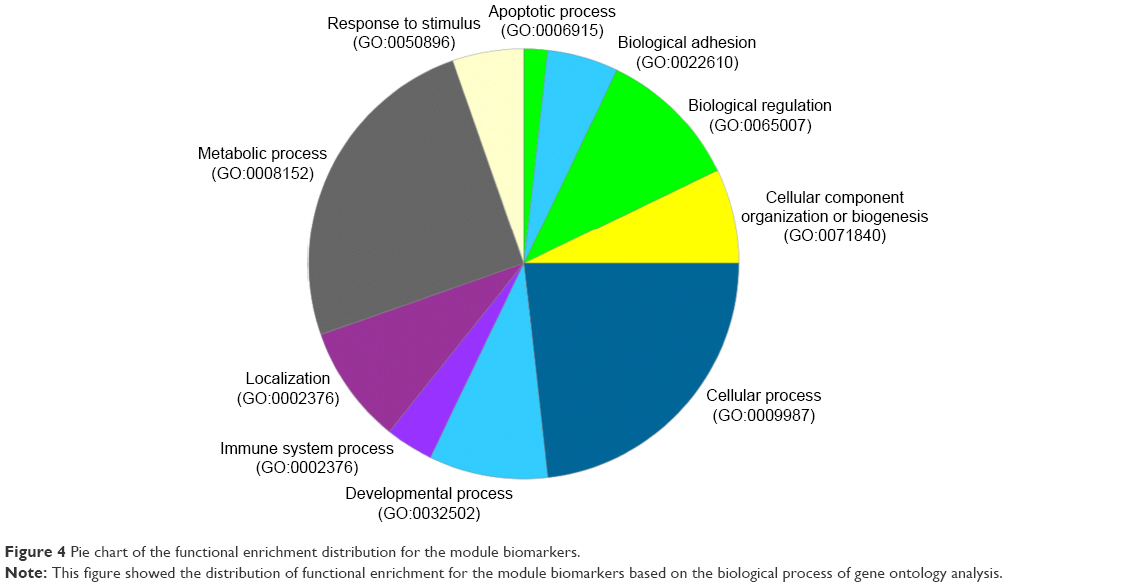 | Figure 4 Pie chart of the functional enrichment distribution for the module biomarkers. |
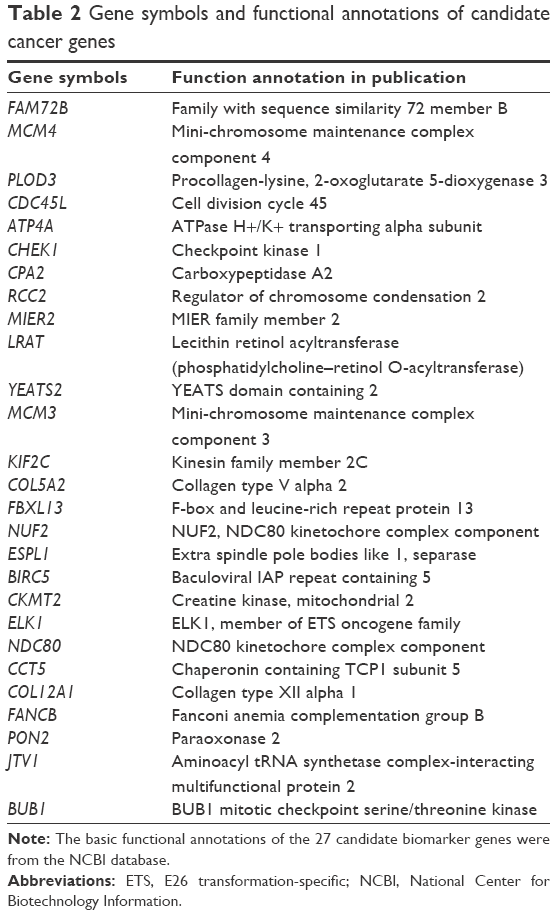 | Table 2 Gene symbols and functional annotations of candidate cancer genes |
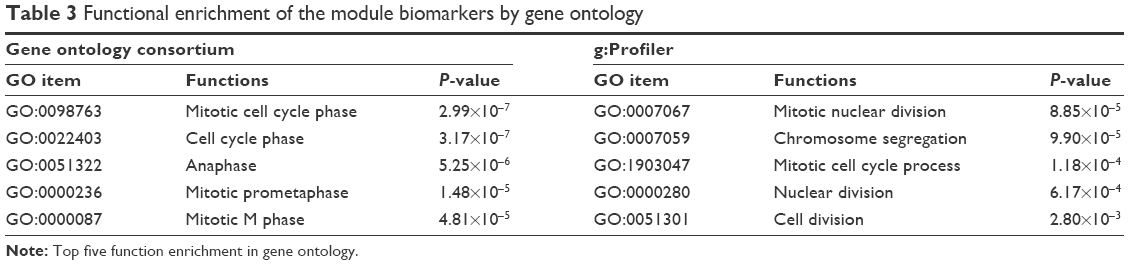 | Table 3 Functional enrichment of the module biomarkers by gene ontology |
In addition, the network that contained the candidate marker genes and their interaction partners built in each phase was constructed (Figure 3). Network ontology analysis (NOA),17 which annotates biological networks, was used to analyze the enriched functions of the network in every phase. The results of NOA are shown in Table 4. In the normal status, the functions are enriched in signaling pathway, while in the early phase, the functions are enriched in nucleic acid-related metabolic process. The functions of the network change to nuclear division and response to stimulus in the middle and late phase, respectively. The functional annotations of the network in each phase demonstrate clearly that the identified cancer genes function reasonably and their changes reflect the dynamic transition between different stages and transcription, which is an important marker of a cancer cell.
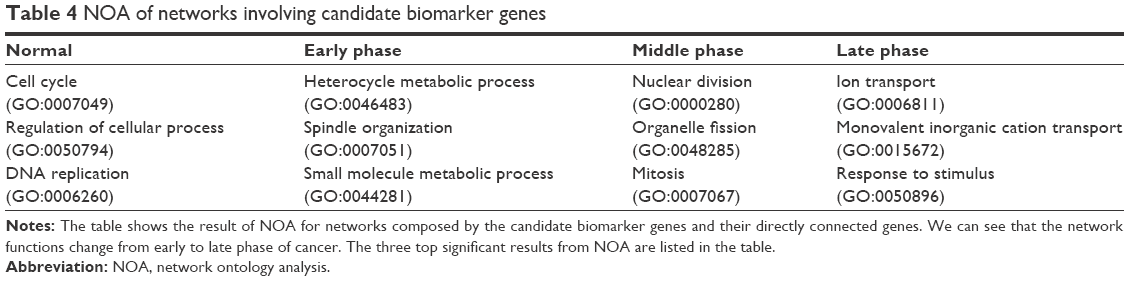 | Table 4 NOA of networks involving candidate biomarker genes |
Validation of candidate gastric cancer biomarker genes
In order to further validate the predicted gastric cancer genes, we applied these genes to separate cancer samples from normal samples. Three independent gene expression (microarray) datasets (GSE19826, GSE2701, and GSE13911) of gastric cancer were obtained from GEO database (http://www.ncbi.nlm.nih.gov/geo/) to validate the ability of classification of the module biomarker. At the same time, an RNA-Seq dataset of gastric cancer with 33 normal samples and 183 tumor samples was downloaded from TCGA database (http://cancergenome.nih.gov) to validate the ability of classification for the module biomarker on the differential data type. If these genes can successfully separate cancer samples from control samples for gastric cancer, we predicted that these genes can be proven to be related to gastric cancer. We used the five-fold cross-validation for SVM to detect the ability of classification for our predicted module biomarkers, and the AUC of ROC curve can be used to evaluate the ability of classification for biomarkers, so we can see that the AUCs of ROC curves for three of the four gastric cancer datasets are >0.9 and only one AUC is 0.88 for one dataset (Figure 5), and the AUC of ROC curves for the RNA-Seq data was also >0.9 (Figure 6). It means that our module biomarkers have a strong ability to identify gastric cancer and that these biomarker genes are strongly related to gastric cancer.
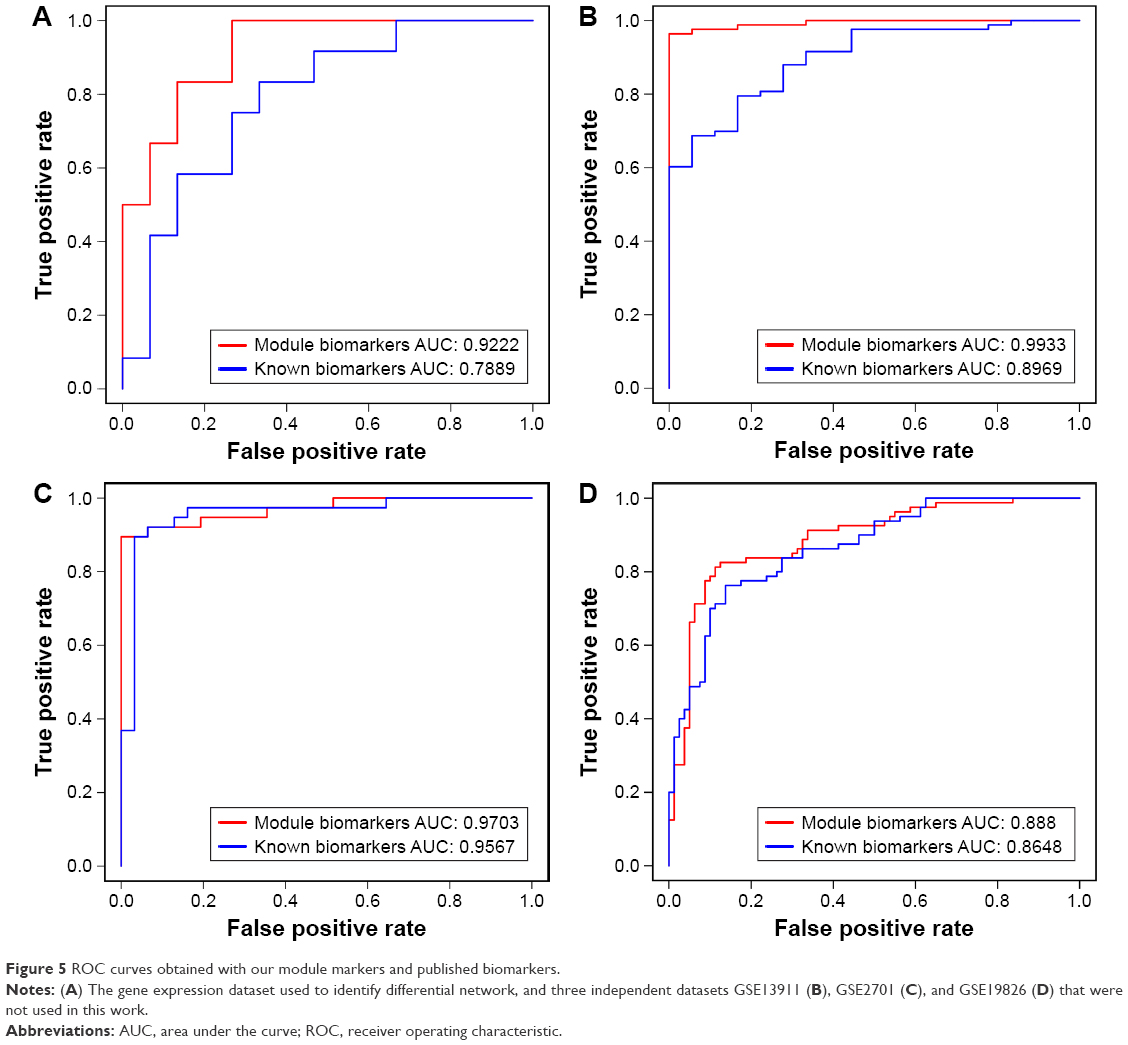 | Figure 5 ROC curves obtained with our module markers and published biomarkers. |
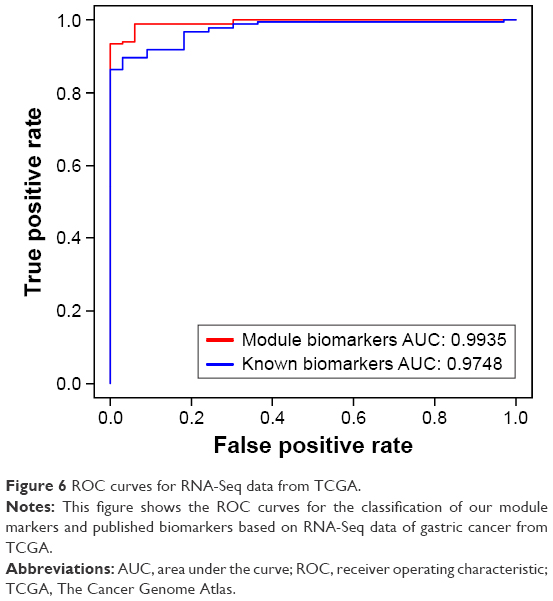 | Figure 6 ROC curves for RNA-Seq data from TCGA. |
For avoiding the bias of validation of the module biomarker, we compared our results with those obtained with published biomarker sets for gastric cancer,11 derived from the differential expression; a five-fold cross-validation was used to evaluate the performance based on different biomarkers, while SVM was used as a classifier. The ability of classification for the two biomarkers to the four microarray datasets and one RNA-Seq was performed and the ROC curves and AUCs are shown in Figures 5 and 6. The AUC is 0.888 for the module biomarkers and 0.8648 for the known biomarker in Figure 5A, 0.9703 for the module biomarkers and 0.9567 for the known biomarkers in Figure 5B, and 0.9935 for module biomarkers and 0.9748 for known biomarkers in Figure 6; they showed very similar results for the two different biomarkers in Figures 5A, B and 6. It means that the module biomarkers and known public biomarkers for this dataset, GSE13911 and RNA-Seq datasets, have similar ability of classification. The AUC is 0.9933 for the module biomarkers and 0.8969 for the known biomarker in Figure 5C, and 0.9222 for the module biomarkers and 0.7889 for the known biomarkers in Figure 5D. Greater AUCs were obtained for module biomarkers than known biomarkers, as shown in Figure 5C and D, which means that module biomarkers showed better effects in the datasets GSE2701 and GSE19826. So the ability of classification of module biomarkers identified by our study is not worse than the known biomarkers for gastric cancer. In most cases, the ability of classification of the module biomarkers was better than the known biomarkers from differential expression test for the gastric cancer dataset.
Discussion
In this paper, we have proposed a new method to detect potential module biomarkers from a variety of network topology and gene expression between normal and cancer status for gastric cancer. There is a module biomarker with 27 genes identified in this study, and this module biomarker showed a powerful ability to classify the phenotypes between normal and cancer status. In this method, the key genes from a variety of network topology can be detected by differential correlation network, and then they can be further filtered by the differentially expressed genes which are not the significant differential expressed between normal and cancer status. So the ability of classification of the module biomarker would be better than the traditional markers, which only come from differentially expressed genes. Although there are only 27 genes in the module biomarker, many genes in the module biomarker are important factors in the development and diagnosis of gastric cancer. For example, ATP4A, which encodes a proton pump that catalyzes the hydrolysis of ATP coupled with the exchange of hydrogen and potassium ions across the plasma membrane, is an important serum biomarker for gastric cancer18 and plays a critical role in gastric neuroendocrine tumor.19 RCC2 is cell cycle gene regulator and can promote directional cell migration,20,21 but the aberrant expression of RCC2 can confer a growth advantage on tumor cells in gastric cancer.22 KIF2C, which encodes a microtubule-dependent molecular motor and can depolymerize microtubules at the plus end, is overexpressed in human gastric cancer and associated with lymphatic invasion and lymph node metastasis in gastric cancer.23 BUB1 is a mitotic checkpoint gene and plays an important role at the spindle assembly checkpoint; its overexpression is correlated with tumor proliferating activity in human gastric cancer.24,25 Most of the other genes in the module biomarker have also been reported to play critical roles in other tumors or cancers. For example, the MCM4, which is one of the mini-chromosome maintenance proteins, is also an important factor in the tumor process and can be a biomarker in non-small-cell lung cancer.26,27 CDC45L, which is an essential protein required for the initiation of DNA replication, is an important factor in lung cancer and a potentially useful target for lung cancer immunotherapy.28 MCM3 and CHEK1 are involved in cancer processes.14–16
The P-value of Pearson correlation coefficient was used as the threshold for high correlation, because there is a different number of samples in the three phases (eleven samples in early phase, 54 samples in middle phase, and 15 samples in late phase) of gastric cancer.
All the genes in the module biomarker are differentially expressed genes in both normal and cancer samples, so they can be used as biomarkers to distinguish the gastric cancer samples from normal samples. As these genes fall into the same module in the network, they have a better combination effect on the classification of phenotypes than only differentially expressed genes. The results of classification show that the ability of classification of the module biomarker is similar or better than the known biomarkers from only differentially expressed genes, based on microarray data from GEO and the RNA-Seq data from TCGA.
In this paper, we obtained a module biomarker with 27 genes. The 27 genes were from common potential biomarker genes of three phases of gastric cancer (Figure 2), so there are no stage- or phase-specific biomarker genes in the 27 genes. Of course, the method can also be used to obtain some stage- or phase-specific biomarker genes for gastric cancer.
Conclusion
In this paper, we have proposed a new network-based method to detect the module biomarkers for complex disease, and a module biomarker with 27 candidate genes was identified for gastric cancer. The module biomarker of gastric cancer can help to diagnose and treat this deadly cancer efficiently, and also shed light on other cancers. Some genes in the module biomarkers are known cancer genes and have been reported in the literature, eg, ATP4A, MCM3, and CHEK1.
We validated the ability of classification of this module biomarker by SVM and the results of AUC showed a great ability of this module biomarker to distinguish the cancer samples and normal samples in gastric cancer. By comparing the ability of classification of known biomarkers from differential expression for gastric cancer, the module biomarker showed better results for classification of gastric cancer data, and the results showed that the module biomarkers are more powerful than the known biomarkers in classifying the gastric samples.
Acknowledgments
This work is partly supported by National Natural Science Foundation of China (Grant No: 61403363), China Postdoctoral Science Foundation (Grant No: 2014T70441 and 2013M541565), and Key Project of Natural Science of Anhui Provincial Education Department (Grant No: KJ2016A002).
Disclosure
The authors report no conflicts of interest in this work.
References
Parkin DM, Bray F, Ferlay J, Pisani P. Global cancer statistics, 2002. CA Cancer J Clin. 2005;55(2):74–108. | ||
Parkin DM, Bray F, Ferlay J, Pisani P. Gastric cancer. Br Med Bull. 2008;85:84–100. | ||
Futreal PA, Coin L, Marshall M, et al. A census of human cancer genes. Nat Rev Cancer. 2004;4(3):177–183. | ||
Polager S, Ginsberg D. p53 and E2f: partners in life and death. Nat Rev Cancer. 2009;9(10):738–748. | ||
Chuang HY, Lee E, Liu YT, Lee D, Ideker T. Network-based classification of breast cancer metastasis. Mol Syst Biol. 2007;3:140. | ||
Liu ZP, Wang Y, Zhang XS, Xia W, Chen L. Detecting and analyzing differentially activated pathways in brain regions of Alzheimer’s disease patients. Mol Biosyst. 2011;7(5):1442–1452. | ||
Liu X, Tang WH, Zhao XM, Chen L. A network approach to predict pathogenic genes for Fusarium graminearum. PLoS One. 2010;5(10):e13021. | ||
Chen L, Wang RS, Zhang XS. Biomolecular Networks. Hoboken, New Jersey: John Wiley & Sons, Inc; 2009. | ||
Bandyopadhyay S, Mehta M, Kuo D, et al. Rewiring of genetic networks in response to DNA damage. Science. 2010;330(6009):1385–1389. | ||
Liu X, Liu ZP, Zhao XM, Chen L. Identifying disease genes and module biomarkers by differential interactions. J Am Med Inform Assoc. 2012;19(2):241–248. | ||
Cui J, Chen Y, Chou WC, et al. An integrated transcriptomic and computational analysis for biomarker identification in gastric cancer. Nucleic Acids Res. 2011;39(4):1197–1207. | ||
R Development Core Team. R: a language and environment for statistical computing. R Foundation for statistical computing. Vienna, Austria; 2011. Available from: http://www.R-project.org/. ISBN 3-900051-07-0. | ||
Huang DW, Sherman BT, Lempicki RA. Systematic and integrative analysis of large gene lists using DAVID bioinformatics resources. Nat Protoc. 2009;4:44–57. | ||
Ha SA, Shin SM, Namkoong H, et al. Cancer-associated expression of minichromosome maintenance 3 gene in several human cancers and its involvement in tumorigenesis. Clin Cancer Res. 2004;10(24):8386–8395. | ||
Abdel-Fatah TM, Middleton FK, Arora A, et al. Untangling the ATR-CHEK1 network for prognostication, prediction and therapeutic target validation in breast cancer. Mol Oncol. 2015;9(3):569–585. | ||
Kim MK, Min DJ, Wright G, Goldlust I, Annunziata CM. Loss of compensatory pro-survival and anti-apoptotic modulator, IKKε, sensitizes ovarian cancer cells to CHEK1 loss through an increased level of p21. Oncotarget. 2014;5(24):12788–12802. | ||
Wang J, Huang Q, Liu ZP, et al. NOA: a novel network ontology analysis method. Nucleic Acids Res. 2011;39(13):e87. | ||
Raja UM, Gopal G, Rajkumar T. Intragenic DNA methylation concomitant with repression of ATP4B and ATP4A gene expression in gastric cancer is a potential serum biomarker. Asian Pac J Cancer Prev. 2012;13(11):5563–5568. | ||
Calvete O, Reyes J, Zuñiga S, et al. Exome sequencing identifies ATP4A gene as responsible of an atypical familial type 1 gastric neuroendocrine tumour. Hum Mol Genet. 2015;24(10):2914–2922. | ||
Bruun J, Kolberg M, Ahlquist TC, et al. Regulator of chromosome condensation 2 identifies high-risk patients within both major phenotypes of colorectal cancer. Clin Cancer Res. 2015;21(16):3759–3770. | ||
Humphries JD, Byron A, Bass MD, et al. Proteomic analysis of integrin-associated complexes identifies rcc2 as a dual regulator of rac1 and arf6. Sci Signal. 2009;2(87):ra51. | ||
Matsuo M, Nakada C, Tsukamoto Y, et al. Mir-29c is downregulated in gastric carcinomas and regulates cell proliferation by targeting rcc2. Mol Cancer. 2013;12:15. | ||
Nakamura Y, Tanaka F, Haraguchi N, et al. Clinicopathological and biological significance of mitotic centromere-associated kinesin overexpression in human gastric cancer. Br J Cancer. 2007;97(4):543–549. | ||
Shigeishi H, Oue N, Kuniyasu H, et al. Expression of bub1 gene correlates with tumor proliferating activity in human gastric carcinomas. Pathobiology. 2001;69(1):24–29. | ||
Grabsch H, Takeno S, Parsons WJ, et al. Overexpression of the mitotic checkpoint genes bub1, bubr1, and bub3 in gastric cancer–association with tumour cell proliferation. J Pathol. 2003;200(1):16–22. | ||
Watanabe E, Ohara R, Ishimi Y. Effect of an mcm4 mutation that causes tumours in mouse on human mcm4/6/7 complex formation. J Biochem. 2012;152(2):191–198. | ||
Kikuchi J, Kinoshita I, Shimizu Y, et al. Minichromosome maintenance (mcm) protein 4 as a marker for proliferation and its clinical and clinicopathological significance in non-small cell lung cancer. Lung Cancer. 2011;72(2):229–237. | ||
Tomita Y, Imai K, Senju S, et al. A novel tumor-associated antigen, cell division cycle 45-like can induce cytotoxic t-lymphocytes reactive to tumor cells. Cancer Sci. 2011;102(4):697–705. |
 © 2016 The Author(s). This work is published and licensed by Dove Medical Press Limited. The
full terms of this license are available at https://www.dovepress.com/terms
and incorporate the Creative Commons Attribution
- Non Commercial (unported, 3.0) License.
By accessing the work you hereby accept the Terms. Non-commercial uses of the work are permitted
without any further permission from Dove Medical Press Limited, provided the work is properly
attributed. For permission for commercial use of this work, please see paragraphs 4.2 and 5 of our Terms.
© 2016 The Author(s). This work is published and licensed by Dove Medical Press Limited. The
full terms of this license are available at https://www.dovepress.com/terms
and incorporate the Creative Commons Attribution
- Non Commercial (unported, 3.0) License.
By accessing the work you hereby accept the Terms. Non-commercial uses of the work are permitted
without any further permission from Dove Medical Press Limited, provided the work is properly
attributed. For permission for commercial use of this work, please see paragraphs 4.2 and 5 of our Terms.