Back to Journals » Pharmacogenomics and Personalized Medicine » Volume 15
Identification of Potential Biological Factors Affecting the Treatment of Ticagrelor After Percutaneous Coronary Intervention in the Chinese Population
Authors Yuan D, Shi X, Gao L, Wan G, Zhang H, Yang Y, Zhao Y, Sun D
Received 28 September 2021
Accepted for publication 5 January 2022
Published 20 January 2022 Volume 2022:15 Pages 29—43
DOI https://doi.org/10.2147/PGPM.S338287
Checked for plagiarism Yes
Review by Single anonymous peer review
Peer reviewer comments 2
Editor who approved publication: Dr Martin H Bluth
Dongdong Yuan,1 Xiangfen Shi,2 Liping Gao,1 Gaobiao Wan,1 Hanjuan Zhang,1 Yuling Yang,1 Yujie Zhao,1 Didi Sun1
1Department of Medicine, The 7th People’s Hospital of Zhengzhou, Zhengzhou, 450000, Henan, People’s Republic of China; 2The First Affiliated Hospital of Zhengzhou University, Zhengzhou, 450000, Henan, People’s Republic of China
Correspondence: Didi Sun, Email [email protected]
Background: Generally, many individual factors can affect the clinical application of drugs, of which genetic factors contribute more than 20%. Ticagrelor is a new class of receptor inhibitors receptor antagonist of P2Y12 and is used as an antiplatelet agents. But it is not affected by the influence of CYP2C19 polymorphism. With lack of predicted biomarkers, especially the research data of Chinese, it has the important significance in studying individual differences of ticagrelor in the antiplatelet efficacy and safety, through pharmacogenomics research.
Methods: Whole-exome sequencing (WES) was performed in 100 patients after PCI with ticagrelor treatment. Clinical characteristics and WES of patients were used to performed genome-wide association analysis (GWAS), region-based tests of rare DNA variant to find the influencing factors of antiplatelet effect to ticagrelor and bleeding events. Co-expression, protein–protein interaction (PPI) network and pathway enrichment analysis were then used to find possible genetic mechanisms. Atlas of GWAS (https://atlas.ctglab.nl/) were used for external data validation.
Results: DNAH17, PGS1 and ABCA1 as the potential variant genes are associated with the expected antiplatelet effect to ticagrelor. The affected pathways may include the synthesis and metabolism of lipoprotein cholesterol and the catabolic process of pyrimidine-containing compound (GO:0072529). Age, sex and PLT were found may be potential factors for ticagrelor bleeding events.
Conclusion: We systematically identified new genetic variants and some risk factors for reduced efficacy of ticagrelor and highlighted related genes that may be involved in antiplatelet effects and bleeding event of ticagrelor. Our results enhance the understanding of the absorption and metabolic mechanisms that influence antiplatelet response to ticagrelor treatment.
Trial Registration: ClinicalTrials.gov Identifier: NCT03161002. First Posted: May 19, 2017. https://clinicaltrials.gov/ct2/show/study/NCT03161002.
Keywords: ticagrelor, percutaneous coronary intervention, bleeding, inhibition of platelet aggregation, pharmacogenetic, whole-exome sequencing
Introduction
AZD6140 is the first reversible oral P2Y12 receptor antagonist, with a half-life of about 12 hours, and belongs to the new chemical antiplatelet drugs termed cyclopentyl-triazolo-pyrimidines.1 Ticagrelor has a faster onset than clopidogrel, and its platelet inhibitory effect is more obvious. It is superior to clopidogrel in preventing major adverse cardiovascular events (such as myocardial infarction, stroke, or death) in patients with an acute coronary syndrome (ACS) in the Platelet Inhibition and Patient Out-comes (PLATO) trials.2
The current standard treatment of antiplatelet after percutaneous coronary intervention (PCI) in patients with ACS is dual antiplatelet therapy (DAPT) of combined aspirin and a P2Y12 inhibitor.3–5 Clopidogrel is a prodrug that needs to be bioactivated by the CYP2C19 enzyme. CYP2C19 is greatly affected by nucleotide polymorphism, which affects the metabolism, anti-platelet function and clinical efficacy of clopidogrel.6,7 In contrast, the therapeutic effect of ticagrelor is not affected by CYP2C19 genotype. So, compared to clopidogrel, ticagrelor is more consistent antiplatelet effects, better efficacy in ACS patients.8,9 Therefore in clinical practice, one strategy is that the test results of CYP2C19 genotype guide the escalation and de-escalation of antiplatelet therapy.10 Another strategy is to skip recommended genetic testing before DAPT and use ticagrelor instead of clopidogrel,9 but it has higher bleeding risk, discontinuation rates, and cost than clopidogrel.11
Although previous data from the PLATO suggest that DAPT with aspirin and ticagrelor is efficacious in patients with recent ACS, the specific treatment options including the optimal duration of DAPT after PCI for different populations remain controversial.3–5,12,13 Because there are two risks, including the risk of cardiovascular events and the risk of bleeding complications, they do remind us of the fragile balance between efficacy and adverse events.14
The response to these agents can be modulated by platelet-related genetic polymorphisms.15 While the role of regulating clopidogrel resistance has been well established, few studies have been reported for ticagrelor in Asian populations. The clinical application of genetic testing to optimize therapeutic strategies lacks sufficient evidence that understanding of the genetic determinants of ticagrelor.16
Therefore, a prospective experiment involving 100 Chinese patients with the percutaneous coronary intervention was designed. SNP and clinical characteristics were associated to antiplatelet response and bleeding event after ticagrelor treatment. Then, SNPs were associated to RNA expression level, and pathway enrichment was performed to elucidate the potential mechanisms (Figure 1).
 |
Figure 1 Schematic diagram of the study design. |
Materials and Methods
Study Population and Design
Patients were recruited to this study from the 7th People’s Hospital of Zhengzhou. The enrolled patients met the diagnostic criteria for ACS in the Chinese Society of Cardiology (CSC) guidelines.17 The inclusion criteria and exclusion criteria methods were described in detail in https://clinicaltrials.gov/ct2/show/NCT03161002. Upon inclusion, blood sample tests and multiple clinical parameters were recorded. All received the percutaneous coronary intervention (PCI) or coronary artery bypass graft, and received aspirin enteric-coated tablets (Bayer 100mg qd) combined with ticagrelor tablets (AstraZeneca 90mg bid) antiplatelet drug treatment. Follow-up for one year, the bleeding events were recorded according to Bleeding Academic Research Consortium Definition.18
Measurement of P2Y12 Reaction Units (PRU)
VerifyNow P2Y12 assay, which is approved by the FDA to quantify platelet responsiveness to many antiplatelet medications including ticagrelor, was used to measure platelet function. Patients’ high on-treatment platelet reactivity (PRU>208) has been shown to correlate with a worse prognosis. There is consensus on
The standardized definitions and cutoff values of high platelet reactivity or low platelet reactivity have reached consensus.19 The inhibition of platelet aggregation (IPA) was calculated from the PRU which prior- and post-treatment with ticagrelor by the following formula:
IPA = [(prior-PRU − post-PRU)/ prior-PRU] × 100%
Whole Exon Sequencing and Variant Calling
At study entry, we collected blood samples from every participant and extracted DNA from an EDTA sample. The experimental process of whole total exon sequencing: sample quality control, nucleic acid extraction, library preparation and computer sequencing were conducted by the experimental process of HaploX (ShenZhen HaploX Biotechnology Co). Details on sequencing, quality control and variant calling were reported in the Supplementary Method. A total of 59 MB of captured DNA was sequenced with an average depth of coverage of 146-fold and >99.89% coverage in the targeted region (Supplementary File 2). Such high depth and coverage ensure the reliability of the subsequent analysis.
Covariates
To avoid the confounding variables of population structure on gene expression, we used principal component analyses (PCA) using PLINK 1.9 (www.cog-genomics.org/plink/1.9/) for all cases and selected the top ten principal components (PCs) in genotype data as covariates. To avoid the potential confounding variables of clinical characteristics, age, sex, BMI and smoking were added to all models as covariates.
Phenotype and Association Analysis
PLINK 1.9 is a wide toolset for GWAS and research in population genetics.20
For linear regression, a quantitative phenotype and possibly some covariates (in a –covar file) were entered into the software PLINK 1.9, and linear regression report was written to file plink.assoc.linear using –linear. For logistic regression, a case/control phenotype and some covariates were entered into PLINK 1.9 and –logistic was performed.
Expression Quantitative Trait Loci (eQTLs) and Splicing Quantitative Trait Loci (sQTLs)
The eQTLs and sQTLs variants data from GTEx (https://www.gtexportal.org/) that catalog thousands of tissue and identify signals from GWAS.21 We input variant loci to filter high-confidence eQTLs and sQTLs from whole blood and liver samples using GTEx.
Region-Based Tests of Rare and Common DNA Variants
For region-based tests of rare DNA variants, we obtained P values for the association by comparing all 100 patients using the unified sequence kernel association test with optimal kernel weighting (SKAT-O).22 The SKAT function was called with default parameters to tests of rare DNA variants, except for the argument “method” which was set to “SKATO”. To test for combined effects of common and rare variants, SKAT CommonRare function was used in the R package SKAT.23 The variants regions were mapped to the gene level, and the model was adjusted by the top ten PCs using PLINK. The significance level was defined as 1×10⁻⁶.
Analysis of Mutant Genes Functional Enrichment and Pathway
Correlation analysis of mutant gene expression and construction of PPI network. To verify the expression correlation between genes, we extracted the expression data of whole blood and liver tissue from the GTEx database and made a correlation analysis.
STRING online database 11.0 (https://www.string-db.org/) was used to build protein-protein interaction (PPI) networks of variants genes. The PPI networks with confidence scores >0.4 were preserved and visualized by Cytoscape software.
The gene set enrichment analysis was performed using PASCAL software.24 To fit into the Chinese LD structure, the custom reference panel was generated from the 1000 Genomes Phase 3 release. The 14,462 gene sets (Z-score > 3) were reconstituted using DEPICT (https://data.broadinstitute.org/mpg/depict) and default settings were adopted for the analysis.
Statistical Analysis
The spearman nonparametric test was performed to evaluate correlations. Differences between groups were evaluated by Chi-square test for categorical variables and Wilcoxon test, or Kruskal–Wallis, or Students test for continuous variables. All these were done using the R package “tableone” and “ggstatsplot”.
Result
Platelet Function Testing (PFT)
The extent of platelet aggregation was determined by PRU in the presence of a P2Y12 inhibitor, and lower PRU levels represent higher antiplatelet activity. To assess the efficacy of ticagrelor, platelet function monitoring was performed twice prior- and post-treatment with ticagrelor with the VerifyNow assay. We found that the value of PRU was significantly reduced with treatment of ticagrelor, and no patients had high on-treatment platelet reactivity (PRU > 208) post-treatment (Figure 2A). Prior PRU was approximate to the normal distribution, and post PRU and IPA distribution were more concentrate (Figure 2B). Meanwhile, there was a significantly negative correlation (r = −0.97) between IPA and post PRU. However, there was little correlation (r = −0.05) between IPA and prior PRU (Supplementary Figure 1). For bleeding events, our results showed that there was no significant difference in platelet function (prior, post PRU and IPA) between the bleeding group and the non-bleeding group (Supplementary Figure S2).
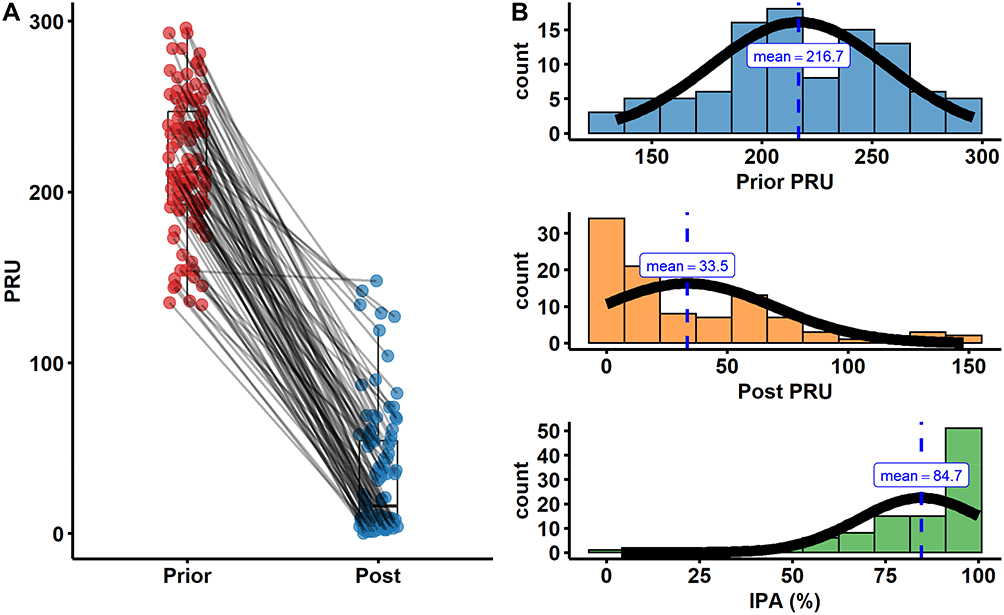 |
Figure 2 Platelet function testing. (A) Platelet function in patients prior- and post-treatment with aspirin and ticagrelor. (B) The distribution of prior PRU, post PRU and IPA in patients. |
Clinical Characteristics and Their Effects on the IPA and Bleeding Events
To tested the potential correlation between clinical parameters and IPA, we performed correlation analysis for continuous variables, and difference analysis between groups for categorical variables (Figure 3, Supplementary Table 1). Only blood platelet (PLT) count has correlation (R = 0.3, P = 0.0035) with IPA. Similarly, we investigated the relationship between bleeding and various clinical characteristics (Table 1). Age and PLT had significant difference (P = 0.033) between bleeding and no bleeding group. Sex, ALP, PLT, HDL-C were related (P < 0.1) to bleeding events.
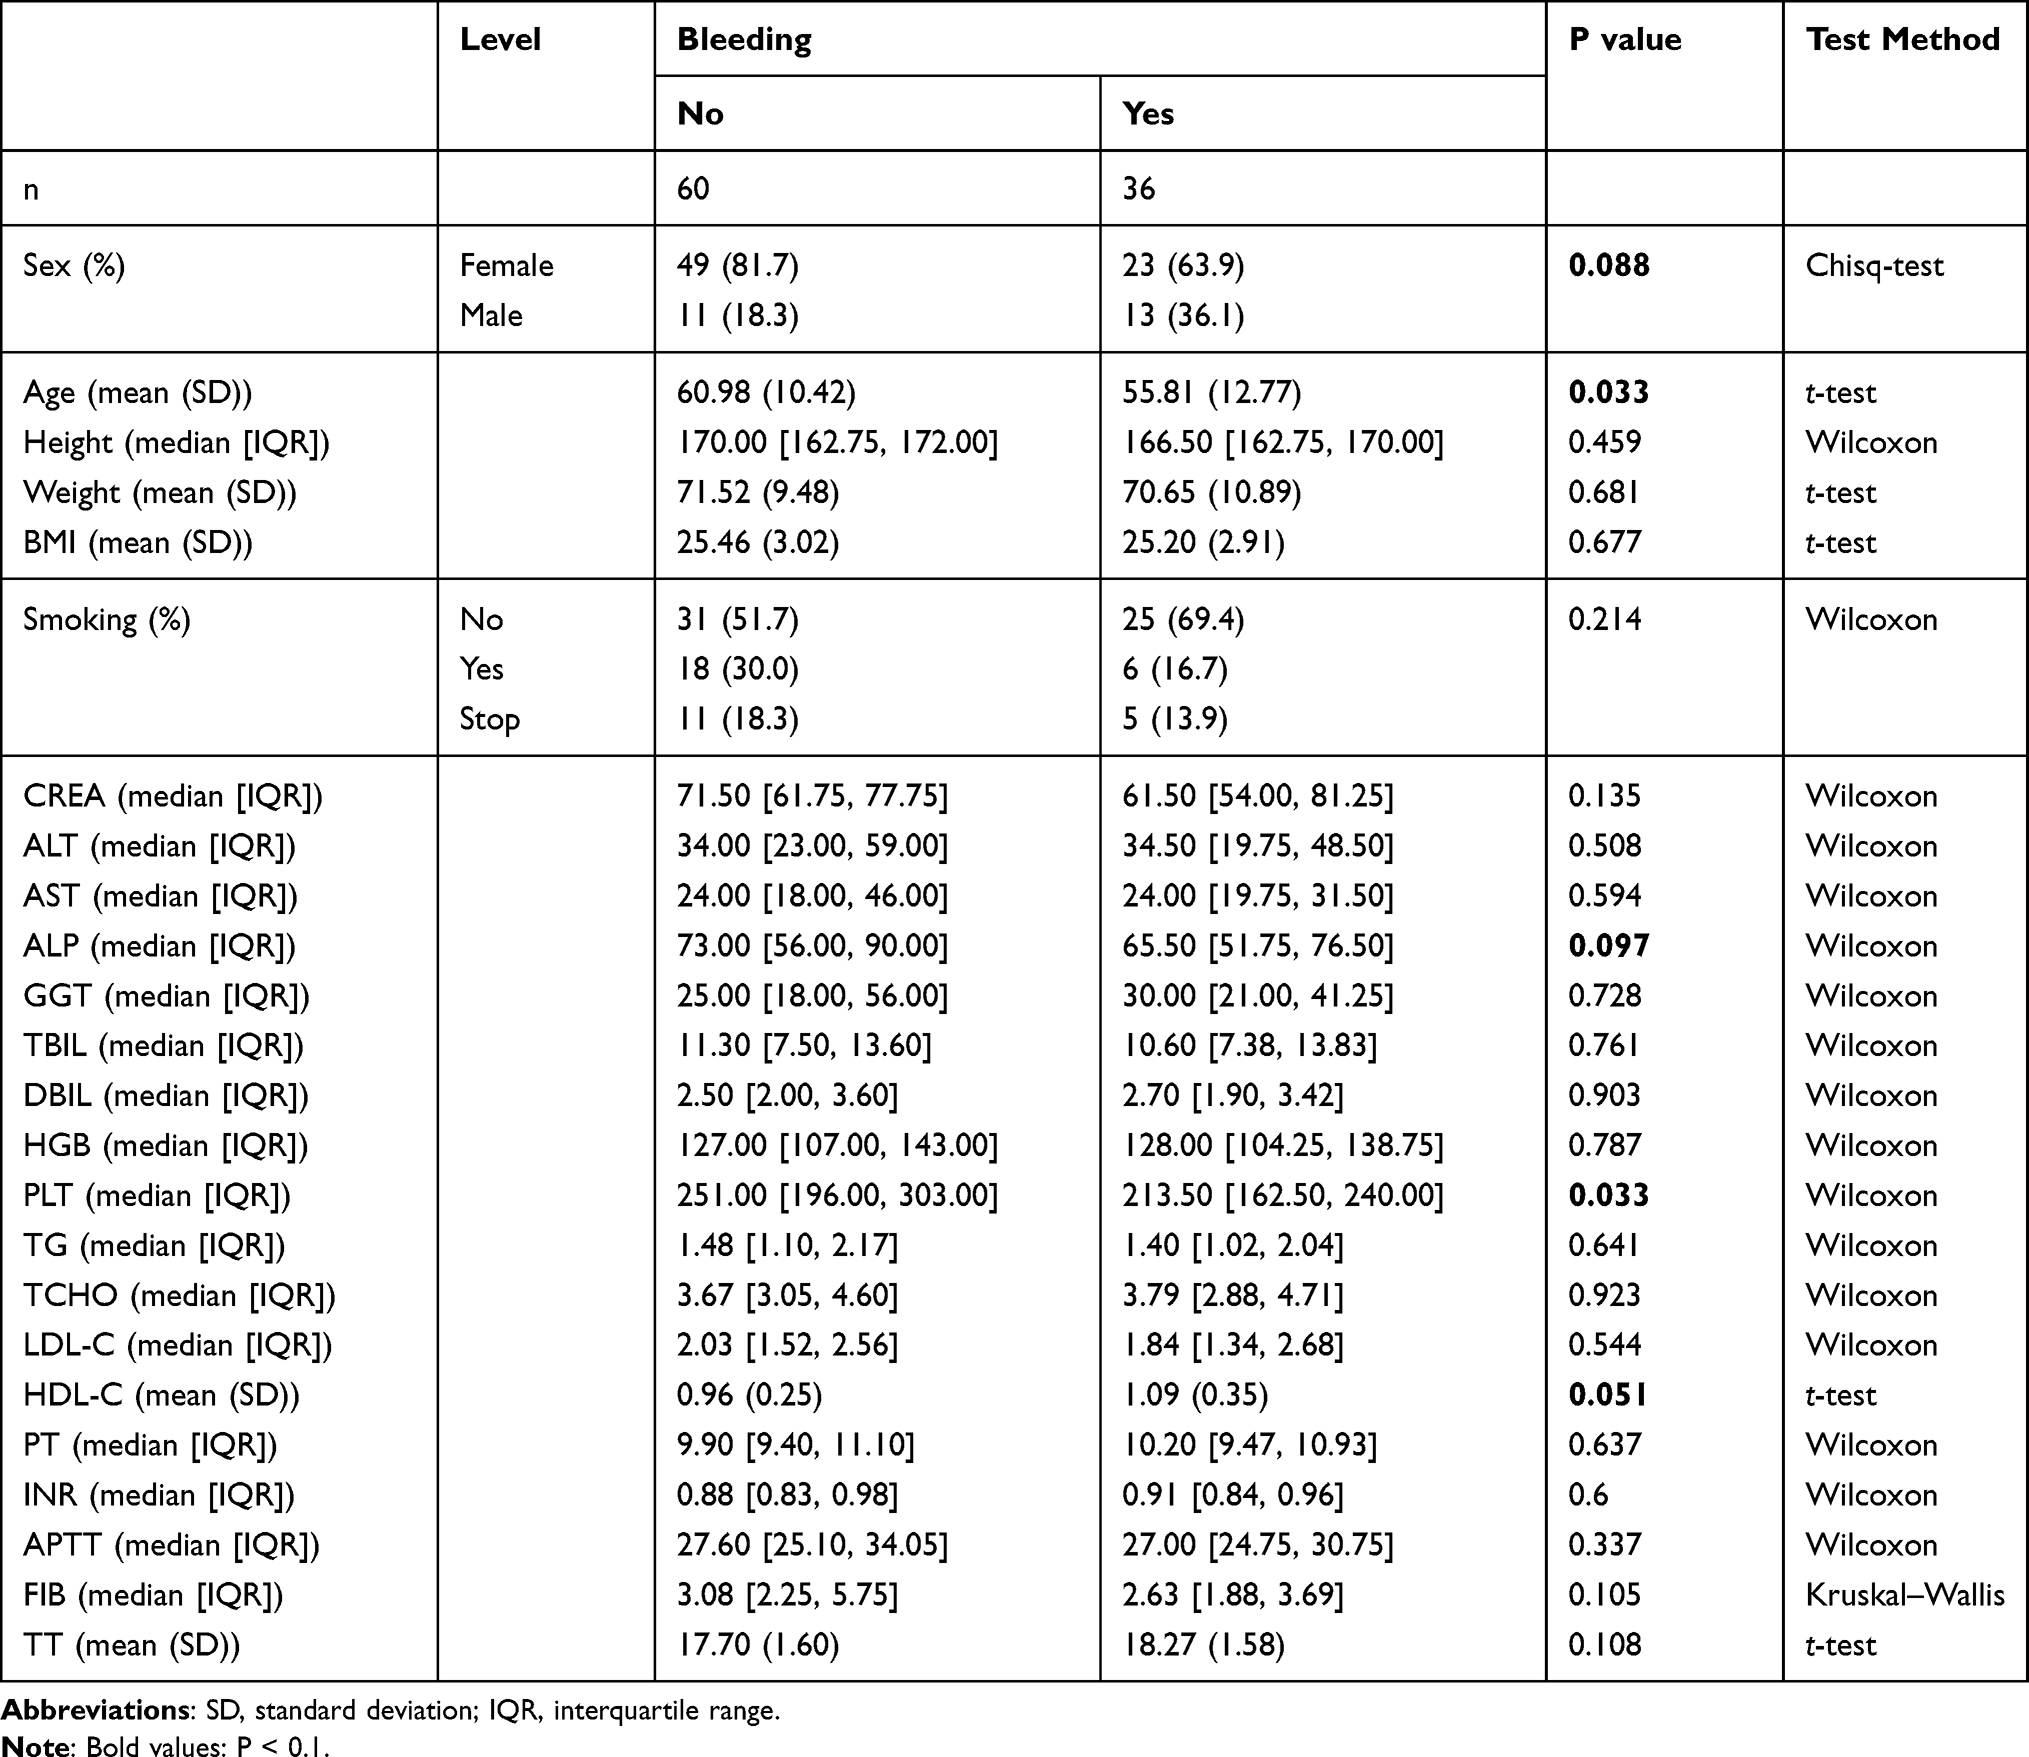 |
Table 1 Baseline Clinical Characteristics and Their Effects on the Bleeding Events |
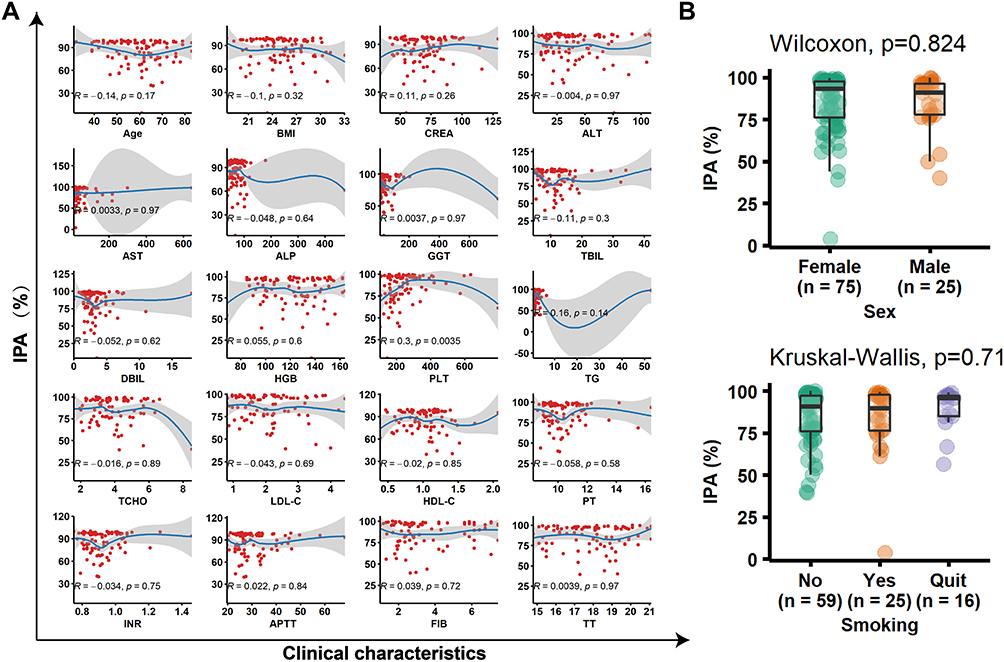 |
Figure 3 The relationship between clinical characteristics and IPA. (A) A linear relationship was fitted for all characteristics with IPA. (B) The distribution of IPA in different sex and smoking groups. |
Statistical Analyses of Possible Single-Nucleotide Polymorphism Effects on Clinical Outcomes
The association between SNP and IPA or bleeding events were analyzed using linear regression or logistic regression respectively. After selecting the strict P value (P < 1×10⁻⁶), 4 SNPs (rs74640812, rs972925, rs60460416, rs2289752) were screened out when IPA is the dependent variable (Figure 4A–C). The details of SNPs in Table 2 and the SNPs allele frequency in Supplementary Table 2. We repeated similar work, however, no SNPs with potentially significant (P < 1×10⁻⁶) effects were observed in bleeding events (Supplementary Figure 3).
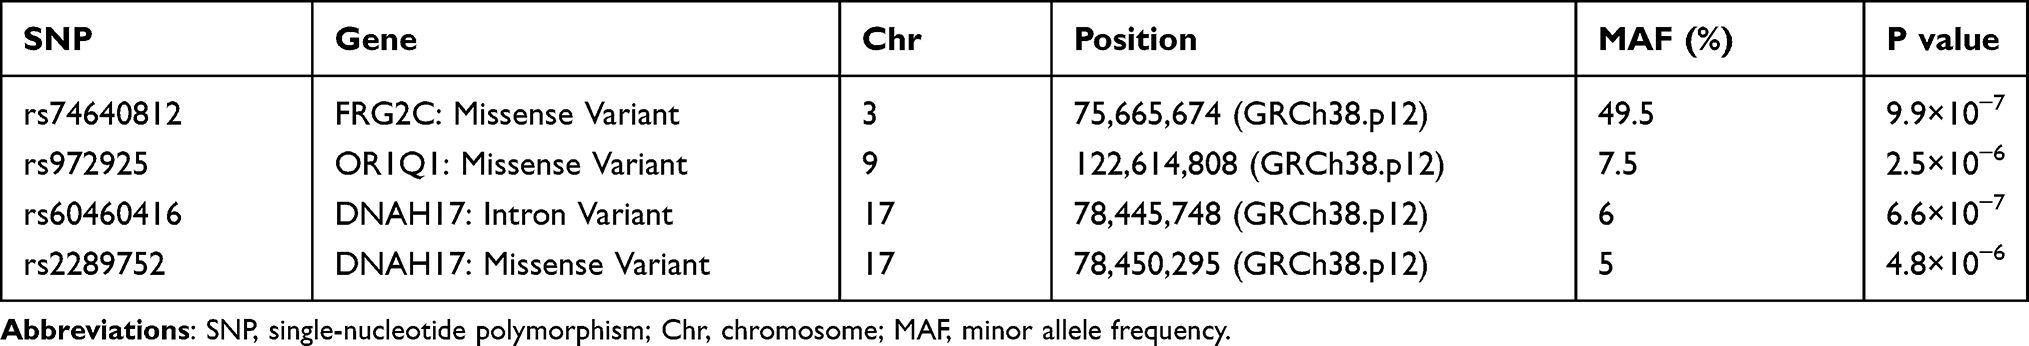 |
Table 2 Results for Single-Nucleotide Polymorphism Effects on IPA of Ticagrelor |
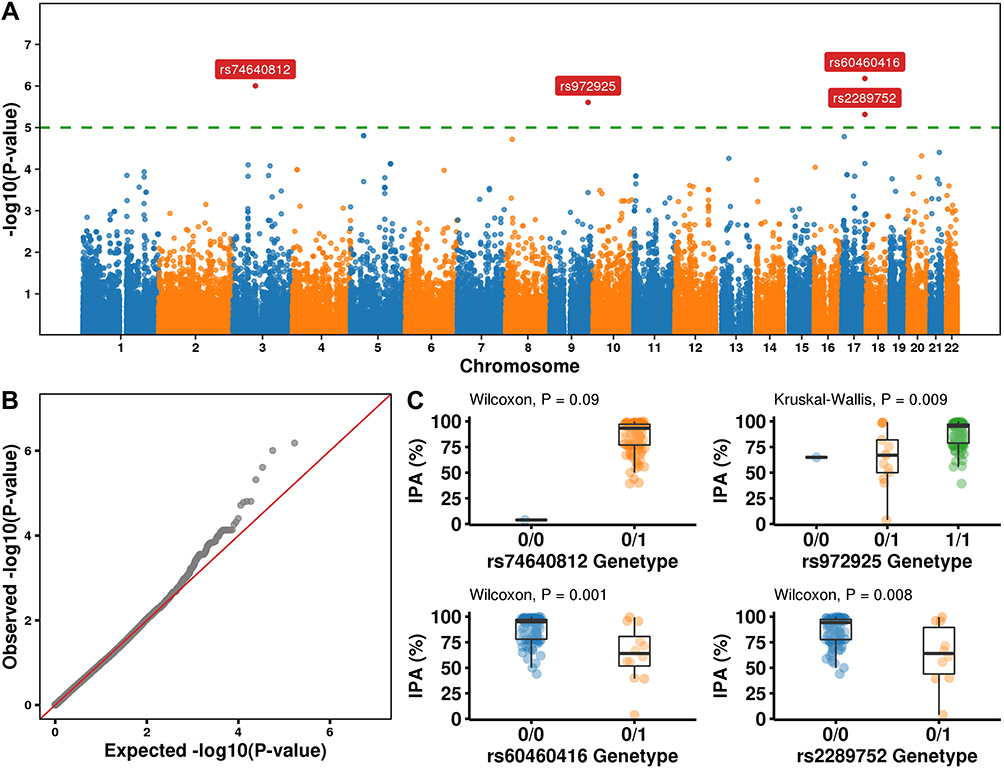 |
Figure 4 Whole-exome association study with IPA. (A) Manhattan plots showing ACS susceptibility loci discovered in the Chinese ACS WES dataset. Horizontal lines represent the genome-wide threshold (P = 1.2 × 10⁻⁵, green). The 4 sites that survived the genome-wide threshold with gene symbols marked in the plot. (B) Q-Q plot. (C) The distribution of IPA in different SNP variation types. 0/0 None, 0/1 heterozygous, 1/1 homozygous variant. |
eQTLs and sQTLs Analysis of SNPs
In order to check the association between the genotype of newly identified SNPs and expression of genes, we specifically examined the possible regulation of gene expression by SNPs in the whole blood and liver tissues in GTEx database. However, rs74640812 and rs2289752 are missing in the GTEx database. rs972925 and rs60460416 had different effects on different genes in multiple tissues (Supplementary Table 3 and 4). In whole blood, rs2289752 and rs60460416 affected SOCS3 and PGS1 expression respectively (Figure 5A and B), and consistent with variable splicing event (Figure 5C). Meanwhile, these three genes (SOCS3, PGS1 and DNAH17) and two SNPs were located in close proximity to each other in the genome (Figure 5D).
 |
Figure 5 The effects of eQTLs and sQTLs on genes expression. (A) The effect of eQTLs rs972925 on expression of SOCS3 in liver and whole blood. (B) The effect of eQTLs rs60460416 on expression of SOCS3 in liver and whole blood. (C) The effect of sQTLs rs972925 (top) or rs60460416 (bottom) on intron-expression ratio in whole blood. (D) The location of SNPs and genes in genome. |
Region-Based Tests of Rare and Common DNA Variants
Changes in some traits may be the result of a combination of rare and common variants. To identify the effect of rare variants on the IPA, we obtained P values for association with genes using the CommonRare and SKAT-O (Figure 6A and B). IL20, PNN; MIA2, DUSP15, DYNC1LI1 and DSCC1 had a strong correlation with IPA (Figure 6C), and the SNPs detail in Table 3 and Supplementary Table 5.
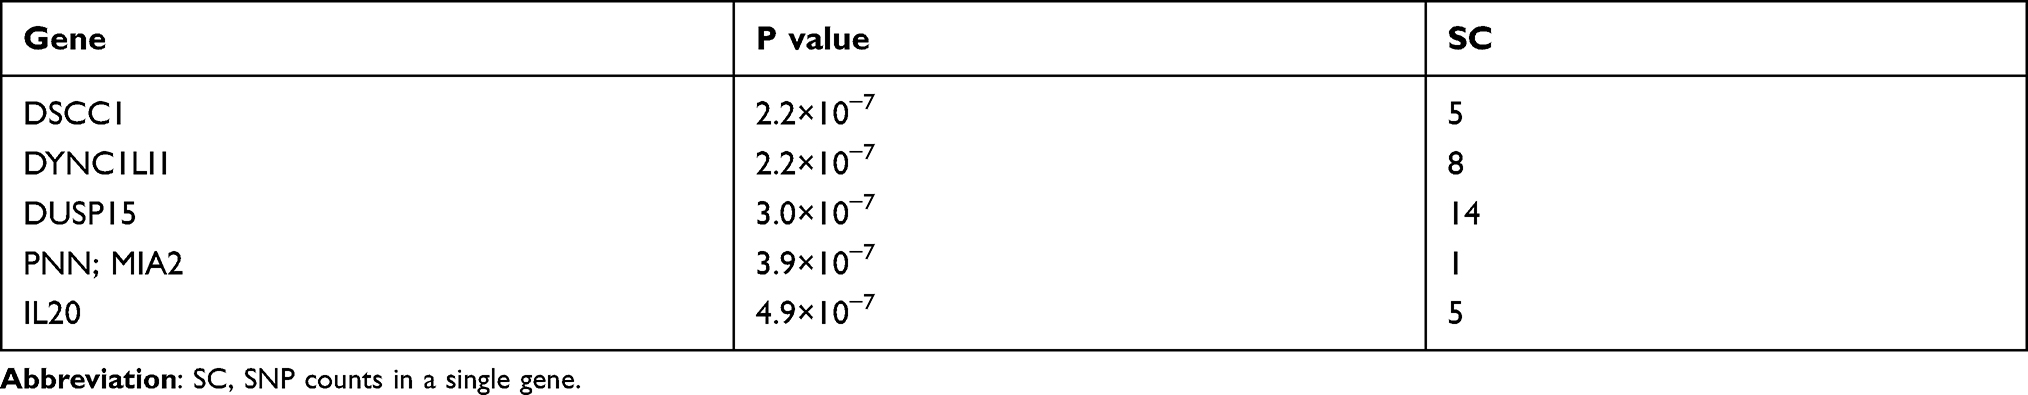 |
Table 3 Results for SKAT-CommonRare |
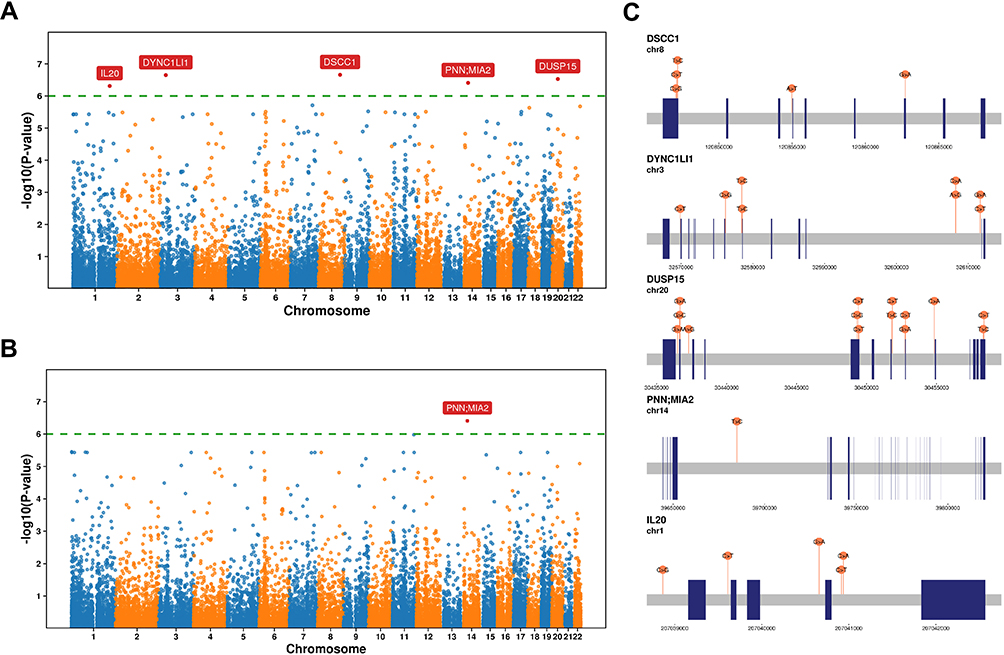 |
Figure 6 Region-based tests of rare and common DNA variants. (A and B) Manhattan plots showing P values for association with genes using the SKAT-CommonRare (A) and SKAT-O (B). (C) The schematic diagram shows the location of the variant site in each gene. |
Enrichment of Related Pathways of Variants
Many variants are associated with the pharmacogenetics of ticagrelor, but the effect of each variant seems to be small. To further clarify the relationship between genes, we performed a co-expression analysis. These genes are clearly divided into three groups (yellow group, PGS1, DNAH17, DYNC1L1 and ABCA1; purple group, N6AMT1, PNN, DSCC1, MIA2, DUSP15, FRG2C; green group, UGT2B7, CYP3A4, SLCO1B1) in blood, and the expression is highly positively correlated within each gene set (Figure 7A). Similar results were showed in liver (Figure 7B). For protein level, PPI network was constructed among all the IPA-related genes (Supplementary Figure 4). The analysis revealed a remarkable interactions among DNAH17, DYNC1L1 and DSCC1; DUSP15, N6AMT1 and SLC14A2; UGT2B7, SLCO1B1, CYP3A4 and ABCA1.
 |
Figure 7 Co-expression analysis. (A and B) Expression correlation analysis among ticagrelor associated genes in the blood (A) and liver tissues (B). |
To gain further biological insight, PASCAL was used for gene set enrichment analysis in SNP levels reconstituted gene sets, which was performed in DEPICT.25 We found that 10 gene sets were significant enrichment (P < 0.001, Figure 8A). Indicated enrichment of genes involved in the regulation of IPA across fibronectin-binding (GO:0001968), negative regulation of smooth muscle cell proliferation (GO:0048662), negative regulation of gene expression and epigenetic (GO:0045814), pyrimidine-containing compound catabolic process (GO:0072529). The genes in the above four GO sets were used to construct PPI network (Figure 8B).
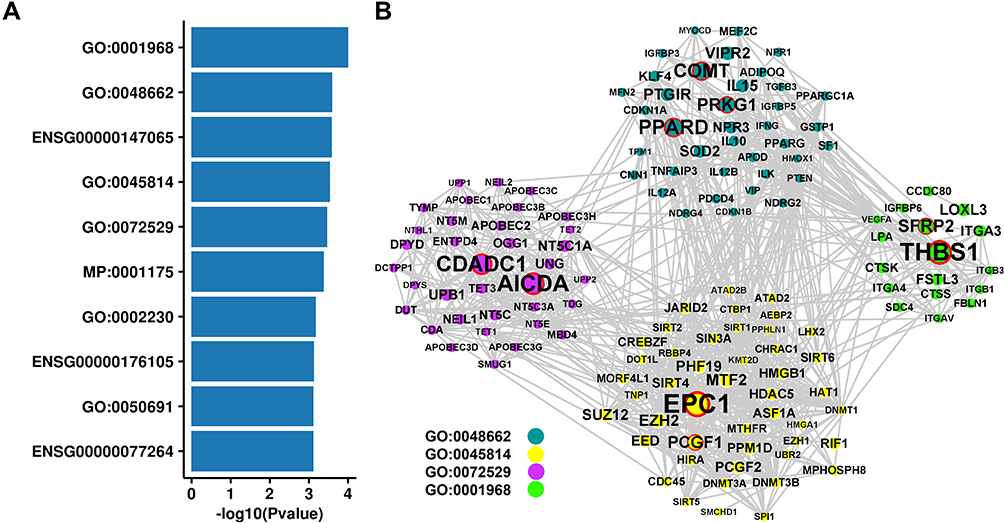 |
Figure 8 Related pathways of variants. (A) The top 10 significant enrichment of gene sets. (B) PPI network for four Go gene sets. |
Validation of Key Gene Variants Associated with Ticagrelor Pharmacokinetics
Some studies find that ticagrelor pharmacokinetics is affected by the polymorphism of UGT2B7, CYP3A4, and SLCO1B1;26 ADORA2A;27 SLC14A2, ABCA1 and N6AMT1.28 However, another study reported that the pharmacokinetics and pharmacodynamics of ticagrelor are not affected by SLCO1B1 and CYP3A4/5 polymorphisms in healthy Chinese male subjects.29 To study the universality of these studies in the Chinese population, we used our data to re-validate previous studies. Because our data is exon sequencing that SNPs located in other regions cannot be observed, we used region-based analysis by SKAT-CommonRare combined effect of rare and common variants. The input SNPs of region-based analysis were in Supplementary Table 6. We found a significant independent association between ABCA1 and IPA (Table 4).
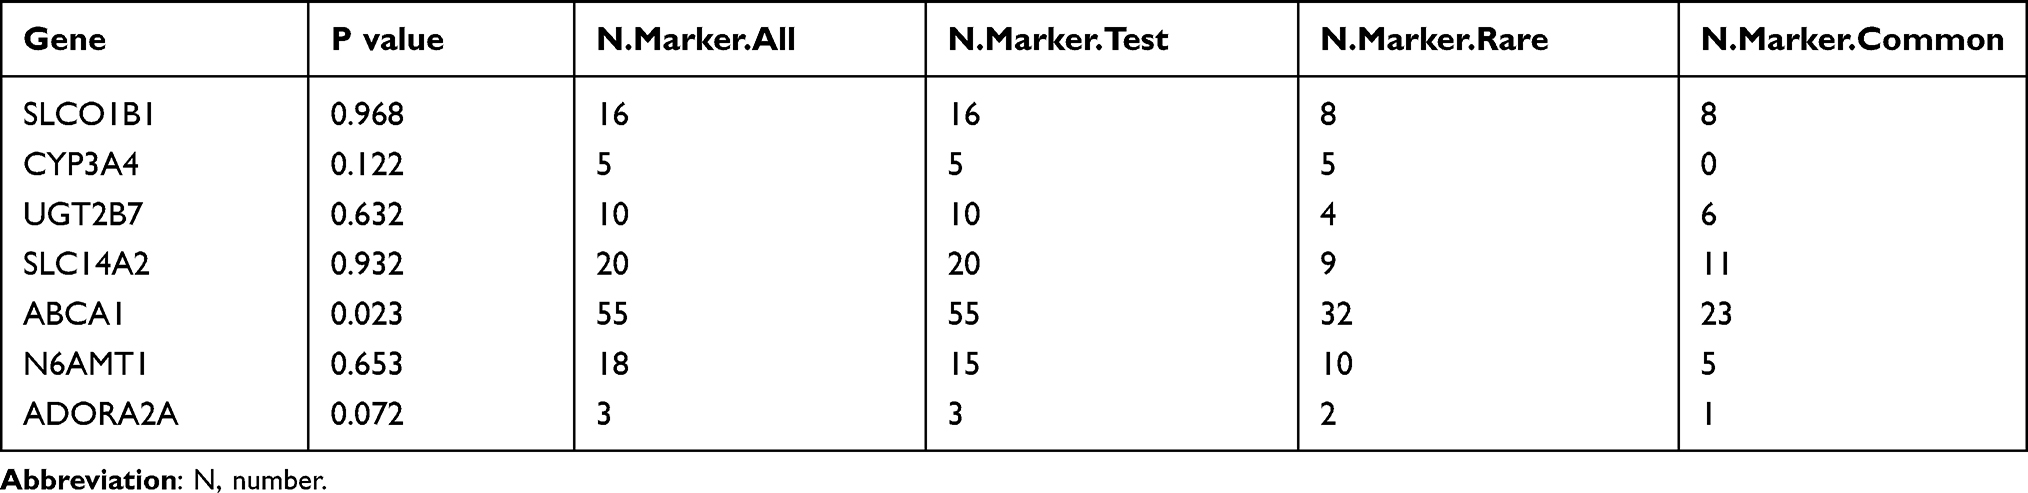 |
Table 4 The Combined Effect of Rare and Common Variants in Genes |
External Data Validation
To verify the candidate SNPs, UK Biobank (https://atlas.ctglab.nl/) resource, a database of publicly available GWAS summary statistics, was selected for external data validation. rs60460416 was associated with the high blood pressure and vasodilators used in cardiac diseases. rs2289752 was associated with the plateletcrit and platelet count. rs972925 was associated with the leukemia inhibitory factor receptor, heart disease and serum total cholesterol (Figure 9).
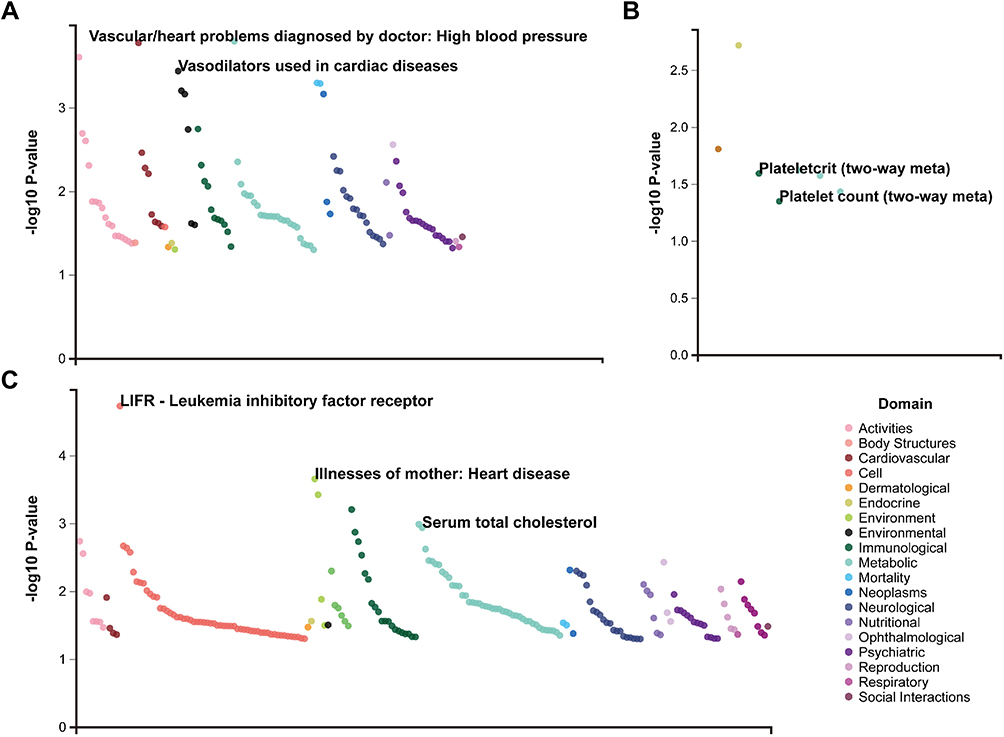 |
Figure 9 UK Biobank resource for external data validation. (A) rs60460416. (B) rs2289752. (C) rs972925. |
Discussion
To our knowledge, we are the first to use WES data to study the genomic and physiological parameters influences of bleeding and IPA in the Chinese population after PCI with ticagrelor treatment. The combination of ticagrelor and aspirin after PCI has been shown to reduce cardiovascular events in patients with ACS,30 and is a common approach to prevent ischemic complications, including stent thrombosis.31 PRU and percent inhibition after PCI were significantly associated with subsequent stent thrombosis.32 So, we measured and calculated PUR and IPA from 100 patients.
Our data revealed that most patients had a high IPA (mean = 84.7%) for ticagrelor and the efficacy in ticagrelor was confirmed. Prior PRU did not reflect the patient’s response to ticagrelor. In contrast, the post PRU may almost directly reflect the patient’s responsiveness to the ticagrelor. This suggests that we only need one measurement to get the patient’s response information to the ticagrelor. Notably, PFT results were found to predict not only thrombotic but also bleeding events.19 But, in another report, PFT does not reduce the risk of ischemic recurrences after an intervention. Platelet hyper-reactivity cannot be used as a risk factor to guide secondary intervention after PCI.33 We did not observe the ability of PRU and IPA to predict bleeding events in our data.
Our prospective study also showed an interesting fact that bleeding events are biased younger and male patients. PLT was closely related to ticagrelor response and bleeding events. Several studies have documented that the immature platelet count is a potential marker of platelet reactivity during antiplatelet drugs therapy.34,35 Therefore, our results proved that age, sex and PLT are potential risk factors to predict bleeding events.
Genetic variation constitutes an important contributor to interindividual differences in ticagrelor response. Two of the 4 significant SNPs (rs60460416, rs2289752) were found local in gene DNAH17 which was associated with the IPA reduction. But has not been reported that DNAH17 is the association of genetic variations with pharmacokinetics and platelet function. Bleeding events may be more complicated, so our limited WES data did not find a highly reliable independent locus.
Most of these variants have small effect sizes, but their downstream expression effects are often large and cell type-specific. So, it is necessary to use eQTLs and sQTLs to associate variations with gene expression, and explain gene regulation and interpreting disease-associated loci. The possible regulatory effects were specifically examined using identified IPA loci in the liver and blood by eQTLs and sQTLs. Both rs60460416 and rs2289752 tissue-specifically associate the expression and intron-excision ratio of SOCS3 and PGS1 in the blood. At the same time, we found that rs972925 and rs60460416 are close to SOCS3 and PGS1 in space. All of these results may indicate that rs972925 and rs60460416 may reside in enhancer or suppressor regions of SOCS3 and PGS1 and influence the expression of these genes. In order to avoid misunderstandings, we need to emphasize that SOCS3 is not a suppressor of cytokine signaling 3 but SOCS3 divergent transcript (ENSG00000266970) that is an RNA gene and is affiliated with the lncRNA class. PGS1 is a component of the large protein complex on the mitochondrial membrane and is involved in the synthesis of cardiolipin.36,37 We suggest that the function of SOCS3 and PGS1 was associated with IPA deserves further study.
Most studies are based on a larger population and were requested minor allele frequency (MAF) ≥ 1%, but rare variants have a contribution on phenotype.38 Region-based tests of rare and common DNA variants show that IL20, PNN; MIA2, DUSP15, DYNC1LI1 and DSCC1 have a strong correlation with IPA. MIA2 plays a role in the secretion of lipoproteins, pre-chylomicrons and pre-very-low-density lipoproteins (VLDLs), by participating in their export from the endoplasmic reticulum. Circulating chylomicrons and VLDLs have been identified as being an important player in the accumulation of atherosclerotic plaque in several studies.39
We observed the genetic associations that may be related to ticagrelor in previous studies in our WES data. It may be due to the lack of information on variant locus other than exons, and similar conclusions cannot be obtained when using a region-based test for genes SLCO1B1, CYP3A4, UGT2B7, SLC14A2, N6AMT1, ADORA2A. But our high coverage WES data validated the previously reported regulation of ABCA1 on IPA with ticagrelor. ABCA1 is a member of the superfamily of ATP-binding cassette (ABC) transporters, whose main function is to transport various molecules across membranes. One GWAS identifies rs2487032 (ABCA1) associated with PRU and modify antiplatelet effects of clopidogrel.28 There are also reports that ABCA1 is a protein as being an important player in cellular cholesterol homeostasis and HDL biosynthesis.40 Interestingly, the three genes DNAH17, PGS1 and ABCA1 we were focus on were co-expression. Genes are also co-expressed in the region-based test results. The previously reported green group genes (CYP3A4, UGT2B7 and SLC14A2) related to drug metabolism are also co-expressed. There are internal connections between genes in the same sets, and different sets may participate in different pathways and perform different functions. The results of the gene set enrichment analysis showed that GO:0072529 is related to the pyrimidine-containing compound catabolic process. Finally, we also performed a simple verification with the previous data. The SNPs we identified as related to IPA are indeed mainly related to cardiovascular disease.
Our analyses are limited by the study population (n = 100) and whole exon sequencing identified only a limited number of variants, with the rest located in intronic or intergenic regions. At present, there is a lack of data about variants of the candidate genes with IPA, which required larger samples of genetic research or functional verification to validate these results. The potential mechanisms of these candidate genes need to be further studied.
Conclusions
We first examined the predictive power of clinical characteristics on antiplatelet function and bleeding events of ticagrelor. Through multiple association analyses, we identified potential SNPs, genes and biological pathways associated with ticagrelor use risk. The internal association points to the synthesis and metabolism of various lipoproteins, and the metabolism of ticagrelor. Compared to previous studies, we have only partially verified the results, which may be influenced by multiple factors such as population and evaluation methods. All of these studies were designed to elucidate potential biological factors affecting the treatment of ticagrelor in the Chinese population and provide a scientific basis for accurate medication guides for people to use ticagrelor. Based on the rational use of clinical indicators and genotypes, it helps to balance the efficacy and bleeding risk in Chinese population, which is part of precision medicine.
Data Sharing Statement
No further data will be shared.
Ethics Approval and Consent to Participate
The study was approved by the Medical Ethics Committee of Zhengzhou Seventh People’s Hospital and conducted in accordance with the Declaration of Helsinki. Written informed consent was obtained from all volunteers in the study.
Acknowledgments
We would like to thank the support of study to pharmacogenomics and precision drug research of new antiplatelet drug ticagrelor of the 7th People’s Hospital of Zhengzhou. We are grateful to all patients who generously agreed to participate in this study.
Author Contributions
Dongdong Yuan and Didi Sun participated in the design of this study and wrote the manuscript. Dongdong Yuan enrolled patients and signed informed consent. Xiangfen Shi carried out sample testing. Liping Gao, Hanjuan Zhang and Gaobiao Wang performed sample processing and data analyses. Yuling Yang and Yujie Zhao implemented experimental and sample management. All authors made substantial contributions to conception and design, acquisition of data, or analysis and interpretation of data; took part in drafting the article or revising it critically for important intellectual content; agreed to submit to the current journal; gave final approval of the version to be published; and agree to be accountable for all aspects of the work.
Disclosure
The authors declare no conflicts of interest.
References
1. Cannon CP, Husted S, Harrington RA, et al. Safety, tolerability, and initial efficacy of AZD6140, the first reversible oral adenosine diphosphate receptor antagonist, compared with clopidogrel, in patients with non-ST-segment elevation acute coronary syndrome: primary results of the DISPERSE-2 trial. J Am Coll Cardiol. 2007;50(19):1844–1851. doi:10.1016/j.jacc.2007.07.053
2. Lars W, Becker Richard C, Andrzej B, et al. Ticagrelor versus clopidogrel in patients with acute coronary syndromes. N Engl J Med. 2009;361(11):1045–1057.
3. Mehran R, Baber U, Sharma SK, et al. Ticagrelor with or without Aspirin in high-risk patients after PCI. N Engl J Med. 2019;381(21):2032–2042. doi:10.1056/NEJMoa1908419
4. Hahn J-Y, Song YB, Oh J-H, et al. 6-month versus 12-month or longer dual antiplatelet therapy after percutaneous coronary intervention in patients with acute coronary syndrome (SMART-DATE): a randomised, open-label, non-inferiority trial. Lancet. 2018;391(10127):1274–1284. doi:10.1016/S0140-6736(18)30493-8
5. Hahn J-Y, Song YB, Oh J-H, et al. Effect of P2Y12 inhibitor monotherapy vs dual antiplatelet therapy on cardiovascular events in patients undergoing percutaneous coronary intervention: the SMART-CHOICE randomized clinical trial. JAMA. 2019;321(24):2428–2437. doi:10.1001/jama.2019.8146
6. Scott SA, Sangkuhl K, Stein CM, et al. Clinical pharmacogenetics implementation consortium guidelines for CYP2C19 genotype and clopidogrel therapy: 2013 update. Clin Pharmacol Ther. 2013;94(3):317–323. doi:10.1038/clpt.2013.105
7. Mega JL, Simon T, Collet J-P, et al. Reduced-function CYP2C19 genotype and risk of adverse clinical outcomes among patients treated with clopidogrel predominantly for PCI: a meta-analysis. JAMA. 2010;304(16):1821–1830. doi:10.1001/jama.2010.1543
8. Tantry US, Bliden KP, Wei C, et al. First analysis of the relation between CYP2C19 genotype and pharmacodynamics in patients treated with ticagrelor versus clopidogrel: the ONSET/OFFSET and RESPOND genotype studies. Circ Cardiovasc Genet. 2010;3:556–566. doi:10.1161/CIRCGENETICS.110.958561
9. Wallentin L, James S, Storey RF, et al. Effect of CYP2C19 and ABCB1 single nucleotide polymorphisms on outcomes of treatment with ticagrelor versus clopidogrel for acute coronary syndromes: a genetic substudy of the PLATO trial. Lancet. 2010;376(9749):1320–1328. doi:10.1016/S0140-6736(10)61274-3
10. Claassens DMF, Vos GJA, Bergmeijer TO, et al. A genotype-guided strategy for oral P2Y12 inhibitors in primary PCI. N Engl J Med. 2019;381:1621–1631. doi:10.1056/NEJMoa1907096
11. Martin J, Williams AK, Klein MD, et al. Frequency and clinical outcomes of CYP2C19 genotype-guided escalation and de-escalation of antiplatelet therapy in a real-world clinical setting. Genet Med. 2020;22(1):160–169. doi:10.1038/s41436-019-0611-1
12. Dangas G, Baber U, Sharma S, et al. Ticagrelor with aspirin or alone after complex PCI: the TWILIGHT-COMPLEX analysis. J Am Coll Cardiol. 2020;75(19):2414–2424. doi:10.1016/j.jacc.2020.03.011
13. Bhatt DL, Steg PG, Mehta SR, et al. Ticagrelor in patients with diabetes and stable coronary artery disease with a history of previous percutaneous coronary intervention (THEMIS-PCI): a phase 3, placebo-controlled, randomised trial. Lancet. 2019;394(10204):1169–1180. doi:10.1016/S0140-6736(19)31887-2
14. Bonaca MP, Bhatt DL, Cohen M, et al. Long-term use of ticagrelor in patients with prior myocardial infarction. N Engl J Med. 2015;372(19):1791–1800. doi:10.1056/NEJMoa1500857
15. Tousoulis D, Paroutoglou IP, Papageorgiou N, Charakida M, Stefanadis C. Recent therapeutic approaches to platelet activation in coronary artery disease. Pharmacol Ther. 2010;127(2):108–120. doi:10.1016/j.pharmthera.2010.05.001
16. Zhu Q, Zhong W, Wang X, et al. Pharmacokinetic and pharmacogenetic factors contributing to platelet function recovery after single dose of ticagrelor in healthy subjects. Front Pharmacol. 2019;10:209. doi:10.3389/fphar.2019.00209
17. Chinese Society of Cardiology of Chinese Medical Association, Editorial Board of Chinese Journal of Cardiology. 2019 Chinese Society of Cardiology (CSC) guidelines for the diagnosis and management of patients with ST-segment elevation myocardial infarction. Zhonghua Xin Xue Guan Bing Za Zhi. 2019;47(10):766–783. doi:10.3760/cma.j.issn.0253-3758.2019.10.003
18. Mehran R, Rao SV, Bhatt DL, et al. Standardized bleeding definitions for cardiovascular clinical trials: a consensus report from the Bleeding Academic Research Consortium. Circulation. 2011;123(23):2736–2747. doi:10.1161/CIRCULATIONAHA.110.009449
19. Sibbing D, Aradi D, Alexopoulos D, et al. Updated expert consensus statement on platelet function and genetic testing for guiding P2Y12 receptor inhibitor treatment in percutaneous coronary intervention. JACC Cardiovasc Interv. 2019;12(16):1521–1537. doi:10.1016/j.jcin.2019.03.034
20. Chang CC, Chow CC, Tellier LC, et al. Second-generation PLINK: rising to the challenge of larger and richer datasets. Gigascience. 2015;4(1):7. doi:10.1186/s13742-015-0047-8
21. Ardlie KG, Deluca DS, Segrè AV. Human genomics. The Genotype-Tissue Expression (GTEx) pilot analysis: multitissue gene regulation in humans. Science. 2015;348(6235):648–660. doi:10.1126/science.1262110
22. Lee S, Emond MJ, Bamshad MJ, et al. Optimal unified approach for rare-variant association testing with application to small-sample case-control whole-exome sequencing studies. Am J Hum Genet. 2012;91(2):224–237. doi:10.1016/j.ajhg.2012.06.007
23. Ionita-Laza I, Lee S, Makarov V, Buxbaum JD, Lin X. Sequence kernel association tests for the combined effect of rare and common variants. Am J Hum Genet. 2013;92(6):841–853. doi:10.1016/j.ajhg.2013.04.015
24. Lamparter D, Marbach D, Rueedi R, Kutalik Z, Bergmann S. Fast and rigorous computation of gene and pathway scores from SNP-based summary statistics. PLoS Comput Biol. 2016;12(1):e1004714. doi:10.1371/journal.pcbi.1004714
25. Akiyama M, Ishigaki K, Sakaue S, et al. Characterizing rare and low-frequency height-associated variants in the Japanese population. Nat Commun. 2019;10(1):4393. doi:10.1038/s41467-019-12276-5
26. Varenhorst C, Eriksson N, Å J, et al. Effect of genetic variations on ticagrelor plasma levels and clinical outcomes. Eur Heart J. 2015;36(29):1901–1912. doi:10.1093/eurheartj/ehv116
27. Nardin M, Verdoia M, Pergolini P, et al. Impact of adenosine A2a receptor polymorphism rs5751876 on platelet reactivity in ticagrelor treated patients. Pharmacol Res. 2018;129:27–33. doi:10.1016/j.phrs.2017.12.035
28. Zhong W-P, Wu H, Chen J-Y, et al. Genomewide association study identifies novel genetic loci that modify antiplatelet effects and pharmacokinetics of clopidogrel. Clin Pharmacol Ther. 2017;101(6):791–802. doi:10.1002/cpt.589
29. Li M, Hu Y, Li H, et al. No effect of SLCO1B1 and CYP3A4/5 polymorphisms on the pharmacokinetics and pharmacodynamics of ticagrelor in healthy Chinese male subjects. Biol Pharm Bull. 2017;40(1):88–96. doi:10.1248/bpb.b16-00686
30. Roe MT, Armstrong PW, Fox KAA, et al. Prasugrel versus clopidogrel for acute coronary syndromes without revascularization. N Engl J Med. 2012;367(14):1297–1309. doi:10.1056/NEJMoa1205512
31. Cuisset T, Verheugt FWA, Mauri L. Update on antithrombotic therapy after percutaneous coronary revascularisation. Lancet. 2017;390(10096):810–820. doi:10.1016/S0140-6736(17)31936-0
32. Stone GW, Witzenbichler B, Weisz G, et al. Platelet reactivity and clinical outcomes after coronary artery implantation of drug-eluting stents (ADAPT-DES): a prospective multicentre registry study. Lancet. 2013;382(9892):614–623. doi:10.1016/S0140-6736(13)61170-8
33. Montalescot G, Rangé G, Silvain J, et al. High on-treatment platelet reactivity as a risk factor for secondary prevention after coronary stent revascularization: a landmark analysis of the Arctic study. Circulation. 2014;129(21):2136–2143. doi:10.1161/CIRCULATIONAHA.113.007524
34. Stratz C, Bömicke T, Younas I, et al. Comparison of immature platelet count to established predictors of platelet reactivity during thienopyridine therapy. J Am Coll Cardiol. 2016;68(3):286–293. doi:10.1016/j.jacc.2016.04.056
35. Verdoia M, Pergolini P, Rolla R, et al. Impact of long-term dual antiplatelet therapy on immature platelet count and platelet reactivity. Angiology. 2018;69(6):490–496. doi:10.1177/0003319717736407
36. Chang SC, Heacock PN, Clancey CJ, Dowhan W. The PEL1 gene (renamed PGS1) encodes the phosphatidylglycero-phosphate synthase of Saccharomyces cerevisiae. J Biol Chem. 1998;273(16):9829–9836. doi:10.1074/jbc.273.16.9829
37. Serricchio M, Vissa A, Kim PK, Yip CM, McQuibban GA. Cardiolipin synthesizing enzymes form a complex that interacts with cardiolipin-dependent membrane organizing proteins. Biochim Biophys Acta Mol Cell Biol Lipids. 2018;1863(4):447–457. doi:10.1016/j.bbalip.2018.01.007
38. Bomba L, Walter K, Soranzo N. The impact of rare and low-frequency genetic variants in common disease. Genome Biol. 2017;18(1):77. doi:10.1186/s13059-017-1212-4
39. Santos AJM, Nogueira C, Ortega-Bellido M, Malhotra V. TANGO1 and Mia2/cTAGE5 (TALI) cooperate to export bulky pre-chylomicrons/VLDLs from the endoplasmic reticulum. J Cell Biol. 2016;213(3):343–354. doi:10.1083/jcb.201603072
40. Phillips MC. Is ABCA1 a lipid transfer protein? J Lipid Res. 2018;59(5):749–763. doi:10.1194/jlr.R082313
 © 2022 The Author(s). This work is published and licensed by Dove Medical Press Limited. The
full terms of this license are available at https://www.dovepress.com/terms
and incorporate the Creative Commons Attribution
- Non Commercial (unported, 3.0) License.
By accessing the work you hereby accept the Terms. Non-commercial uses of the work are permitted
without any further permission from Dove Medical Press Limited, provided the work is properly
attributed. For permission for commercial use of this work, please see paragraphs 4.2 and 5 of our Terms.
© 2022 The Author(s). This work is published and licensed by Dove Medical Press Limited. The
full terms of this license are available at https://www.dovepress.com/terms
and incorporate the Creative Commons Attribution
- Non Commercial (unported, 3.0) License.
By accessing the work you hereby accept the Terms. Non-commercial uses of the work are permitted
without any further permission from Dove Medical Press Limited, provided the work is properly
attributed. For permission for commercial use of this work, please see paragraphs 4.2 and 5 of our Terms.