
Back to Journals » International Journal of Women's Health » Volume 18
Identification of Important Risk Factors for Hypoproteinemia in Polycystic Ovaries Patients
Received 30 October 2025
Accepted for publication 29 January 2026
Published 5 March 2026 Volume 2026:18 577943
DOI https://doi.org/10.2147/IJWH.S577943
Checked for plagiarism Yes
Review by Single anonymous peer review
Peer reviewer comments 2
Editor who approved publication: Dr Vinay Kumar
Ziqi Cheng, Yapei Lu
Department of Gynecology, Fuyang Campus of Zhejiang Provincial People’s Hospital (The First People’s Hospital of Fuyang), Hangzhou, Zhejiang, People’s Republic of China
Correspondence: Ziqi Cheng, Department of Gynecology, Fuyang Campus of Zhejiang Provincial People’s Hospital (The First People’s Hospital of Fuyang), Hangzhou, Zhejiang, People’s Republic of China, Email [email protected]
Objective: To identify the significant influencing factors of hypoproteinemia in patients with polycystic ovary syndrome.
Methods: This cross-sectional investigation utilized data from the Medical Information Mart for Intensive Care IV (MIMIC-IV) database. Multifactorial logistic regression analysis was employed to explore factors influencing hypoproteinemia. Receiver operating characteristic (ROC) analysis and decision curve analysis (DCA) were conducted to compare the discrimination performance and net clinical benefit of influencing factors for hypoproteinemia. The XGBoost algorithm was used to identify crucial variables. The relationships between key factors and hypoproteinemia were explored using restricted cubic spline (RCS) analysis. The stability of this relationship was verified through sensitivity analyses, including trend regression analysis and interaction tests.
Results: 115 patients with polycystic ovary syndrome or polycystic ovaries were included in this study, of whom 24.348% were hypoproteinemia. Calcium, prothrombin time, and hyperlipidemia were the most stable independent associations with hypoproteinemia. Among the three, calcium had the highest AUC (0.737) and sensitivity (0.839), while hyperlipidemia showed the highest specificity (0.954). The combination of hyperlipidemia and calcium significantly enhanced the net clinical benefit compared to single hyperlipidemia or calcium. Calcium may be the more critical factor with a stable influence on hypoproteinemia than hyperlipidemia.
Conclusion: The combination of calcium and hyperlipidemia may serve as a superior discriminative factor of hypoproteinemia, with calcium potentially being the more crucial factor. A value below the normal range threshold for calcium levels is a good early warning reference for hypoproteinemia.
Keywords: hypoproteinemia, calcium, polycystic ovary syndrome, hyperlipidemia
Introduction
Polycystic ovary syndrome (PCOS) is a common endocrine and metabolic disorder in women, with a global prevalence of about 33% in their reproductive age.1 This condition is believed to be a complex disease, influenced by many factors such as environmental and epigenetic factors. External triggers may include dietary and lifestyle choices, while internal factors may encompass inflammation and oxidative stress.2 PCOS is frequently linked to abdominal obesity, insulin resistance (IR), metabolic disturbances, and cardiovascular risk factors.3 The primary characteristics of PCOS are polycystic ovaries, persistent anovulation, and elevated androgen levels.4 Hyperandrogenemia is observed in 60–80% of PCOS patients,5 which is the main physiopathologic mechanism of PCOS. Some research indicates hyperandrogenism leads to reproductive, metabolic, and facial changes that negatively impact the patient’s quality of life.6 In addition, PCOS can cause pregnancy-related complications such as gestational diabetes mellitus and gestational hypertension, and may affect mental health, potentially causing anxiety, depression, bulimia, and bipolar disorder.7 Focusing on the health of PCOS patients can help to improve their overall well-being and life quality.
Serum albumin, as a significant biomarker, exhibits certain abnormalities in patients with PCOS. Research indicates that serum albumin levels in PCOS patients are frequently lower than in healthy controls, and the C-reactive protein/albumin ratio demonstrates an even stronger association with PCOS than traditional indicators such as hyperandrogenism or IR.8,9 Human albumin is the most abundant circulating protein, accounting for approximately 50–60% of total plasma proteins in healthy individuals.10 One of the most important roles of albumin is the maintenance of osmolality.11 It is also said to have immunomodulatory and antioxidant properties.12 Albumin also plays an important role as a transporter protein. The normal serum albumin concentration ranges from 3.5 to 5 g/dL, with levels below 3.5 g/dL indicating hypoproteinemia.13 Hypoproteinemia has been associated with mortality in many diseases, such as uremia and chronic heart failure,14,15 as well as increased risk of infections and post-surgical complications.16–18 Obesity, lifestyle, organ failure, and severity of inflammation were associated with the occurrence of hypoproteinemia.19 It is noteworthy that calcium levels and dyslipidaemia may also contribute to the development of hypoproteinemia. For instance, ionised calcium levels exhibit a significant positive correlation with albumin concentration,20 while lipid metabolism abnormalities may influence albumin synthesis.21
PCOS and hypoproteinemia share multiple potential risk factors, such as obesity, IR, and chronic low-grade inflammation. However, no studies have systematically investigated the prevalence of hypoproteinemia and its associated factors in the PCOS population, nor have there been in-depth analyses of the association between key metabolic indicators like calcium and lipids and hypoproteinemia. Consequently, this study represents the first to focus on identifying risk factors for hypoproteinemia in PCOS patients, aiming to address this research gap. Through systematic analysis, this study seeks not only to reveal independent clinical and metabolic factors influencing hypoproteinemia in PCOS patients (with particular emphasis on calcium and lipid), but also to provide evidence-based foundations for establishing early risk identification strategies in this population. Identifying these key factors holds significant practical implications for the clinical early screening of high-risk individuals and the implementation of targeted interventions to improve the long-term prognosis of PCOS patients.
Materials and Methods
Data Source and Study Population
This research employed a cross-sectional design, utilizing data from the publicly accessible Medical Information Mart for Intensive Care IV (MIMIC-IV) database. The MIMIC-IV provides a comprehensive compilation of clinical data and well-designed physical views. One author of this study obtained permission to access and extract the relevant data. As patient identifiers were removed before public release, ethical approval and patient consent were not required.22 This study has been granted authorisation to access and utilise the MIMIC-IV database (certification number: 55710882).
Initially, 634 patients were extracted from MIMIC-IV who were eligible for polycystic ovary syndrome (code: E282) or polycystic ovaries (code: 2564). The final analysis included 115 patients with available albumin data.
Definition of Hypoproteinemia
The normal serum albumin concentration ranges from 3.5 to 5 g/dL, with levels below 3.5 g/dL indicating hypoproteinemia.13 Thus, Albumin levels were categorized based on a 3.5 g/dL threshold. Patients with albumin <3.5 g/dL were classified as hypoproteinemia, while those with albumin ≥3.5 g/dL were deemed non- hypoproteinemia.
Variables Collected
The study gathered information on participants’ demographics, lifestyle behaviors, health conditions, insurance (Medicaid and Medicare), and laboratory tests. Demographic factors encompassed age, marital status, body mass index (BMI), and race (white and non-white). Marital status was categorized into married and other, and the other included single, divorced, and widowed. Lifestyle behaviors primarily focused on smoking and alcohol use. Health conditions included hyperlipidemia, hypertension, hypothyroidism, obesity, diabetes, chronic obstructive pulmonary disease (COPD), and liver disease. Medication usage data for spironolactone and metformin were also collected. Laboratory data included alanine aminotransferase (ALT), anion gap (AG), aspartate aminotransferase (AST), bicarbonate, blood urea nitrogen (BUN), potassium, sodium, calcium, chloride, creatinine, glucose, hematocrit, hemoglobin, platelets, prothrombin time (PT), red blood cell distribution width (RDW), white blood cell (WBC) and total bilirubin (TBil).
Statistical Analysis
For categorical data, frequency counts and percentages were used for descriptive statistics, and statistical inferences were made using the Chi-square test or Fisher’s test. Continuous data were assessed for normality using the Shapiro–Wilk test. Non-normally distributed data were described using median and quartiles, with group comparisons performed using the Mann–Whitney U-test. Normally distributed data were characterized by mean and standard deviation, with group comparisons conducted using t-tests. Continuous variables with statistically significant differences in the comparisons underwent multiple imputation using the “mice” package in R. The imputed data were again compared between groups to assess the stability. Collinearity diagnostics were employed to detect multicollinearity among the final screened variables, with a variance inflation factor (VIF) > 10 indicating collinearity. When collinearity occurred, we removed the variable with the largest VIF value and ran the remaining variables through a collinearity diagnostic to make it clear that there was no collinearity between variables.
Data before and after imputation were analyzed using multifactorial logistic regression analysis to explore the impact of differential variables on hypoproteinemia. Variables were included in the logistic regression analysis via the enter method. Given the small sample size, we utilised all available data to fit the final logistic regression analysis, thereby maximising the use of existing information to estimate effect sizes. The robustness of the results from the logistic regression analysis for difference variables was validated using the Bootstrapping method (B=2000). Under small sample sizes or suboptimal conditions, confidence intervals (CI) constructed using bias-corrected accelerated (BCa) Bootstrap provide more precise coverage. Similarly, all available data were employed to identify key influencing variables for hypoproteinemia via the XGBoost algorithm. Receiver operating characteristic (ROC) analysis was used to compare the discrimination performance of influencing factors, and the DeLong test was employed to compare the area under the curve (AUC) of the different ROC curves. Decision curve analysis (DCA) was performed to assess the net clinical benefit of significant influencing variables in discriminating hypoproteinemia.
To identify the key influencing factors, the association between differential variables and albumin level was further examined. Restricted cubic spline (RCS) analysis was employed to investigate the relationship between key factors and hypoproteinemia. The “ROCnReg” package in R was used to construct adjusted ROC curves for key factors discriminating hypoproteinemia after adjusting for other variables. The levels of key factors were categorized into different variables based on quartiles, ROC best cutoffs, and RCS cutoffs to further explore the association with hypoproteinemia. Additionally, interaction analysis was conducted to determine if other significant variables might be associated with the key factors that influence hypoproteinemia. These steps were taken to confirm the consistency of the relationship between key factors and hypoproteinemia. Statistical analyses were performed using IBM SPSS Statistics 25 and R software (version 4.4.2), with P<0.05 considered statistically significant.
Results
Baseline Information
This study analyzed 115 patients with PCOS or polycystic ovaries, with a median albumin level of 3.900 mg/dL. The median age of participants was 32 years old, and their race was primarily white. Smoking (5.217%) and drinking (6.087%) were uncommon among the participants. Of the study population, 28 individuals (24.348%) had hypoproteinemia. Tables 1 and 2 present the basic information of patients and a comparison between the two groups. Hypoproteinemia patients showed a higher prevalence of hyperlipidemia compared to non-hypoproteinemia patients (17.857% vs 4.598%) (P=0.023). Moreover, the hypoproteinemia group exhibited lower levels of sodium, calcium, hematocrit, and hemoglobin, while PT and RDW levels were higher (all P< 0.05).
 |
Table 1 The Categorical Variables Information of Participants |
 |
Table 2 The Continuous Variables Information of Participants |
The Related Factors of Hypoproteinemia
To eliminate the effect of missing data, multiple imputation was performed on the raw data of several continuous variables that differed between the hypoproteinemia group and the non-hypoproteinemia group. Sodium, calcium, hemoglobin, hematocrit, PT, and RDW remained significantly different between groups before and after imputation (all P<0.05), demonstrating result stability (Table 3). Multiple collinearity diagnosis was performed to exclude collinearity for the 7 variables that differed between the hypoproteinemia group and the non-hypoproteinemia group (Figure 1). The results showed strong collinearity between hemoglobin and hematocrit with VIF>10 (VIF 1). After removing hemoglobin, which had the highest VIF, the remaining 6 variables were re-analyzed for multiple collinearity diagnosis and found to be free of collinearity (VIF 2). These 6 variables were subsequently included in further analysis.
 |
Table 3 The Comparison of the Differed Continuous Variables After Imputation |
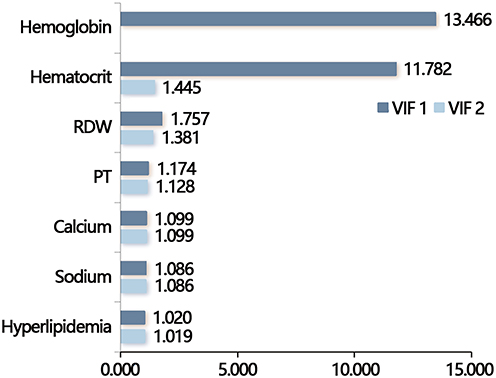 |
Figure 1 Results of collinearity analysis for the different variables. VIF 1 involved the variables of hemoglobin, hematocrit, RDW, PT, calcium, sodium, and hyperlipidemia; VIF 2 involved the variables of hematocrit, RDW, PT, calcium, sodium, and hyperlipidemia. Abbreviations: VIF, Variance inflation factor; PT, Prothrombin time; RDW, Red blood cell distribution width. |
The six identified variables were incorporated into a multifactorial logistic regression analysis. Before imputation, calcium (OR =0.236, 95% CI: 0.236–0.764), PT (OR =1.300, 95% CI: 1.060–1.749), RDW (OR =1.452, 95% CI: 1.032–2.170), and hyperlipidemia (OR =11.443, 95% CI: 1.724–86.673) were associated with hypoproteinemia. After imputation, calcium (OR =0.314, 95% CI: 0.118–0.740), PT (OR =1.248, 95% CI: 1.063–1.500), sodium (OR =0.827, 95% CI: 0.694–0.966), and hyperlipidemia (OR =11.899, 95% CI: 2.090–75.887) were also associated with hypoproteinemia. Results revealed that calcium, PT, and hyperlipidemia were independently associated with hypoproteinemia both before and after imputation, with consistent outcomes (Table 4). Table 5 presents the OR (95% CI) for BCa bootstrapping. The results similarly demonstrated that calcium, PT, and hyperlipidemia were all independently associated with hypoproteinemia, indicating that our findings exhibited relative robustness.
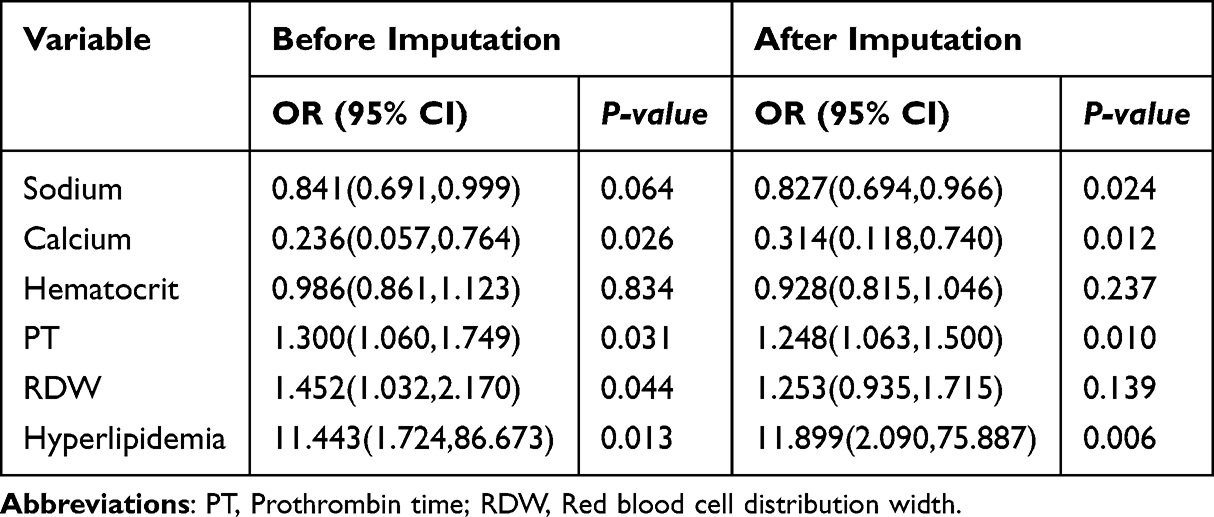 |
Table 4 Results of Logistic Regression Analysis of Influencing Factors Associated with Hypoproteinemia Before and After Imputation |
 |
Table 5 Results of Logistic Regression Analysis Based on Bootstrapping (B=2000) of Influencing Factors Associated with Hypoproteinemia |
Evaluation of Discrimination Performance and Clinical Value
The three more stable influencing factors (calcium, PT, and hyperlipidemia) underwent ROC analysis to assess their ability to discriminate hypoproteinemia (Table 6). The results indicated that the AUC value of calcium (0.737) surpassed that of PT (0.731) and hyperlipidemia (0.566) (DeLong test P<0.001). Among these factors, calcium demonstrated the highest sensitivity (0.839) with an optimal cutoff of 8.6 mg/dL, while hyperlipidemia exhibited the highest specificity (0.954). The ROC findings suggested that the combination of calcium and hyperlipidemia may be a crucial indicator of hypoproteinemia.
 |
Table 6 ROC Analysis Results for Related Factors in Hypoproteinemia Discrimination |
The XGBoost algorithm was employed to rank the variables. The results revealed that hyperlipidemia and calcium were important factors of hypoproteinemia (Figure 2A). DCA analysis found that the combination of calcium and hyperlipidemia significantly enhanced the clinical net benefit compared with the single use of hyperlipidemia or calcium, which may compensate for the shortcomings of a single factor in discriminating hypoproteinemia to some extent (Figure 2B).
 |
Figure 2 (A) Variable importance hierarchy for hypoproteinemia based on the XGBoost algorithm. (B) The discrimination performance of calcium and hyperlipidemia on hypoproteinemia. Abbreviations: PT, Prothrombin time; RDW, Red blood cell distribution width. |
Association Between Calcium and Hypoproteinemia
We further analyzed the relationship of calcium and PT with albumin, as well as the distribution of albumin in the two groups with or without hyperlipidemia (Figure 3A–C). The results suggested that there was a positive correlation between calcium and albumin (r=0.42, P<0.001), and a negative correlation between PT and albumin (r=−0.35, P<0.001). The albumin difference between groups with or without hyperlipidemia approached statistical significance (P=0.04, nearing 0.05). Considering the ROC and DCA results, calcium may be a more critical factor.
 |
Figure 3 (A) Visualization of the correlation between calcium and albumin; (B) Visualization of the correlation between PT and albumin; (C) The distribution of albumin in the two groups with or without hyperlipidemia; (D) RCS curve of calcium and hypoproteinemia. |
The results of RCS analysis demonstrated a linear relationship between calcium and hypoproteinemia (P for overall = 0.034, P for nonlinear= 0.263). Notably, when calcium levels exceeded 9.113 mg/dL, the OR for hypoproteinemia occurrence shifted (Figure 3D). In the crude ROC curve, the AUC was 0.737 (blue line) for calcium, and the adjusted ROC curve showed an AUC of 0.732 (red line) for calcium, indicating that calcium discriminated hypoproteinemia performance more stably (Figure 4A and B).
 |
Figure 4 The discrimination performance of calcium on hypoproteinemia. (A) Crude ROC curve of calcium; (B) Adjusted ROC curve of calcium. Hematocrit, PT, hyperlipidemia, and RDW were adjusted. Abbreviations: AUC, Area under the curve; AAUC, Adjusted area under the curve; PT, Prothrombin time; RDW, Red blood cell distribution width. |
To validate the association between calcium and hypoproteinemia, continuous calcium values were transformed into categorical variables based on quartiles, ROC best cutoffs, and RCS cutoffs. The result indicated that higher calcium levels were associated with a decreased risk of hypoproteinemia (Figure 5A). Calcium levels below normal or below 9.113 mg/dL were risk factors for hypoproteinemia (OR<8.6 mg/dL =8.058, 95% CI: 3.117–20.834; OR<9.113mg/dL=4.167,95% CI: 1.161–14.953) (Figure 5B and C). The interaction results showed that PT (P for interaction = 0.339) and hyperlipidemia (P for interaction = 0.401) did not interact with calcium levels in influencing hypoproteinemia. In conclusion, the relationship between calcium and hypoproteinemia was stable.
 |
Figure 5 Association of calcium levels as a categorical variable with hypoproteinemia. (A) Calcium levels classified by quartiles; (B) Calcium levels categorized based on ROC best cutoff value of 8.6 mg/dL; (C) Calcium levels grouped according to RCS cutoff value of 9.113 mg/dL. |
Discussion
Research has demonstrated that hypoproteinemia can predict various diseases and mortality. Factors contributing to hypoproteinemia, such as protein-energy malnutrition, crystalloid overload, inflammation, and hepatic dysfunction, partially explain its association with poor prognosis.23 These factors are also present in PCOS. However, the influencing factors for hypoproteinemia have not been investigated in PCOS patients. Our study examined these aspects using the MIMIC-IV database and identified potential key factors. Multivariate analysis revealed that hyperlipidemia, calcium, and PT were stably associated with hypoproteinemia in PCOS patients. Compared with single hyperlipidemia or calcium index, the combination of hyperlipidemia and calcium significantly improved the net clinical benefit of discriminating hypoproteinemia, and it may compensate for the shortcomings of a single factor in discriminating hypoproteinemia to some extent. The identified key factors (such as hyperlipidemia and serum calcium levels) are all readily obtainable routine clinical laboratory indicators, providing direct justification for establishing a simple, low-cost initial risk screening tool within the PCOS population.
This study identified hyperlipidemia as a risk factor for hypoproteinemia. Hyperlipidemia involves abnormally high plasma levels of one or more lipids, characterized by elevated total cholesterol, low-density lipoprotein cholesterol, triglycerides, and reduced high-density lipoprotein cholesterol. It is linked to endocrine disorders like PCOS and diabetes mellitus.24–26 Hyperlipidemia can promote inflammation, exemplified by triglyceride-associated apolipoprotein C3 (ApoC3) activating NLRP3 inflammatory vesicles in human monocytes to promote inflammation.27,28 Inflammation increases capillary permeability and serum albumin escape, leading to expansion of the interstitial space and increased volume of albumin distribution. Increased capillary permeability and altered albumin kinetics will lead to the development of hypoproteinemia, with its severity related to the degree of inflammatory damage and patient mortality risk.19 Consequently, monitoring lipid profiles and inflammatory status in PCOS patients is crucial to prevent hypoalbuminemia. Notably, ROC analysis showed that hyperlipidemia had a specificity of 0.954 in differentiating hypoproteinemia, indicating that hyperlipidemia was an indicator of the absence of hypoproteinemia in PCOS patients.
The findings suggested that calcium concentrations may be more crucial in hypoproteinemia than in hyperlipidemia. As the most prevalent cation in the body, calcium is vital for various cellular functions, including neurotransmission, enzyme activity, myocardial function, coagulation, and other cellular functions. Research has demonstrated a correlation between serum calcium and albumin levels.29 The correlation results of the present study showed a positive correlation between calcium levels and albumin levels, aligning with previous research. Reduced calcium levels were considered a risk factor for hypoproteinemia development. Approximately 40% of serum calcium binds to calcium-binding proteins such as albumin to form bound calcium,30 and calcium deficiency may disrupt these binding processes, leading to decreased protein stability and consequent hypoproteinemia. The role of calcium ions in inflammatory responses should not be disregarded, as severe calcium deficiency could result in impaired inflammatory regulation, further exacerbating health issues. Calcium deficiency also impacts endocrine system function. Parathyroid hormone and calcitonin collaborate to regulate blood calcium levels. Prolonged calcium deficiency can trigger increased parathyroid hormone (PTH) secretion, and excess PTH in adipose tissue can cause protein energy depletion through browning,31,32 potentially contributing to hypoproteinemia development. In addition, the ROC results showed an optimal cut-off value of 8.6 mg/dL for calcium levels. Notably, 8.6 is the lower limit of the normal range for calcium in adults over 18 years old, suggesting that a value below the normal range threshold for calcium levels is a good early warning reference for hypoproteinemia.
Correlation analysis showed that albumin was negatively correlated with PT. Patients with hypoproteinemia had prolonged PT and decreased coagulation compared to patients with non-hypoproteinemia. Research has demonstrated that albumin forms bonds with coagulation factors, including calcium and factor IX,30,33 which promotes the transportation and activation of coagulation factors, thereby promoting blood coagulation. We hypothesized that when the concentration of albumin decreased, the concentration of coagulation factors decreased, leading to coagulation dysfunction and prolonged PT time. This finding suggested the importance of monitoring coagulation function in PCOS patients who develop hypoproteinemia to prevent potentially life-threatening excessive bleeding.
This study initially explored the possible key influencing factors of hypoproteinemia in PCOS patients, which provided a theoretical basis for improving the quality of life and prognosis of PCOS patients. However, this study also has the following limitations: (1) The sample size of patients with PCOS or polycystic ovaries retrieved from MIMIC-IV was small. (2) The research findings are primarily based on a single database, limiting the extrapolation of results. (3) This study was a cross-sectional study, which only allowed for association exploration, not causal inference. Therefore, larger-scale and multicentre studies are necessary to validate these findings.
Conclusion
Hypoproteinemia in PCOS patients was associated with hyperlipidemia, calcium levels, and PT, with calcium potentially being the most critical factor. To prevent hypoproteinemia and excessive bleeding, healthcare providers should monitor lipid profiles, calcium levels, and coagulation function in PCOS patients. Further large-sample studies are required to confirm the results of this research.
Data Sharing Statement
The data that support the findings of this study are available from the corresponding author upon reasonable request.
Ethics Approval and Consent to Participate
The Ethics Committee of The First People’s Hospital of Fuyang District deemed that this research is based on open-source data, so the need for ethics approval was waived.
Funding
There is no funding to report.
Disclosure
The authors report no conflicts of interest in this work.
References
1. Kulkarni S, Gupta K, Ratre P, et al. Polycystic ovary syndrome: current scenario and future insights. Drug Discov Today. 2023;28(12):103821. doi:10.1016/j.drudis.2023.103821
2. Sadeghi HM, Adeli I, Calina D, et al. Polycystic ovary syndrome: a comprehensive review of pathogenesis, management, and drug repurposing. Int J Mol Sci. 2022;23(2):583. doi:10.3390/ijms23020583
3. Escobar-Morreale HF. Polycystic ovary syndrome: definition, aetiology, diagnosis and treatment. Nat Rev Endocrinol. 2018;14(5):270–12. doi:10.1038/nrendo.2018.24
4. Rashid R, Mir SA, Kareem O, et al. Polycystic ovarian syndrome-current pharmacotherapy and clinical implications. Taiwan J Obstet Gynecol. 2022;61(1):40–50. doi:10.1016/j.tjog.2021.11.009
5. Stanczak NA, Grywalska E, Dudzinska E. The latest reports and treatment methods on polycystic ovary syndrome. Ann Med. 2024;56(1):2357737. doi:10.1080/07853890.2024.2357737
6. Ortiz-Flores AE, Luque-Ramirez M, Escobar-Morreale HF. Polycystic ovary syndrome in adult women. Med Clin. 2019;152(11):450–457. doi:10.1016/j.medcli.2018.11.019.
7. Patel S. Polycystic ovary syndrome (PCOS), an inflammatory, systemic, lifestyle endocrinopathy. J Steroid Biochem Mol Biol. 2018;182:27–36. doi:10.1016/j.jsbmb.2018.04.008
8. Upadhyay N, Almeida EA, Singh A, Madhu SV, Puri D, Mehndiratta M. Evaluation of CRP/Albumin ratio in polycystic ovarian syndrome. J Obstet Gynaecol India. 2024;74(2):165–169. doi:10.1007/s13224-023-01897-y
9. Kalyan S, Goshtesabi A, Sarray S, Joannou A, Almawi WY. Assessing C reactive protein/albumin ratio as a new biomarker for polycystic ovary syndrome: a case-control study of women from Bahraini medical clinics. BMJ Open. 2018;8(10):e021860. doi:10.1136/bmjopen-2018-021860
10. Fanali G, Di Masi A, Trezza V, Marino M, Fasano M, Ascenzi P. Human serum albumin: from bench to bedside. Mol Aspects Med. 2012;33(3):209–290. doi:10.1016/j.mam.2011.12.002
11. Chen CB, Hammo B, Barry J, Radhakrishnan K. Overview of albumin physiology and its role in pediatric diseases. Curr Gastroenterol Rep. 2021;23(8):11. doi:10.1007/s11894-021-00813-6
12. Merlot AM, Kalinowski DS, Richardson DR. Unraveling the mysteries of serum albumin-more than just a serum protein. Front Physiol. 2014;5:299. doi:10.3389/fphys.2014.00299
13. Pompili E, Zaccherini G, Baldassarre M, Iannone G, Caraceni P. Albumin administration in internal medicine: a journey between effectiveness and futility. Eur J Intern Med. 2023;117:28–37. doi:10.1016/j.ejim.2023.07.003
14. Hu J, Lv C, Hu X, Liu J. Effect of hypoproteinemia on the mortality of sepsis patients in the ICU: a retrospective cohort study. Sci Rep. 2021;11(1):24379. doi:10.1038/s41598-021-03865-w
15. Tan Y, Xiang W, Chen Y, Huang J, Sun D. Effect of hypoproteinemia on mortality of elderly male patients with chronic heart failure. Medicine. 2024;103(5):e37078. doi:10.1097/MD.0000000000037078
16. Valeriani E, Cangemi R, Carnevale R, et al. Hypoalbuminemia as predictor of thrombotic events in patients with community-acquired pneumonia. Int J Cardiol. 2024;404:131942. doi:10.1016/j.ijcard.2024.131942
17. Mohammadi A, Inanloo SH, Rezaeian A, et al. Hypo-albuminemia and perioperative renal transplant-related infections: a systematic review and meta-analysis. Urol J. 2024;21(5):274–282. doi:10.22037/uj.v21i.7943
18. Xu JR, Kosanam A, Arianpour K, Lamarre ED, Hyland CG, Ciolek PJ. Preoperative hypoalbuminemia predicts 30-day complications in head and neck microvascular surgery. Laryngoscope. 2025;135(2):648–656. doi:10.1002/lary.31716
19. Soeters PB, Wolfe RR, Shenkin A. Hypoalbuminemia: pathogenesis and Clinical Significance. JPEN J Parenter Enteral Nutr. 2019;43(2):181–193. doi:10.1002/jpen.1451
20. Butler SJ, Payne RB, Gunn IR, Burns J, Paterson CR. Correlation between serum ionised calcium and serum albumin concentrations in two hospital populations. Br Med J. 1984;289(6450):948–950. doi:10.1136/bmj.289.6450.948
21. Kaysen GA, Don B, Proteinuria SM. albumin synthesis and hyperlipidaemia in the nephrotic syndrome. Nephrol Dial Transplant. 1991;6(2):141–149. doi:10.1093/ndt/6.2.141
22. Johnson AEW, Bulgarelli L, Shen L, et al. MIMIC-IV, a freely accessible electronic health record dataset. Sci Data. 2023;10(1):1. doi:10.1038/s41597-022-01899-x
23. Allison SP, Lobo DN. The clinical significance of hypoalbuminaemia. Clin Nutr. 2024;43(4):909–914. doi:10.1016/j.clnu.2024.02.018
24. Karr S. Epidemiology and management of hyperlipidemia. Am J Manag Care. 2017;23(9 Suppl):S139–S148.
25. Alloubani A, Nimer R, Samara R. Relationship between hyperlipidemia, cardiovascular disease and stroke: a systematic review. Curr Cardiol Rev. 2021;17(6):e051121189015. doi:10.2174/1573403X16999201210200342
26. Buldak L, Marek B, Kajdaniuk D, et al. Endocrine diseases as causes of secondary hyperlipidemia. Endokrynol Pol. 2019;70(6):511–519. doi:10.5603/EP.a2019.0041
27. Welty FK. How do elevated triglycerides and low HDL-cholesterol affect inflammation and atherothrombosis? Curr Cardiol Rep. 2013;15(9):400. doi:10.1007/s11886-013-0400-4
28. Zewinger S, Reiser J, Jankowski V, et al. Apolipoprotein C3 induces inflammation and organ damage by alternative inflammasome activation. Nat Immunol. 2020;21(1):30–41. doi:10.1038/s41590-019-0548-1
29. Sadiq NM, Anastasopoulou C, Patel G, Badireddy M. Hypercalcemia. In: StatPearls. StatPearls Publishing; 2025.
30. Yu E, Physiology SS. Calcium. In: StatPearls. StatPearls Publishing; 2025.
31. Disthabanchong S, Vantanasiri K, Khunapornphairote S, Chansomboon P, Buachum N, Saeseow S. Severe hyperparathyroidism is associated with nutritional impairment in maintenance hemodialysis patients. Front Nutr. 2022;9:933918. doi:10.3389/fnut.2022.933918
32. Matikainen N, Pekkarinen T, Ryhanen EM, Schalin-Jantti C. Physiology of Calcium Homeostasis: an Overview. Endocrinol Metab Clin North Am. 2021;50(4):575–590. doi:10.1016/j.ecl.2021.07.005
33. Lombardi S, Aaen KH, Nilsen J, et al. Fusion of engineered albumin with factor IX Padua extends half-life and improves coagulant activity. Br J Haematol. 2021;194(2):453–462. doi:10.1111/bjh.17559
 © 2026 The Author(s). This work is published and licensed by Dove Medical Press Limited. The
full terms of this license are available at https://www.dovepress.com/terms
and incorporate the Creative Commons Attribution
- Non Commercial (unported, 4.0) License.
By accessing the work you hereby accept the Terms. Non-commercial uses of the work are permitted
without any further permission from Dove Medical Press Limited, provided the work is properly
attributed. For permission for commercial use of this work, please see paragraphs 4.2 and 5 of our Terms.
© 2026 The Author(s). This work is published and licensed by Dove Medical Press Limited. The
full terms of this license are available at https://www.dovepress.com/terms
and incorporate the Creative Commons Attribution
- Non Commercial (unported, 4.0) License.
By accessing the work you hereby accept the Terms. Non-commercial uses of the work are permitted
without any further permission from Dove Medical Press Limited, provided the work is properly
attributed. For permission for commercial use of this work, please see paragraphs 4.2 and 5 of our Terms.