Back to Journals » Drug Design, Development and Therapy » Volume 9
Hypoglycemic effect and mechanism of honokiol on type 2 diabetic mice
Authors Sun J, Fu X, Liu Y, Wang Y, Huo B, Guo Y, Gao X, Li W, Hu X
Received 21 July 2015
Accepted for publication 15 September 2015
Published 4 December 2015 Volume 2015:9 Pages 6327—6342
DOI https://doi.org/10.2147/DDDT.S92777
Checked for plagiarism Yes
Review by Single anonymous peer review
Peer reviewer comments 2
Editor who approved publication: Prof. Dr. Wei Duan
Jing Sun,1 Xueqi Fu,1–3 Ye Liu,1 Yongsen Wang,1 Bo Huo,1 Yidi Guo,1 Xuefeng Gao,1 Wannan Li,1–3,* Xin Hu1–3,*
1School of Life Sciences, 2Key Laboratory for Molecular Enzymology and Engineering of Ministry of Education, 3National Engineering Laboratory of AIDS Vaccine, School of Life Sciences, Jilin University, Changchun, People’s Republic of China
*These authors contributed equally to this work
Background: Honokiol is one of the main bioactive constituents of the traditional Chinese herbal drug Magnolia bark (Cortex Magnoliae officinalis, Hou Po). The aim of this study was to probe its anti-type 2 diabetes mellitus effects and the underlying mechanism.
Methods: Type 2 diabetic mouse model was established by intraperitoneally injecting with streptozotocin. Fasting blood glucose, body weight, and lipid profile were measured. The subcutaneous adipose tissue, skeletal muscle, and liver were isolated as well as homogenized. The phospho-insulin receptor β-subunit (IRβ), IRβ, phospho-AKT, AKT, phospho-ERK1/2, ERK1/2, phosphotyrosine, and actin were examined by Western blot assay. Cell viability or cytotoxicity was analyzed by using MTT method. The inhibitory potencies of honokiol on the protein tyrosine phosphatase 1B (PTP1B) activity were performed in reaction buffer. Molecular docking and dynamic simulation were also analyzed.
Results: In in vivo studies, oral treatment with 200 mg/kg honokiol for 8 weeks significantly decreases the fasting blood glucose in type 2 diabetes mellitus mice. The phosphorylations of the IRβ and the downstream insulin signaling factors including AKT and ERK1/2 significantly increase in adipose, skeletal muscle, and liver tissue of the honokiol-treated mice. Moreover, honokiol enhanced the insulin-stimulated phosphorylations of IRβ, AKT, and ERK1/2 in a dose-dependent manner in C2C12 myotube cells. Meanwhile, honokiol enhanced insulin-stimulated GLUT4 translocation. Importantly, honokiol exhibited reversible competitive inhibitory activity against PTP1B with good selectivity in vitro and in vivo. Furthermore, using molecular docking and dynamic simulation approaches, we determined the potential binding mode of honokiol to PTP1B at an atomic level.
Conclusion: These findings indicated the hypoglycemic effects of honokiol and its mechanism that honokiol improved the insulin sensitivity by targeting PTP1B. Therefore, our study may highlight honokiol as a promising insulin sensitizer for the therapy of type 2 diabetes.
Keywords: honokiol, T2DM, insulin sensitizer, PTP1B
Introduction
According to the latest data from the International Diabetes Federation, more than 382 million people are suffering from diabetes in 2013, and by 2035, this number will reach a staggering 592 million, causing 4.6 million deaths each year.1 Type 2 diabetes mellitus (T2DM) is the most common form and accounts for around 90% of all diabetes worldwide. T2DM is recognized as a group of metabolic disorders, characterized by hyperglycemia, dyslipidemia, and insulin resistance in its metabolic target tissues.2,3
Insulin, as the principal hormone controlling blood glucose, acts by stimulating glucose influx and metabolism in muscle and adipocytes and inhibiting gluconeogenesis in the liver.4 Under normal circumstances, insulin binds to the α-subunits of the heterotetrameric insulin receptor (IR) (α2, β2), increases flexibility of the activation loop to allow ATP to enter the catalytic site and stabilizes the activation loop in the active conformation by autophosphorylation on multiple tyrosyl residues,5 subsequently, evokes a cascade of phosphorylation events. Autophosphorylation enhances IR kinase activity and leads to recruitment of IRS proteins, followed by activation of phosphatidylinositol 3-kinase (PI3K), AKT, and finally the GLUT4 translocation and glucose uptake.4,6 Protein tyrosine phosphatase 1B (PTP1B) dephosphorylates the activated IR and IR substrate-1 (IRS-1), blocks insulin signal transduction, which made it a key negative regulator in insulin signaling pathway.7,8 Elchebly et al9 and Klaman et al10 generated PTP1B−/− mice by targeted disruption of the ATG-coding exon and targeting exons 5 and 6 (Ex5/6−/−), respectively. These PTP1B−/− mice displayed enhanced tyrosine phosphorylation of IR and IRS-1 in muscle and liver as a consequence of increased systemic insulin sensitivity.9,10 On the basis of these findings, PTP1B is considered as a key target for type 2 diabetes. Unfortunately, it is challenging to develop efficient small molecule inhibitors of PTP1B.11
Honokiol, a hydroxylated biphenolic compound (C18H18O2, molecular weight =266.33 kD) (Figure 1A), is one of the major bioactive constituents of Magnolia bark (the traditional Chinese herbal drug, Hou Po) with the content of 1%–5% in the dried bark naturally.12 In our previous study, we validated the antidiabetic activity of Magnolia bark.13 Honokiol is proved to be the pharmacologically effective component12 with the potent activity of antioxidant, anti-inflammatory, antibacterial, antitumor, and antianxiety antithrombotic.14–17 Recently, Atanasov et al18 demonstrated that honokiol functions as a novel nonadipogenic partial PPAR-γ activator in vitro. Choi et al19 reported that honokiol stimulates glucose uptake by activating PI3K-dependent AKT in L6 myotubes. Alonso-Castroa et al20 proved that honokiol stimulates glucose uptake in murine and human adipocytes. However, few studies involve both in its hypoglycemic effect in vivo and the underlying mechanism. Here, we explored the hypoglycemic potency and better understand its mechanisms in T2DM mouse model.
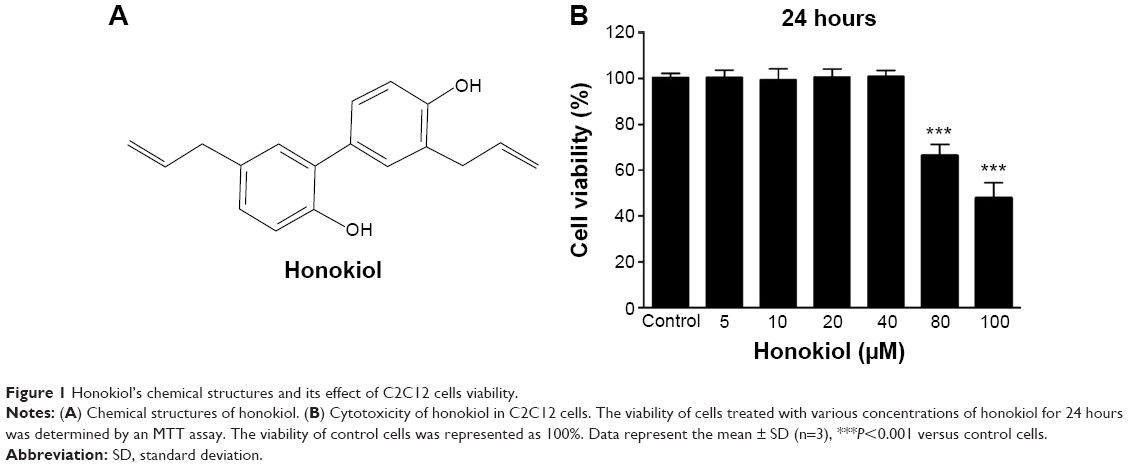 | Figure 1 Honokiol’s chemical structures and its effect of C2C12 cells viability. |
Materials and methods
Materials and chemicals
Honokiol was purchased from Aladdin (Xi’an, People’s Republic of China). Metformin was purchased from the Grent Jilin Medicine Store (Changchun, People’s Republic of China). Streptozotocin (STZ), bovine serum albumin (BSA), Tris, p-nitrophenyl phosphate (pNPP) were purchased from Sigma-Aldrich (St Louis, MO, USA). The kits for the analysis of total triglyceride (TG) and total cholesterol (TC) were purchased from Beijing BHKT (Beijing, People’s Republic of China). Polyvinylidene fluoride (PVDF) membranes was purchased from EMD Millipore (Billerica, MA, USA). The reagents for sodium dodecyl sulfate polyacrylamide gel electrophoresis (SDS-PAGE) and immunoblotting experiments were purchased from Sigma-Aldrich, and the necessary apparatus from Bio-Rad Laboratories Inc. (Hercules, CA, USA). C2C12 myoblasts were obtained from KeyGEN Biotech, and all cell culture reagents were from Thermo Fisher Scientific (Waltham, MA, USA). Recombinant proteins containing the catalytic domains of PTP1B, T cell protein tyrosine phosphatase (TCPTP), Src homology 2 (SH2) domain-containing tyrosine phosphatase 1 (SHP1), Src homology 2 (SH2) domain-containing tyrosine phosphatase 2 (SHP2), and hematopoietic protein tyrosine phosphatase (HePTP) were purified as previously described (Figure S1).21–24
Establishment of type 2 diabetic mouse model and treatment protocol
Fifty-five male Chinese Kunming mice, 8 weeks old and 18–22 g weight (purchased from Changchun Institute of Biological Products Co, Ltd., Beijing, People’s Republic of China), were used in the studies. All animal trial procedures instituted by the Ethical Committee for the Experimental Use of Animals and for Drug Safety Evaluation in Jilin University were followed. The present study and the animal trial have been approved by the ethical committee of Jilin University, Changchun, People’s Republic of China. All 55 mice were housed five to a cage in a 12:12 hours light/dark cycle at ambient temperature of 22°C–25°C. Ten mice were fed with ordinary chow as a normal group, and the other 45 mice were fed with a high-fat diet (composed from 20% sucrose, 10% pork lard, 2.5% cholesterol, 1% sodium cholate, and 66.5% ordinary chow) to induce type 2 diabetes. After 4 weeks, 45 mice were fasted for 8 hours, but had free access to water, and then intraperitoneally injected with STZ (35 mg/kg in 0.1 mol/L citrate-buffered saline, pH 4.4; injection for 1 week, and one time per day) to induce type 2 diabetes. The STZ-induced mice had free access to high-fat food and water. After 2 weeks, the STZ-induced mice showed a fasting blood glucose (FBG) ≥11.1 mmol/L. Their TC in serum significantly increased, but TG did not increased, confirming the successful establishment of the type 2 diabetic model mice. These type 2 diabetic mice were separated into three groups (ten mice per group), including diabetes control group received 0.9% saline [vehicle], honokiol group received 200 mg/kg doses of honokiol (honokiol was dissolved in the dimethyl sulfoxide [DMSO] solvent, and guaranteed the final concentration at 200 mg/kg), metformin group received 200 mg/kg doses of metformin. The normal group received 0.9% saline (vehicle). All the drug stock solutions were diluted in 0.9% saline and administered through oral gavage once per day for 8 weeks.
We must explain that the dose of honokiol used in this was determined by the pre-experiments. Our pre-experiments designed a series of honokiol concentration (10, 50, 100, 150, 200, 250, and 300 mg/kg), and the results showed that the concentration of 200 mg/kg plays the most significant hypoglycemic effects (data not shown). Therefore, in this study, we selected 200 mg/kg as the dose used in this study.
Measurement of fasting blood glucose, body weight, and lipid profile
During the treatment period, the body weight and blood glucose of 8-hours-fasted mice were measured every week. FBG was measured using a OneTouch UltraEasy glucose reader. Blood samples were obtained from the tail vein of mice. Total TG and TC in serum were measured following the instructions recommended in commercial kit’s.
Tissue collection and immunoblotting
At the end of week 8 of treatments, mice were sacrificed by cervical dislocation. The subcutaneous adipose tissue, skeletal muscle, and liver were dissected immediately and frozen in liquid nitrogen and then stored at -80°C. The adipose tissue, skeletal muscle, and liver samples were homogenized in ice-cold lysis buffer (SDS gel sample buffer without bromophenol blue) and then centrifuged (12,000× g, 20 minutes) at 4°C. The supernatant was collected individually, and the protein concentrations were measured using Bradford methods. For immunoblotting, liver, muscle, and adipose tissue supernatant homogenate containing 20 μg proteins was run on SDS-PAGE (8%–10% gel) and transferred electrophoretically onto the PVDF membrane, separately. The PVDF membrane was then blocked for 2 hours at room temperature with tris buffered saline with Tween (TBST) containing 3% BSA. Immunoblots were performed using antibodies against phospho-IRβ (#3021, Cell Signaling Technology, Inc., Danvers, MA, USA), IRβ (#3025, Cell Signaling Technology, Inc.), phospho-AKT (#4058s, Cell Signaling Technology, Inc.), AKT (#9272, Cell Signaling Technology, Inc.), phospho-ERK1/2 (sc-7383, Santa Cruz Biotechnology Inc., Dallas, TX, USA), ERK1/2 (bs-0022R, Beijing Biosynthesis Biotechnology Co., Ltd., Beijing, People’s Republic of China), phosphotyrosine (sc-7020, Santa Cruz Biotechnology Inc.), and actin (TA-09, ZSGB-BIO, Beijing, People’s Republic of China) incubating for 12 hours overnight at 4°C, respectively, followed by horseradish peroxidase-conjugated secondary antibodies for 2 hours at room temperature and visualized using the enhanced chemiluminescence (ECL) method and quantified by densitometry scanning with Quantity One software.
Cell culture and differentiation
C2C12 myoblasts culture and differentiation were performed as our previously published.13 In brief, C2C12 myoblasts were cultured in Dulbecco’s Modified Eagle’s Medium (DMEM), supplemented with 10% fetal bovine serum (FBS) and 1% penicillin/streptomycin (PS) at 37°C in humidified atmosphere with 5% CO2. For differentiation, C2C12 myoblasts were cultured to 75% confluence in DMEM with 10% FBS, 1% PS. Then, the cells were incubated in DMEM supplemented with 2% horse serum and 1% PS for 4–6 days to induce to mature myotubes.
Cell stimulation and immunoblotting
Mature myotube cells were incubated with various concentrations of honokiol (dissolved in DMSO) for 1 hour and then 10 nM insulin (dissolved in sterile water with pH 4.0) for 10 minutes. The stimulations were stopped by ice-cold phosphate-buffered saline (PBS). To collect whole cell extraction, the cells were lysed with ice-cold whole cell extraction buffer (25 mM β-glycerophosphate [pH 7.3], 5 mM ethylenediaminetetraacetic acid, 2 mM ethylene glycol tetraacetic acid, 5 mM β-mercaptoethanol, 1% Triton X-100, 0.1 M NaCl, and a protease inhibitor mixture). The lysates were centrifuged at 12,000× g for 20 minutes at 4°C, and then the supernatants were collected individually. For the plasma membrane fraction, cells were harvested according to membrane protein extraction kit (BestBio, Beijing, People’s Republic of China). Protein concentrations were determined by use of Bradford methods. Immunoblotting was performed as described previously.25 Briefly, the proteins were separated on a 10% SDS polyacrylamide gel and electrotransferred to PVDF membrane followed by immunoblots with antibody against phospho-IRβ, IRβ, phospho-AKT, AKT, phospho-ERK1/2, ERK1/2, GLUT4 (sc-1608, Santa Cruz Biotechnology Inc.), phosphotyrosine, and actin, respectively. Proteins were visualized using the ECL method and visualized on Tanon-5200 Chemiluminescent Imaging System (Tanon Science & Technology Co., Ltd., Shanghai, People’s Republic of China).
Cytotoxicity
Cells were plated on 96-well plates and treated with varying concentrations of honokiol for 24 hours. Then, medium was removed, and fresh medium was added to each well along with 10 mL of MTT solution (5 mg/mL). After 4 hours incubation at 37°C, cells were lysed with 150 mL of DMSO, and the absorbance of purple formazan was read at wavelength of 490 nm using a microplate reader (BioTek, Winooski, VT, USA). Six reduplicate wells were used for each treatment, and experiments were repeated three times.
PTP1B inhibition measurements
The inhibitory potencies of honokiol on the PTP1B activity were performed in reaction buffer, pH 7.0, containing 50 mmol/L 3-morpholinopropanesulfonic acid (MOPS), 100 mmol/L NaCl, 1 mmol/L ethylenediaminetetraacetic acid, 1 mmol/L DL-dithiothreitol (DTT), and 1 mg/mL BSA, on a 96-well plate in 70 μL volumes. Honokiol (10 μL) at various concentrations was mixed with PTP1B solution (10 μL) in the buffer for 5 minutes at 37°C. Then, substrate pNPP (10 μL, 100 mmol/L) was added, incubating for 10 minutes at 37°C. The assays were terminated by adding NaHCO3 (100 μL, 100 mmol/L). The amount of produced p-nitrophenol was measured by UV absorbance at a wavelength of 405 nm with a microplate reader. The half maximal inhibitory concentration (IC50) values were obtained by fitting the concentration-dependent inhibition curves using the GraphPad Prism 5 software (GraphPad Software, Inc., La Jolla, CA, USA), which can evaluate the inhibitory potency of inhibitor. To determine the inhibition type, each concentration of honokiol (0, 0.25, 0.5, 1, and 2 mmol/L) is incubated with PTP1B in reaction buffer for 5 minutes, and the reactions were initiated by adding different concentrations of pNPP. The inhibition type is determined according to the Lineweaver–Burk plot, 1/v versus 1/[S]. The inhibitor constant (Ki) was calculated according to the plot, slope versus [I]. In detection of the selectivity of honokiol against PTPs, the reaction systems apply to all PTPs including PTP1B. All data points were carried out in triplicate.
Molecular docking and dynamic simulation
Honokiol (ZINCnum: 1536) was docked into the active site of PTP1B (PDBnum: 2VEV) using Autodock 4.0.26 Then, we performed a 100 ns molecular dynamics simulation for the complex PTP1B-hon using the Groningen machine for chemical simulation package (version 4.5.5) with ffG43a2 force field and spc216 water model.27–29 The temperatures were kept constant at T=300 K by coupling to a Berendsen thermostat with a coupling time of 0.1 ps.30 The nonbonded interactions were evaluated using a twin range of cutoff from 8 to 14 Å. To correct the electrostatic interactions, the interactions beyond a cutoff of 14 Å were neglected. The bond distances and bond angles of water were constrained using the SETTLE algorithm.31 Bond lengths within the protein were constrained with the LINCS algorithm.32
Statistical analysis
Data were presented as mean ± SD. Statistical analysis was conducted using Student’s t-test or one-way ANOVA with GraphPad Prism 5 software. A probability value of P<0.05 was considered statistically significant.
Results
Honokiol decreases blood glucose levels and ameliorates body weight disorder in T2DM mice
At the beginning of the study, we established the T2DM mouse model by high-fat feeding assisted by low dose STZ inducing. The FBG of mice reached ≥11.1 mmol/L, the fasting body weight and the TC were significantly higher after T2DM inducement than those before inducement, whereas the TG did not increased (Figure 2A). These results confirmed the successful establishment of the T2DM model.
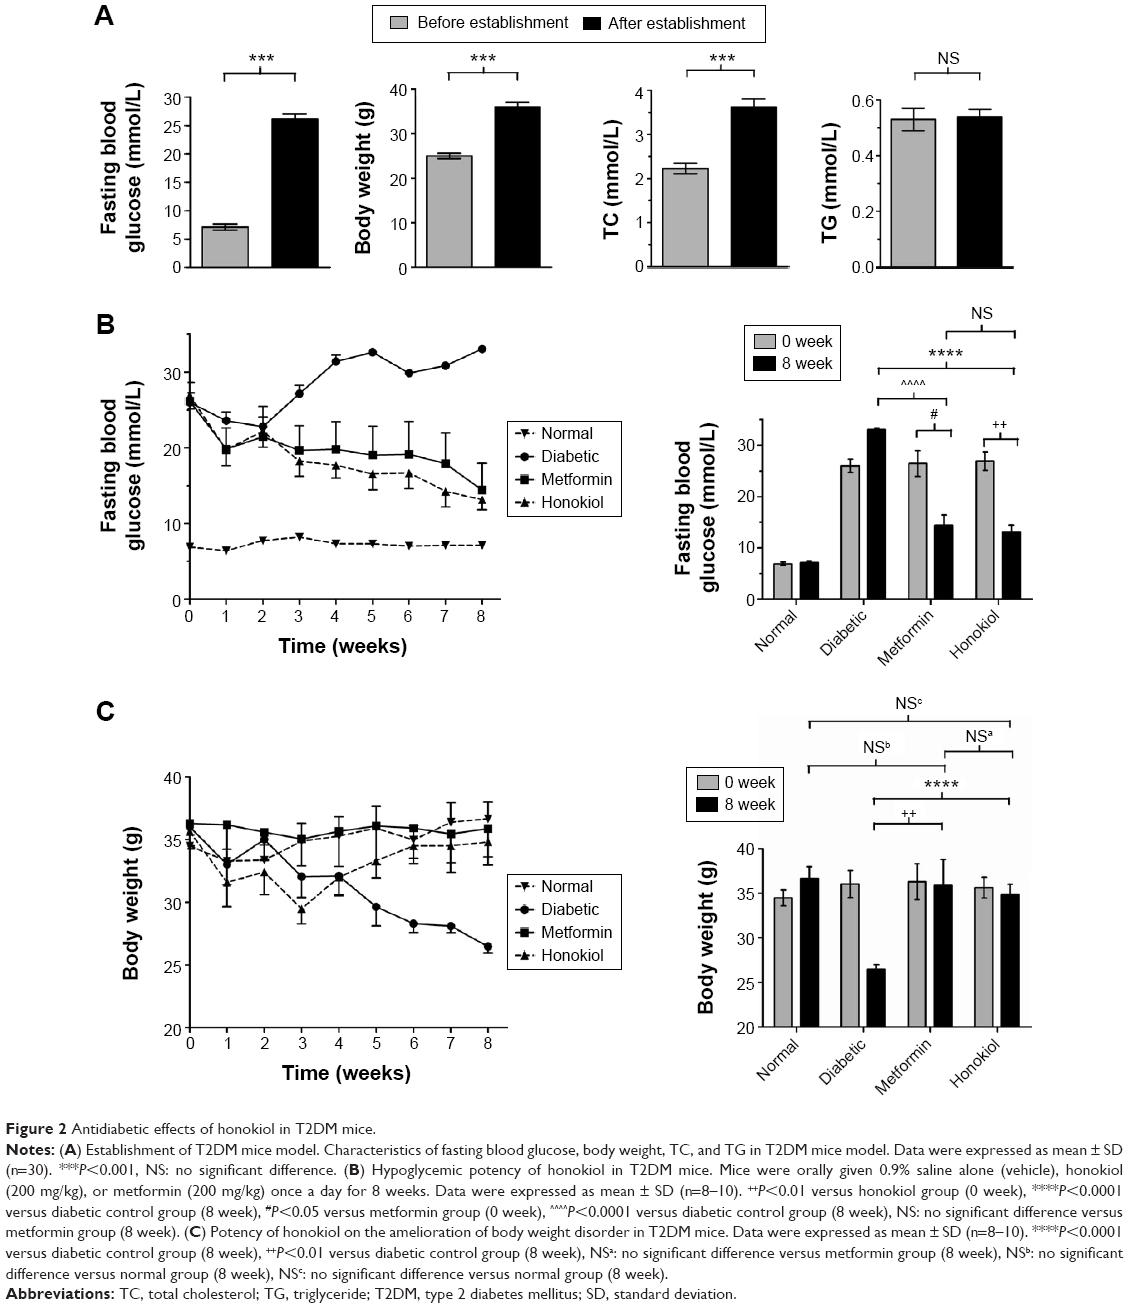 | Figure 2 Antidiabetic effects of honokiol in T2DM mice. |
We administered honokiol (200 mg/kg), metformin (200 mg/kg), or vehicle for 8 weeks to these mice. The FBG in diabetic control mice gradually increased and was significantly higher than that in the normal mice (Figure 2B). Daily treatments of both honokiol and metformin decreased the blood glucose levels gradually in diabetic mice (Figure 2B). At the end of the 8 weeks treatment, the blood glucose level in honokiol-treated mice was significantly decreased, compared with diabetic control mice and metformin-treated mice without any statistically significant difference (Figure 2B). These results outlined honokiol as an efficient hypoglycemic reagent, although further in vivo experiments, particularly with various dosages, are required to better estimate its therapeutic potential.
The body weight rapidly decreased in diabetic control mice, whereas decreased at early treatment and then gradually increased in honokiol-treated mice (Figure 2C). The metformin-treated mice and normal mice showed a stable body weight (Figure 2C). The body weight in honokiol-treated mice exhibited no statistically difference at the end of treatment, compared with normal mice and metformin-treated mice (Figure 2C). These results suggest that honokiol can ameliorate body weight disorder in T2DM mice.
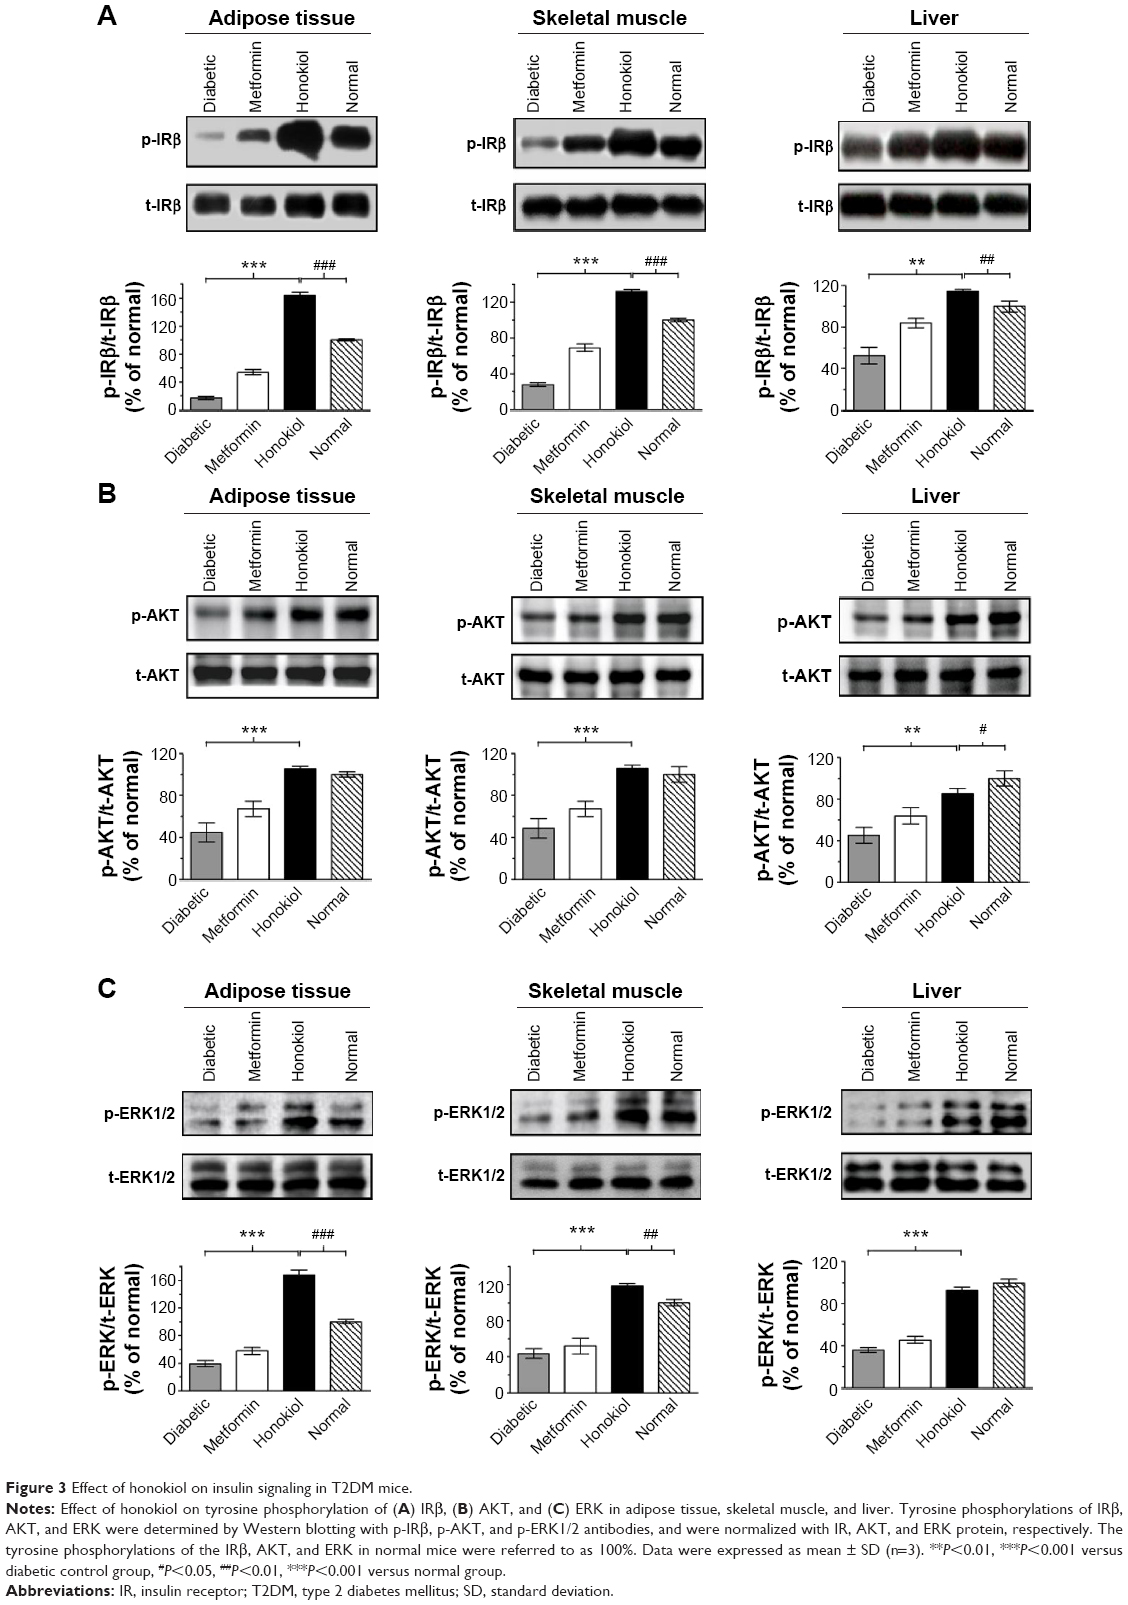
Characteristics of the lipid profile in the serum
The TC in serum was significantly higher in diabetic control mice, compared with that in normal mice, whereas the TG in serum remained normal (Table 1). There was no significant difference in the TG and TC during honokiol or metformin treatment (Table 1). These results indicate that honokiol does not affect TC and TG in T2DM diabetic mice.
 | Table 1 Characteristics of the lipid profile in the serum |
Honokiol enhances insulin signaling in T2DM mice
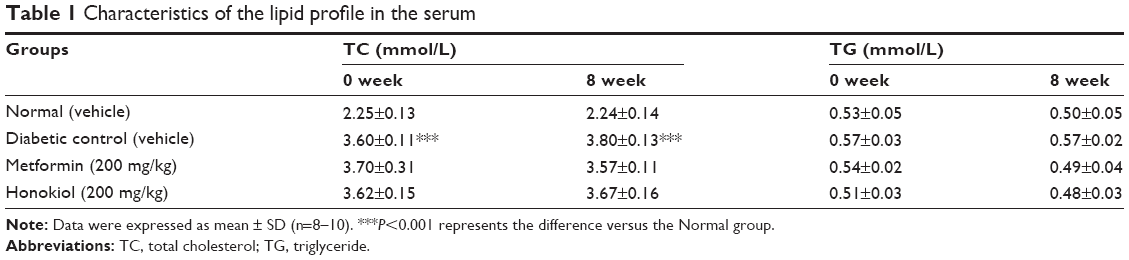
To address how honokiol takes its effect on the amelioration of hyperglycemia in T2DM mice, we investigated insulin signaling pathways in target tissues of insulin. Given that the phosphorylation of IRβ is critical to trigger insulin signaling pathways, we first tested whether honokiol enhances phosphorylation of the IRβ in vivo. Here, we find that the tyrosine phosphorylations in the adipose tissue, skeletal muscle, and liver of the 200 mg/kg honokiol-treated mice were significantly higher than that of diabetic control mice, even higher than that of normal mice, while without altering the total protein levels of IR (Figure 3A).
 | Figure 3 Effect of honokiol on insulin signaling in T2DM mice. |
Considering the fact that honokiol enhanced the tyrosine phosphorylation of the IRβ in vivo, we next investigated the possible effect of honokiol on the relevant downstream signaling. Insulin signaling diverge mainly to the MAPK cascade, leading to the activation of gene expression and growth regulation, and the PI3K–AKT pathway, which diverges further to the regulation of several different metabolic activities such as glucose metabolism (GLUT4 translocation and glucose uptake), as well as to the regulation of gene expression and survival.33 Consistent with the results of p-IRβ above, honokiol enhanced the tyrosine phosphorylation of ERK and the serine phosphorylation of AKT in the adipose tissue, skeletal muscle, and liver of T2DM mice, without altering the total protein levels of ERK and AKT (Figure 3B). Therefore, honokiol activated the proximal insulin signal and subsequently enhanced downstream transduction events in T2DM mice. The effect of honokiol on the PI3K–AKT metabolic pathway is more relevant to the hypoglycemic of honokiol. However, the effects of honokiol on MAPK cascade remained be further clarified in future studies.
Honokiol enhances insulin signaling in C2C12 myotubes
Based on the finding that honokiol lowered blood glucose levels via enhancing insulin signaling in T2DM mice, we next explored whether honokiol took its effects on insulin pathway in C2C12 myotubes. The cytotoxicity of honokiol was tested using MTT assay, and the results presented that honokiol without cytotoxic at the maximum of concentrations was 40 μM (Figure 1B). Therefore, we determined the concentration range from 0 to 30 μM. In the assay, we first confirmed the effects of honokiol on insulin sensitivity in C2C12 myotubes. Here, we find that, in the insulin-treated C2C12 myotube cells, honokiol largely enhanced the insulin-stimulated tyrosine phosphorylation of IRβ in a dose-dependent manner, without altering the total protein levels of IR (Figure 4A). The enhancement of the insulin-stimulated tyrosine phosphorylation of IRβ by honokiol has revealed its potent activity in insulin-sensitivity improvement. Given that, we next probe the effects of this compound on the downstream insulin pathway. As expected, honokiol enhances the serine phosphorylation of AKT- (Figure 4B) and insulin-stimulated tyrosine phosphorylation of ERK (Figure 4C) in a dose-dependent manner, without altering the total protein levels of IR and AKT. These results are consistent with our findings in T2DM mice.
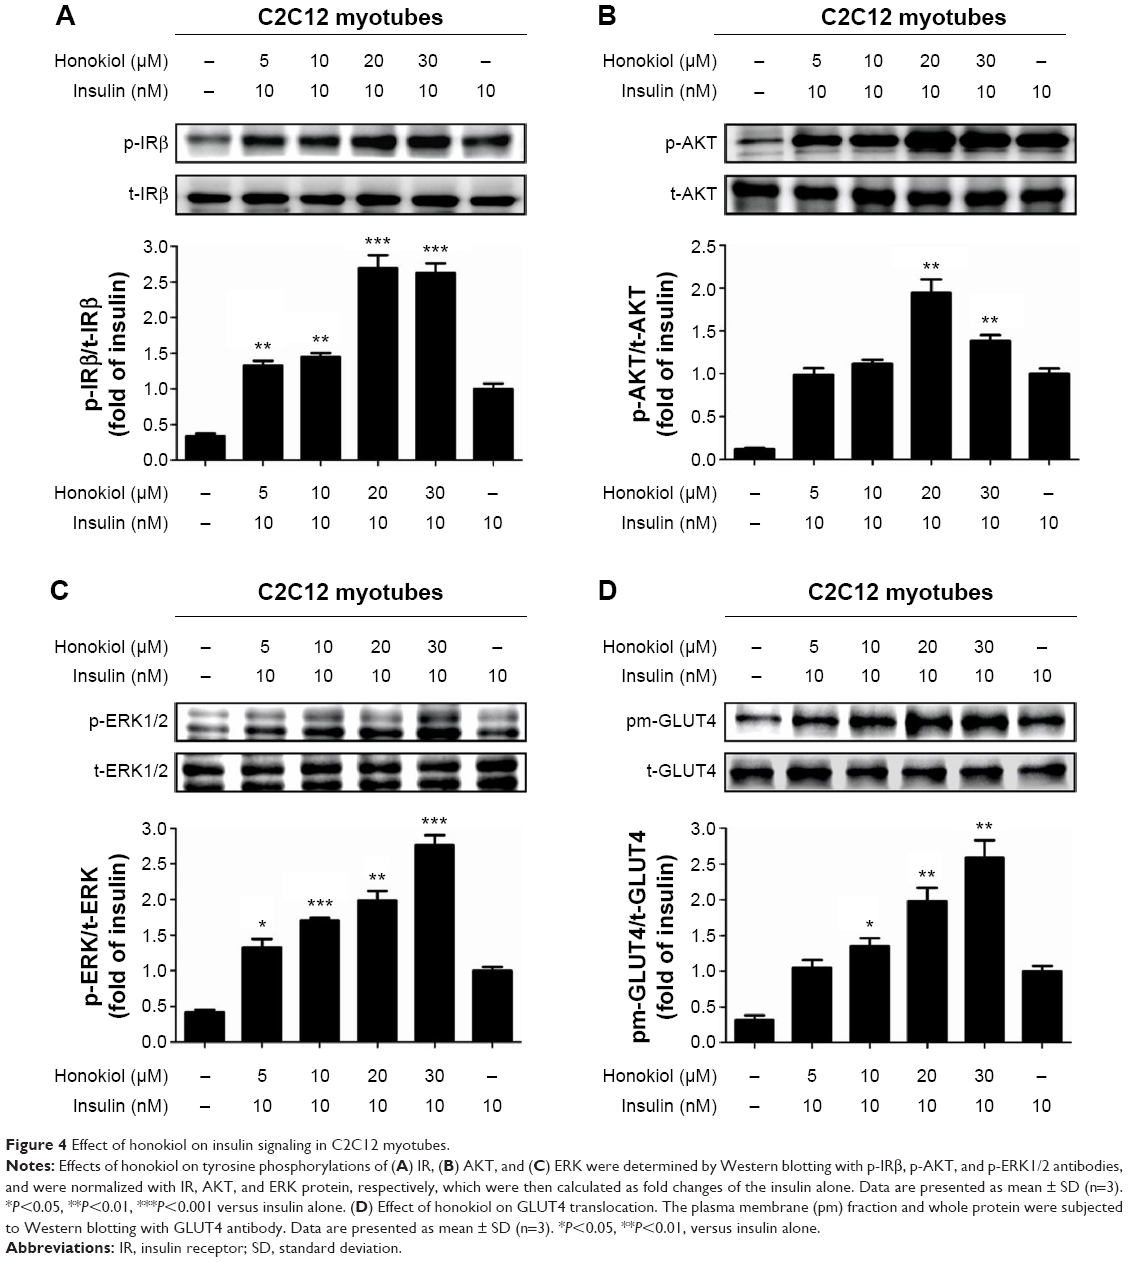 | Figure 4 Effect of honokiol on insulin signaling in C2C12 myotubes. |
As reported, GLUT4 is primarily expressed in muscle and adipose tissues.34 In response to insulin, GLUT4 translocation from cytoplasm to cell membrane facilitates glucose transport, thereby regulating glucose homeostasis. In downstream insulin pathway, AKT is critical for GLUT4 translocation. Given that honokiol can enhance insulin-stimulated IR and AKT phosphorylation, we next examined whether honokiol affect translocation of GLUT4 to the plasma membrane. As indicated, honokiol dose-dependently increased the insulin-induced GLUT4 level in the plasma membrane fraction, whereas the GLUT4 level in whole cell lysates was not altered (Figure 4D). Therefore, combining the previous results both in T2DM mice and C2C12 myotubes that honokiol enhances insulin signaling, it is thus suggested that the hypoglycemic effect of honokiol is through its potent activity in insulin-sensitivity improvement.
Honokiol exhibited potent PTP1B inhibitory activity
Given that honokiol can enhance insulin-stimulated phosphorylations of IRβ, ERK, and AKT and promote GLUT4 translocation, it is thus proposed that honokiol possibly targets the upstream of ERK and AKT, which can also modulate IRβ phosphorylation. We knew that some PTPs family members such as PTP1B can directly dephosphorylate IRβ.35 Moreover, considerable interest grows in the potential of PTP1B as a therapeutic target for treating diabetes and obesity following the elucidation of its importance as a regulator of insulin and leptin signaling pathways.36 Therefore, PTP1B could be one of the first candidates for honokiol acting target. In our pre-experiments, PTP1B gene knockout mice (PTP1B−/−) were established, and the results indicated that the treatment of honokiol cannot affect the blood glucose and weight of the mice (Figure S2). To further confirm our hypothesis, the inhibitory activity on PTP1B and the selectivity against PTPs of honokiol have been detected. According to the concentration-dependent inhibitory curve, the IC50 value of honokiol was calculated to be 63.43±1.07 μmol/L (Figure 5A). To assay the selectivity of honokiol against PTPs, the inhibitory potencies on a panel of PTPs were investigated, including PTP1B, SHP1, SHP2, TCPTP, and HePTP. The results were listed in Table 2. Honokiol exhibited modest inhibitory activity against SHP1, SHP2, TCPTP, and HePTP, which was much weaker compared with that against PTP1B (Table 2). Thus, honokiol exhibited potent PTP1B inhibitory activity and good selectivity on PTP1B over other PTPs family members. In order to determine the inhibition type of honokiol on PTP1B, Lineweaver–Burk analysis was investigated. The Lineweaver–Burk plot gave us a common intercept of five lines on the 1/v axis as honokiol concentration increases from 0 to 200 μmol/L, indicating that honokiol inhibits PTP1B by competing with the substrate for the enzyme active site (Figure 5B). Ki was the inhibitor constant of honokiol on PTP1B, and Ki was determined by the intercept on the x-axis, so the Ki was calculated to be 6.67 μmol/L (Figure 5C).
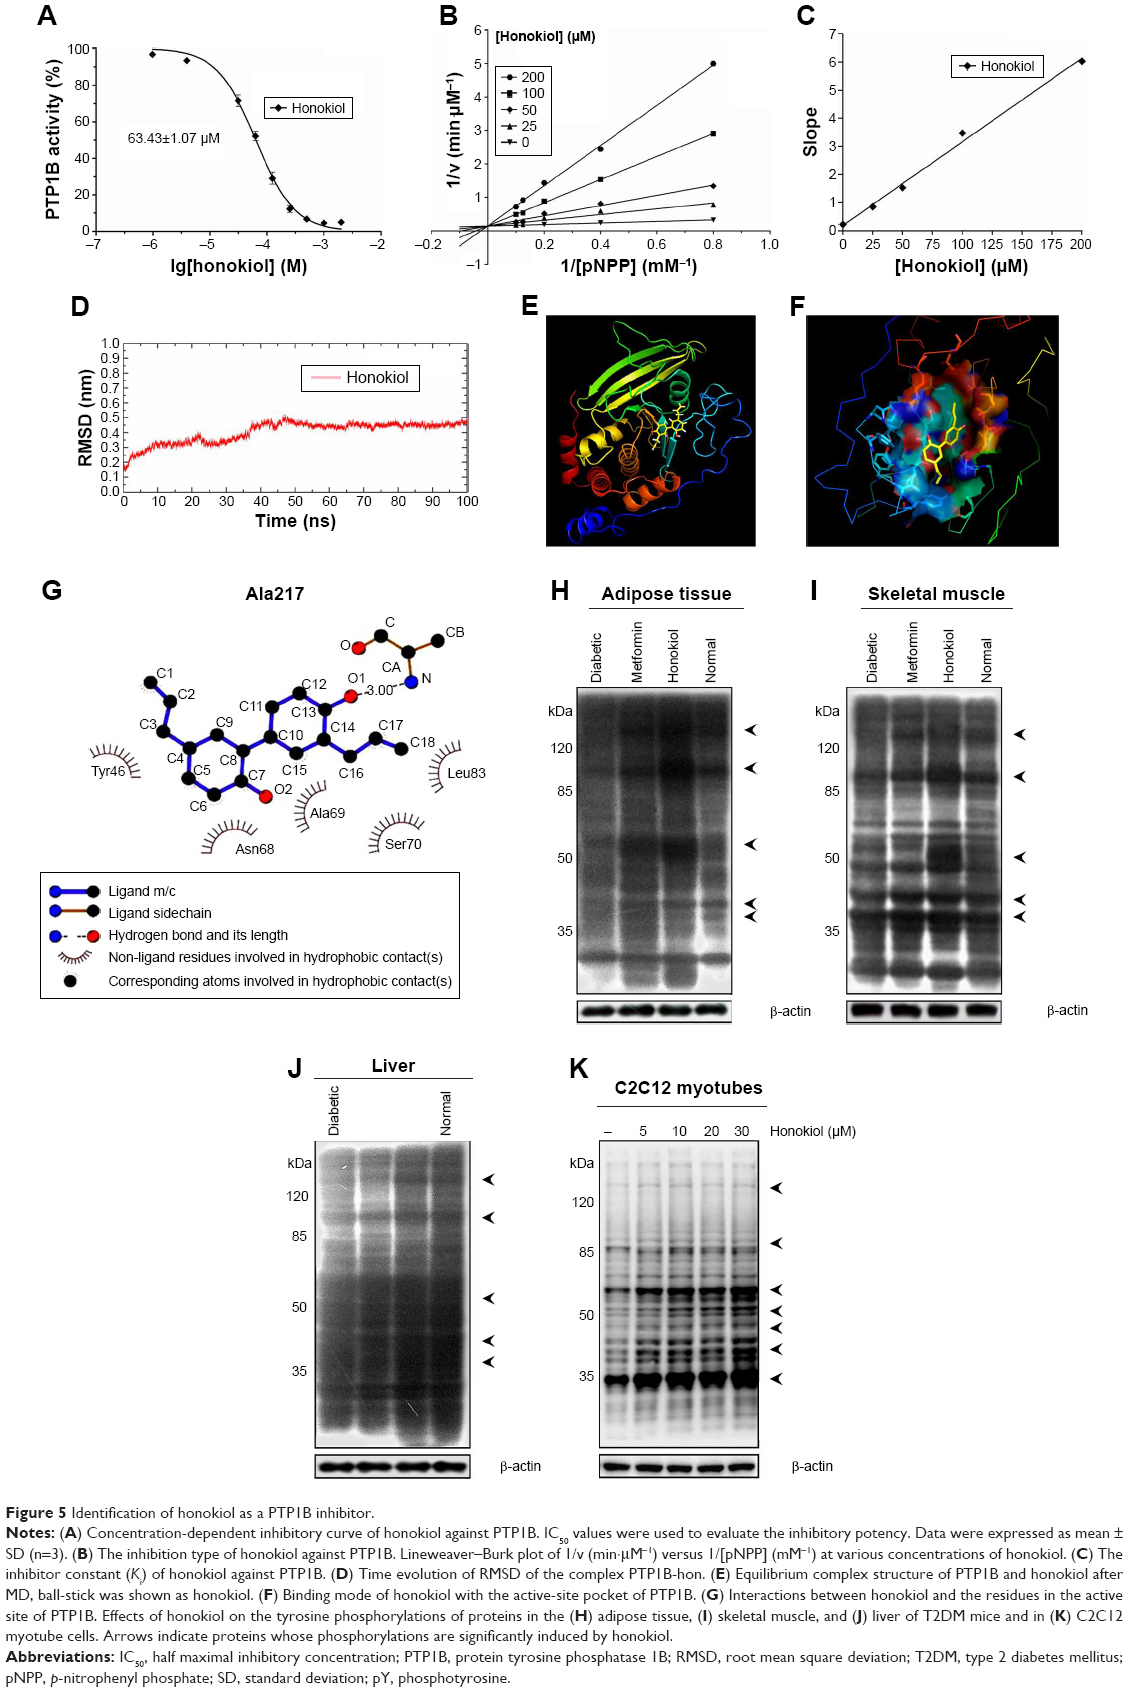 | Figure 5 Identification of honokiol as a PTP1B inhibitor. |
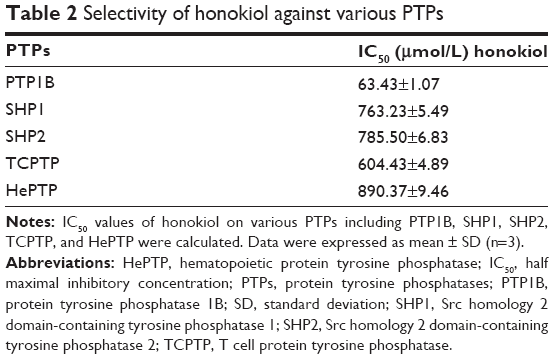 | Table 2 Selectivity of honokiol against various PTPs |
Furthermore, we have also investigated the negative and positive control in the PTP1B activity. In this study, we employed the well-known PTP1B inhibitor, Na3VO4, as the positive control, and selected PBS as the negative control. The results indicated that the honokiol could inhibit the PTP1B activity as effective as the Na3VO4 (Figure S3). Therefore, we also thought that the honokiol acts as the specific inhibitor for PTP1B.
In order to investigate further the binding mode of honokiol with the PTP1B active site on an atomic level, molecular docking, and dynamic simulation were performed. The root mean square deviation (RMSD) value for complex system of PTP1B with honokiol versus the simulation time is illustrated in Figure 5D, in which the system met stable state after 50 ns. Moreover, during the entire MD simulation process of 100 ns, the PTP1B-hon complex system remained stable and drastic change did not occurred, compared with the initial conformation, which indicates that honokiol binds to PTP1B and forms stable complex. The binding mode of honokiol to PTP1B on an atomic level was predicted and analyzed from the equilibrium complex structure of PTP1B-hon after MD (Figure 5E). Honokiol completely occupied and blocked the PTP1B active-site pocket (Figure 5F). Honokiol underwent a hydrogen bond interaction with the main chain of Ala217 of P-loop and formed extensive hydrophobic interactions with Tyr46 of Tyr-loop, Asn68, Ala69, Ser70, and Leu83 in PTP1B catalytic site (Figure 5G). All these observations have supported that honokiol functions as a PTP1B inhibitor, in consistent with the pertinent cell- and tissue-based assays.
Considering that honokiol exhibited potent PTP1B inhibitory activity and its binding mode with PTP1B in vitro, we then test whether honokiol is also able to inhibit PTP1B in vivo and in cell. We acknowledged that by inhibiting PTP1B activities, honokiol presumably increases the protein tyrosine phosphorylation. However, due to the limitation of the direct method used in detecting PTP1B enzyme activity in vivo and in cell, to elucidate if this is indeed the case, we detected the tyrosine phosphorylation of total proteins in the tissues (adipose, skeletal muscle, and liver) of trailed mice and in C2C12 myotubes. Identities of these proteins are to be determined. As shown in Figure 5H–J, the tyrosine phosphorylation of the diabetic mice treated with 200 mg/kg honokiol was significantly higher than that of the diabetic control mice in skeletal muscle and adipose tissue as well as in liver. To confirm these results, we further performed the similar experiment in C2C12 myotubes. As expected, honokiol also enhanced tyrosine phosphorylations of some cellular proteins in C2C12 myotubes (Figure 5K). Based on the finding that honokiol exhibited efficiently selectivity on PTP1B over other PTPs family member, the inhibition of PTP1B by honokiol is at least partly responsible for the increased tyrosine phosphorylation. These findings thus suggested that honokiol also exhibited potent PTP1B inhibitory activity in vivo. Therefore, combining all these observations, it is suggested that the honokiol enhanced insulin signaling in T2DM mice and C2C12 myotubes is through its inhibitory activity against PTP1B.
Discussion
T2DM is characterized by increased levels of blood glucose due to impaired insulin sensitivity (insulin resistance).2,3,37–39 Identifying new insulin sensitizer agents is of high importance in view of the global epidemic of diabetes. This study revealed several essential findings relevant to the hypoglycemic effect of honokiol and proposed a new underlying mechanism, independent of previous studies. It was obvious that treatment through oral gavage with 200 mg/kg/day honokiol resulted in a profound attenuation in hyperglycemia (Figure 2). In particular, this hypoglycemic potency is comparable to that of metformin (clinical drug), even more effective than metformin. The antihyperglycemic effect of metformin was due to the suppression of lipid oxidation and hepatic glucose production,40–44 which was clearly different from honokiol as we proved. Atanasov et al18 showed that honokiol functions as a partial nonadipogenic PPAR-γ agonist in vitro and prevents hyperglycemia and weight gain in diabetic KKAy mice, but did not provide us direct evidences in vivo to clarify its certain hypoglycemic mechanism. However, our findings in this study were the first time, to the best of our knowledge, to demonstrate honokiol inhibits PTP1B in vitro and in vivo, resulting in the enhanced insulin signaling and amelioration of hyperglycemia in high-fat diet- and STZ-induced T2DM mice. Our findings are not contrary to previous studies, apart from being a PPAR-γ agonist in vitro, but the fact that honokiol functions as an inhibitor may also be contributed to its insulin-sensitizing and hypoglycemic effects. Moreover, by molecular docking and dynamic simulation, we have found the binding mode of honokiol with the PTP1B active site. The chemical structure of honokiol determines its dual action as PTP1B inhibitor and PPAR-γ agonist. At the current stage, however, it could not be excluded that other postulates contribute to the beneficial effects of honokiol in vivo. Notably, our efforts provide a novel direction for reference in future research. Besides, in our experiment, honokiol displayed no macroscopic toxicity in brain, heart, kidneys, liver, spleen, stomach, large and small intestine, and lungs, and is well tolerated with a high safety of median lethal dose.13 Thus, our study highlights that honokiol is promising as a valuable insulin sensitizer for therapy of type 2 diabetes.
Normally, insulin evokes a cascade of phosphorylation events, starting with the autophosphorylation of IR leading to recruitment of IRS-1, followed by activation of PI3K, AKT, and finally GLUT4 translocation to improve the glucose uptake.4–6 Interestingly, we observed that honokiol enhanced the tyrosine phosphorylations of the IRβ and this dynamic cascade effect of phosphorylation was transduced downstream to yield sustained augmentations in AKT and ERK1/2 phosphorylation in T2DM mice. We know that PI3K–AKT pathway diverges further to the regulation of several different metabolic activities such as glucose metabolism (GLUT4 translocation and glucose uptake).33 Thus, the enhanced AKT phosphorylation by honokiol is more relevant to its hypoglycemic effects in T2DM mice. Moreover, we confirmed these findings also in C2C12 myotube cells. As expected, honokiol enhanced the insulin-stimulated tyrosine phosphorylations of IRβ and ERK1/2 and the serine phosphorylation of AKT in a dose-dependent manner. Honokiol dose-dependently increased the insulin-induced GLUT4 translocation from cytoplasm to cell membrane. Taken together, these potentiating effects of honokiol that enhance the proximal insulin signal transduction events and subsequently activate the downstream signaling pathway may provide us one reasonable explanation for its effective hypoglycemic effect. Our findings are consistent with findings from Alonso-Castroa et al20 that honokiol-stimulated glucose uptake in insulin-sensitive and insulin-resistant murine and human adipocytes, and Choi et al19 that honokiol-stimulated glucose uptake by activating PI3K-dependent AKT in L6 myotubes, but not other studies of animal in vivo.
PTP1B recognizes the activated IR as a substrate, and then dephosphorylates the tyrosine residues of IR.38 In addition, PTP1B also dephosphorylates the tyrosine residues of IRS-1.7 Consequently, PTP1B is involved in terminating insulin signaling. Consistent with this hypothesis, Ahmad et al39 demonstrated that increased PTP1B levels or an increased activity of this enzyme were found in insulin-resistant and obese patients. PTP1B has been proved to be a validated target against diabetes and obesity,40 and antisense oligonucleotides of PTP1B has already entered Phase II clinical trials.41 Considering PTP1B as an important target for antidiabetes, exploring for novel, potent, and selective inhibitors is indeed overwhelming. Unfortunately, these efforts on developing small molecule inhibitors are full of challenges, partially, because the majority of them fail to succeed in vivo. Most of the small molecule competitive inhibitors are capable of mimicking the phosphorylated tyrosine of substrate such as IR, IRS-1, etc, whereas most of the noncompetitive inhibitors act via oxidation of the catalytic Cys215 or by preventing the closure of the WPD loop.42 Thus, PTP1B could be one of the first candidates for honokiol acting target to function its improvement in insulin sensitivity. As indicated, our findings that honokiol competitively inhibited PTP1B activity in vitro by directly blocking the PTP1B active-site pocket as a nonhydrolyzable pTyr mimetic forcefully supported our hypothesis.
Since PTPs share highly structural conservation, selectivity of small molecule inhibitors of PTP1B also faces enormous challenges. Especially, TCPTP displays ~75% sequence identity to PTP1B in its core catalytic domain, rising to ~85% in conservative substitutions.36 TCPTP is essential for normal hematopoiesis and TCPTP-null mice die as a result of hematopoietic defects within weeks of birth.43 However, most potent active site-directed inhibitors of PTP1B show also some degree of inhibition of TCPTP.11 Interestingly, honokiol exhibited approximately ninefold stronger selectivity on PTP1B than TCPTP. Besides, honokiol also showed good selectivity on PTP1B over other PTPs family members including SHP1 (~12-fold), SHP2 (~12-fold), and HePTP (~14-fold). The good selectivity of honokiol may be contributed to its high safety in vivo.
Given that the limitation of direct method of detecting PTP1B enzyme activity in vivo and in cells, we fail to obtain the valid data that the inhibitory efficiency of honokiol against PTP1B in vivo. To verify the previous hypothesis in vivo and in cells, the tyrosine phosphorylation of proteins was investigated. It is acknowledged that the declines in activity of specific PTPs presumably result in increase in tyrosine phosphorylation of some proteins. The present data demonstrated that honokiol enhanced tyrosine phosphorylation of proteins in insulin-target tissues and in C2C12 myotube cells (Figure 5). It is plausible that honokiol targets on one or more PTPs. Taking into account that honokiol displayed good selectivity on PTP1B over other PTPs family members, these evidences further support the above hypothesis that honokiol targets on PTP1B in vivo.
IR is constituted by a β-α-α-β heterotetrameric structure that linked by disulfide bonds. The α-subunit is entirely extracellular and contains the insulin binding site. The β-subunit is a transmembrane protein and contains the tyrosine kinase domain on its intracellular segment.38 In insulin signaling pathway, tyrosine phosphorylation of the IRβ is reversible, and the dephosphorylation takes place rapidly in intact cells even with the continued presence of insulin.44 Binding of insulin to IRα triggers tyrosine autophosphorylation of IRβ, which leads to activation of its tyrosine kinase activity. The activated IR then phosphorylates PTP1B on tyrosine residues, which results in activation of PTP1B phosphatase activity. The activated PTP1B removes IR phosphotyrosines in turn and autodephosphorylates itself, thereby inactivating IR kinase activity.38 Our study found that honokiol caused profound augmentation of IRβ tyrosine phosphorylation in vivo, whereas basal protein level of IR was unchanged. This effect indicates that honokiol does not function as an inducer to multiply the basal quantity of IR, rather it functions as an insulin sensitizer. Indeed, these findings also provide direct evidence to support the hypothesis that honokiol targets on PTP1B in vivo. In addition, the fact that honokiol efficiently ameliorated hyperglycemia reflects that honokiol maintains oral bioavailability in vivo.
For type 2 diabetic patients, hyperglycemia is often accompanied with dyslipidemia, which represents abnormal serum lipid profiles such as TG, TC, low density lipoprotein-cholesterol, and high density lipoprotein-cholesterol. Abnormal values of these indices result in a series of metabolic disorders and complications. This study indicated that the effect of honokiol on serum TC and TG for trialed mice was not statistically significant. However, we found that honokiol possess alleviation potency on body weight disorder, implying that there must be multi-target mechanisms remaining to be determined.
Although we have proved the hyperglycemic effects of honokiol on the type 2 diabetes by targeting the PTP1B, there are also some limitations for this study. First, there are many other pathways affecting the type 2 diabetes except for the inhibition of PTP1B. Therefore, in further studies, we would investigate the honokiol’s effects on the type 2 diabetes by exploring the other pathways. Second, there may be several other substrates of PTP1B in the cells, which may have some adverse effects on complete or partial inhibition of PTP1B. Therefore, if applying the honokiol to clinical therapy, the side effects of honokiol must be investigated in future studies.
Conclusion
The results of this study demonstrate that honokiol efficiently ameliorates hyperglycemia in T2DM mice and support one potential mechanism that honokiol activated the proximal insulin signal, improving insulin sensitivity, and subsequently enhanced downstream transduction events by targeting PTP1B. Thus, our study has highlighted the potential that honokiol serves as a promising insulin sensitizer for further treatment of T2DM.
Acknowledgment
This work was supported by a grant obtained from China Postdoctoral Science Foundation (grant number 2012T50290).
Disclosure
The authors report no conflicts of interest in this work.
References
International Diabetes Federation. IDF Diabetes Atlas. 6th ed. Available from: http://www.idf.org/diabetesatlas. Accessed June 24, 2013. | ||
World Health Organization. 10 facts about diabetes. Available from: http://www.who.int/features/factfiles/diabetes/en/. Accessed November, 2014. | ||
Goldstein BJ. Protein-tyrosine phosphatases: emerging targets for therapeutic intervention in type 2 diabetes and related states of insulin resistance. J Clin Endocrinol Metal. 2002;87:2474–2480. | ||
White MF, Kahn CR. The insulin signaling system. J Biol Chem. 1994;269:1–4. | ||
Hubbard SR, Wei L, Ellis L, Hendrickson WA. Crystal structure of the tyrosine kinase domain of the human insulin receptor. Nature. 1994;372:746–754. | ||
Bryant NJ, Govers R, James DE. Regulated transport of the glucose transporter GLUT4. Nat Rev Mol Cell Biol. 2002;3:267–277. | ||
Goldstein BJ, Bittner-Kowalczyk A, White MF, Harbeck M. Tyrosine dephosphorylation and deactivation of insulin receptor substrate-1 by protein-tyrosine phosphatase 1B. Possible facilitation by the formation of a ternary complex with the Grb2 adaptor protein. J Biol Chem. 2000;275:4283–4289. | ||
Kenner KA, Anyanwu E, Olefsky JM, Kusari J. Proteintyrosine phosphatase 1B is a negative regulator of insulinand insulin-like growth factor-I-stimulated signaling. J Biol Chem. 1996;271;19810–19816. | ||
Elchebly M, Payette P, Michaliszyn E, et al. Increased insulin sensitivity and obesity resistance in mice lacking the protein tyrosine phosphatase-1B gene. Science. 1999;283:1544–1548. | ||
Klaman LD, Boss O, Peroni OD, et al. Increased energy expenditure, decreased adiposity, and tissue-specific insulin sensitivity in protein-tyrosine phosphatase 1B-deficient mice. Mol Cell Biol. 2000;20:5479–5489. | ||
Johnson TO, Ermolieff J, Jirouesk MR. Protein tyrosine phosphatase 1B inhibitors for diabetes. Nat Rev Drug Discov. 2002;1:696–709. | ||
Jiří P, Jiří J, Anna S. Expectations of biologically active compounds of the genus Magnoliain biomedicine. J Appl Biomed. 2006;4:171–178. | ||
Sun J, Wang Y, Fu X, et al. Magnolia officinalis extract contains potent inhibitors against PTP1B and attenuates hyperglycemia in db/db mice. Biomed Res Int. 2015;2015:139451. | ||
Yin HQ, Kim CY, Chung YS, Kim YC, Shin YK, Lee BH. Honokiol reverses alcoholic fatty liver by inhibiting the maturation of sterol regulatory element binding protein-1c and the expression of its downstream lipogenesis genes. Toxicol Appl Pharmacol. 2009;236:124–130. | ||
Lin YR, Chen HH, Ko CH, Chan MH. Effects of honokiol and magnolol on acute and inflammatory pain models in mice. Life Sci. 2007;81:1071–1078. | ||
Park J, Lee J, Jung E, et al. In vitro antibacterial and anti-inflammatory effects of honokiol and magnolol against Propionibacterium sp. Eur J Pharmacol. 2004;496:189–195. | ||
Hu H, Zhang XX, Wang YY, Chen SZ. Honokiol inhibits arterial thrombosis through endothelial cell protection and stimulation of prostacyclin. Acta Pharmacol Sin. 2005;26:1063–1068. | ||
Atanasov AG, Wang JN, Gu SP, et al. A non-adipogenic PPARγ agonist from nature. Biochim Biophys Acta. 2013;1830:4813–4819. | ||
Choi SS, Cha BY, Lee YS, et al. Honokiol and magnolol stimulate glucose uptake by activating PI3K dependent Akt in L6 myotubes. Biofactors. 2012;38:372–377. | ||
Alonso-Castroa AJ, Zapata-Bustosa R, Domínguezc F, García-Carrancá A, Salazar-Olivoa LA. Magnolia dealbata Zucc and its active principles honokiol and magnolol stimulate glucose uptake in murine and human adipocytes using the insulin-signaling pathway. Phytomedicine. 2011;18:926–933. | ||
Li Y, Lu LP, Zhu M, et al. Potent inhibition of protein tyrosine phosphatases by copper complexes with multi-benzimidazole derivatives. Biometals. 2011;24:993–1004. | ||
Shi D, Dong H, Zhu Z, et al. Expression of catalytic domain of protein tyrosine phosphatase 1B and preparation of its polyclonal antibody. Chem Res Chin Univ. 2007;33:204–207. | ||
Zhao Z, Bouchard P, Diltz CD, Shen SH, Fischer EH. Purification and characterization of a protein tyrosine phosphatase containing SH2 domains. J Biol Chem. 1993;268:2816–2820. | ||
Zhu Z, Sun M, Zhang X. Expression and characterization of catalytic domain of T cell protein tyrosine phosphatase (Delta TC-PTP) – immunohistochemical study of Delta TC-PTP expression in non-small cell lung carcinomas. Chem Res Chin Univ. 2007;23:289–296. | ||
Guo Y, Fu X, Jin Y, et al. Histone demethylase LSD1-mediated repression of GATA-2 is critical for erythroid differentiation. Drug Des Dev Ther. 2015;9:3153–3162. | ||
Seo MS, Kim JH, Kim HJ, Chang KC, Park SW. Honoliol activates the LKB1-AMPK signaling pathway and attenuates the lipid accumulation in hepatocytes. Toxicol Appl Pharmacol. 2015;284:113–124. | ||
Lindahl E, Hess B, Spoel DV. GROMACS 3.0: a package for molecular simulation and trajectory analysis. J Mol Mod. 2001;7:306–317. | ||
Berendsen HJC, Postma JPM, van Gunsteren WF, Hermans J. In: Pullman, B, editor. Intermolecular Forces. Reidel: Dordrecht, 1981;331–342. | ||
Agragones JL, Noya EG, Valeriani C, Vega C. Free energy calculations for molecular solids using GROMACS. J Chem Phys. 2013;139:034104. | ||
Berendsen HJC, Postma JPM, van Gunsteren WF, DiNola A, Haak JR. Molecular dynamics with coupling to an external bath. J Chem Phys. 1984;81:3684–3690. | ||
Miyamoto S, Kollman PA. SETTLE: an analytical version of the SHAKE and RATTLE algorithm for rigid water models. J Comput Chem. 1992;13:952–962. | ||
Hess B, Bekker H, Berendsen HJC, Fraaije JGEM. LINCS: a linear constraint solver for molecular simulations. J Comput Chem. 1997;18:1463–1472. | ||
Taniguchi CM, Emanuelli B, Kahn CR. Critical nodes in signalling pathways: insights into insulin action. Nat Rev Mol Cell Biol. 2006;7:85–96. | ||
Olson AL, Pessin JE. Structure, function, and regulation of the mammalian facilitative glucose transporter gene family. Annu Rev Nutr. 1996;16:235–256. | ||
Stoker AW. Protein tyrosine phosphatases and signalling. J Endocrinol. 2005;185:19–33. | ||
Haque A, Andersen JN, Salmeen A. Conformation-sensing antibodies stabilize the oxidized form of PTP1B and inhibit its phosphatase activity. Cell. 2011;147:185–198. | ||
Hundal RS, Krssak M, Dufour S, et al. Mechanism by which metformin reduces glucose production in type 2 diabetes. Diabetes. 2000;49:2063–2069. | ||
Byon JCH, Kusari1 AB, Kusari J. Protein-tyrosine phosphatase-1B acts as a negative regulator of insulin signal transduction. Mol Cell Biochem. 1998;182:101–108. | ||
Ahmad F, Azevedo JL, Cortright R, Dohm GL, Goldstein BJ. Alterations in skeletal muscle protein-tyrosine phosphatase activity and expression in insulin-resistant human obesity and diabetes. J Clin Invest. 1997;100:449–458. | ||
Zhang S, Zhang ZY. PTP1B as a drug target: recent developments in PTP1B inhibitor discovery. Drug Discov Today. 2007;12:373–381. | ||
Liu G. Review technology evaluation: ISIS-113715 (Isis). Curr Opin Mol Ther. 2004;6:331–336. | ||
Bialy L, Waldmann H. Inhibitors of protein tyrosine phosphatases: next-generation drugs? Angew Chem Int Ed Eng. 2005;l44:3814–3839. | ||
You-Ten KE, Muise ES, Itie A, et al. Impaired bone marrow microenvironment and immune function in T cell protein tyrosine phosphatase deficient mice. J Exp Med. 1997;186:683–693. | ||
Goldstein BJ, Ahmad F, Ding W, Li PM, Zhang WR. Regulation of the insulin signalling pathway by cellular protein-tyrosine phosphatases. Mol Cell Biochem. 1998;182:91–99. |
Supplementary materials
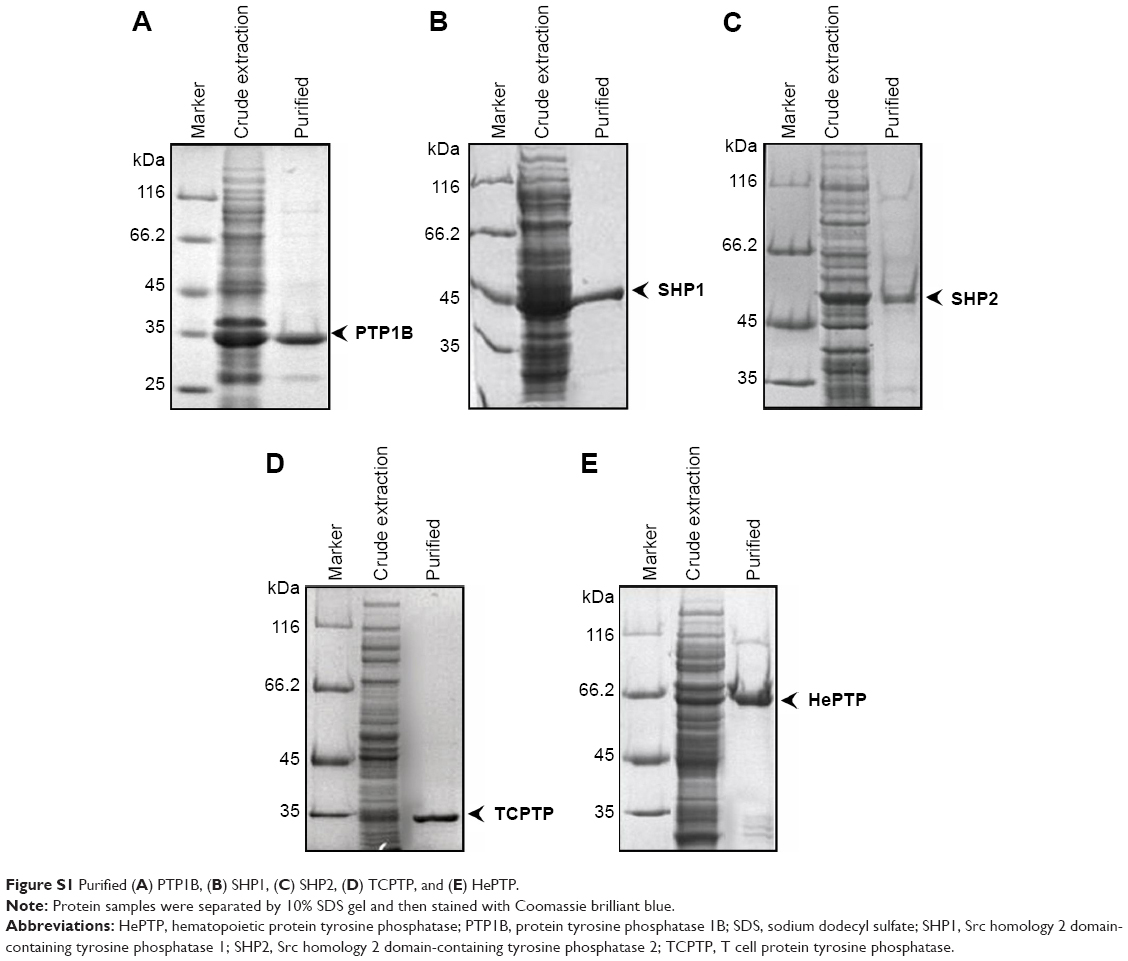 | Figure S1 Purified (A) PTP1B, (B) SHP1, (C) SHP2, (D) TCPTP, and (E) HePTP. |
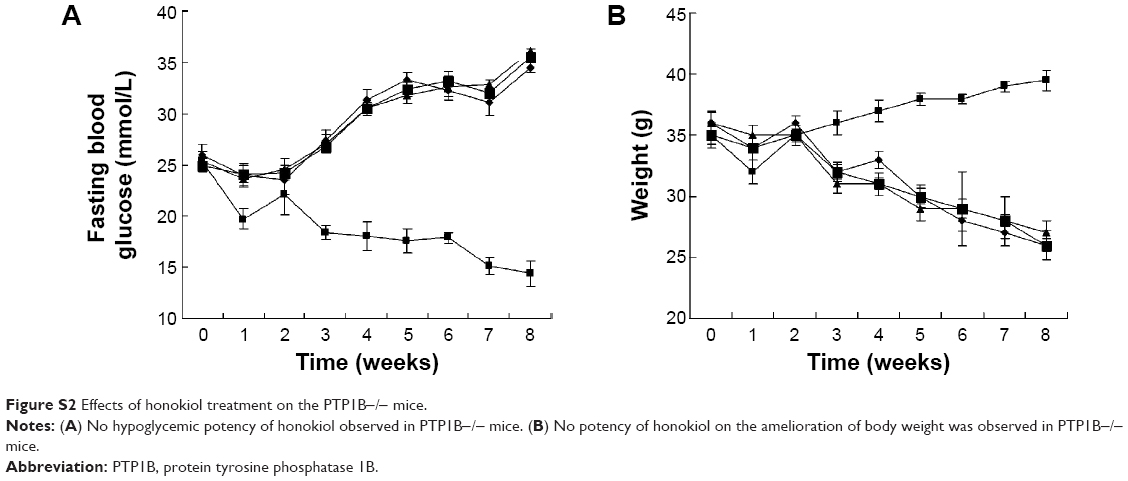 | Figure S2 Effects of honokiol treatment on the PTP1B−/− mice. |
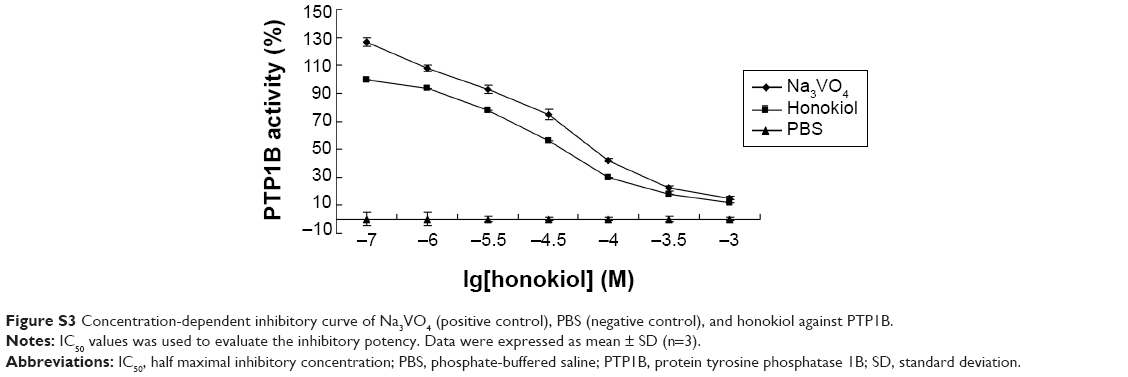 | Figure S3 Concentration-dependent inhibitory curve of Na3VO4 (positive control), PBS (negative control), and honokiol against PTP1B. |
 © 2015 The Author(s). This work is published and licensed by Dove Medical Press Limited. The
full terms of this license are available at https://www.dovepress.com/terms
and incorporate the Creative Commons Attribution
- Non Commercial (unported, 3.0) License.
By accessing the work you hereby accept the Terms. Non-commercial uses of the work are permitted
without any further permission from Dove Medical Press Limited, provided the work is properly
attributed. For permission for commercial use of this work, please see paragraphs 4.2 and 5 of our Terms.
© 2015 The Author(s). This work is published and licensed by Dove Medical Press Limited. The
full terms of this license are available at https://www.dovepress.com/terms
and incorporate the Creative Commons Attribution
- Non Commercial (unported, 3.0) License.
By accessing the work you hereby accept the Terms. Non-commercial uses of the work are permitted
without any further permission from Dove Medical Press Limited, provided the work is properly
attributed. For permission for commercial use of this work, please see paragraphs 4.2 and 5 of our Terms.