Back to Journals » Clinical Epidemiology » Volume 11
Hospital differences in mortality rates after hip fracture surgery in Denmark
Authors Kristensen PK ![]() , Merlo J
, Merlo J ![]() , Ghith N
, Ghith N ![]() , Leckie G
, Leckie G ![]() , Johnsen SP
, Johnsen SP
Received 3 May 2019
Accepted for publication 14 June 2019
Published 16 July 2019 Volume 2019:11 Pages 605—614
DOI https://doi.org/10.2147/CLEP.S213898
Checked for plagiarism Yes
Review by Single anonymous peer review
Peer reviewer comments 2
Editor who approved publication: Professor Irene Petersen
Pia Kjær Kristensen,1,2 Juan Merlo,3 Nermin Ghith,3,4 George Leckie,5 Søren Paaske Johnsen6
1Department of Clinical Epidemiology, Aarhus University Hospital, Aarhus N DK-8200, Denmark; 2Department of Orthopedic Surgery, Regional Hospital Horsens, Horsens DK-8700, Denmark; 3Research Unit of Social Epidemiology, CRC, Faculty of Medicine, Lund University, Malmö SE-20502, Sweden; 4Research Unit for Chronic Diseases and E-Health, Section for Health Promotion and Prevention, Center for Clinical Research and Prevention, Frederiksberg Hospital, Frederiksberg 2000, Denmark; 5Centre for Multilevel Modelling, School of Education, University of Bristol, Bristol BS8 1JA, UK; 6Department of Clinical Medicine, Aalborg University, Aalborg DK-9000, Denmark
Background: Thirty-day mortality after hip fracture is widely used when ranking hospital performance, but the reliability of such hospital ranking is seldom calculated. We aimed to quantify the variation in 30-day mortality across hospitals and to determine the hospital general contextual effect for understanding patient differences in 30-day mortality risk.
Methods: Patients aged ≥65 years with an incident hip fracture registered in the Danish Multidisciplinary Fracture Registry between 2007 and 2016 were identified (n=60,004). We estimated unadjusted and patient-mix adjusted risk of 30-day mortality in 32 hospitals. We performed a multilevel analysis of individual heterogeneity and discriminatory accuracy with patients nested within hospitals. We expressed the hospital general contextual effect by the median odds ratio (MOR), the area under the receiver operating characteristics curve and the variance partition coefficient (VPC).
Results: The overall 30-day mortality rate was 10%. Patient characteristics including high sociodemographic risk score, underweight, comorbidity, a subtrochanteric fracture, and living at a nursing home were strong predictors of 30-day mortality (area under the curve=0.728). The adjusted differences between hospital averages in 30-day mortality varied from 5% to 9% across the 32 hospitals, which correspond to a MOR of 1.18 (95% CI: 1.12–1.25). However, the hospital general context effect was low, as the VPC was below 1% and adding the hospital level to a single-level model with adjustment for patient-mix increased the area under the receiver operating characteristics curve by only 0.004 units.
Conclusions: Only minor hospital differences were found in 30-day mortality after hip fracture. Mortality after hip fracture needs to be lowered in Denmark but possible interventions should be patient oriented and universal rather than focused on specific hospitals.
Keywords: hip fracture, hospital variance, multilevel analysis, 30-day mortality
Introduction
Thirty-day mortality is increasingly used to measure and compare health care performance and quality across hospitals, as it is easily understood, clearly defined, universally resonant for patients, clinicians, and managers and is considered to convey key elements of health care.1,2 The implicit assumption is that the variation in this patient outcome measure reflects variation in hospital policies and practices that are within hospitals’ control. Outcome measures are especially used within surgery including orthopedic surgeries, which only to a limited extent have used process performance measures to reflect health care performance.
The results from such hospital comparisons are applied for benchmarking, including sanctions or rewards to specific hospitals, as well as for internal quality improvement initiatives based on the plan-do-study-act principle.3 However, hospital comparisons may also lead to stigmatizing hospitals with the highest mortality rates. Sound methodology and reliable estimates are therefore crucial when ranking hospitals.4–6 Although ranking hospitals on their average mortality are easy to do, such rankings are naïve as any sense of the difference in mortality rates between rankings is lost and the substantial role of chance variability in driving mortality rates and therefore rankings in hospitals with small numbers of patients is ignored.7 More fundamentally, hospital comparisons must account for variation in case-mix across different hospitals which strongly predicts patient outcomes and therefore variation in unadjusted hospital mean outcomes.4,5,8–10
The multilevel approach to studying variation in patient outcomes decomposes any variation unexplained by the covariates into separate variance components operating at the patient and hospital levels of analysis.6,11–15 Thus, the hospital variance component, often referred to as the hospital general context effect, quantifies the share of the total individual variation in 30-day mortality that lies at the hospital level over and above differences in patient characteristics. In addition, multilevel models also provide a better approach for handling the unreliable data that arise from small hospital caseloads and therefore for detecting true hospital quality differences compared to their fixed-effects model counterparts.10,12–14
Previous studies within surgery using multilevel models have focused on the reliability of ranking hospitals, but no previous studies have obtained reliability-weighted estimates of hospital average rates of hip fracture mortality, although hip fracture is often used as a tracer condition for hospital performance.16 In this article, we, therefore, pursue two aims. Our first aim is to obtain reliability-weighted estimates of hospital average rates that take into account hospital differences in patient load to examine the amount of differences. Our second aim is to quantify the size of the hospital general contextual effect, to examine to what extent the variation in mortality is attributable to differences at the hospital level.
Population and methods
This historical follow-up study is based on prospectively collected data available from medical registries in Denmark (5.8 million inhabitants) with free access to medical care.17 At birth or upon immigration, all citizens in Denmark are assigned a unique registration number through which all contact with the health care system is recorded. This allows unambiguous record linkage between registries.18 The study was approved by the Danish Data Protection Agency (journal number 2012–41-1274).
Data sources
The Danish Multidisciplinary Hip Fracture Registry (DMHFR) was used to identify a cohort of hip fracture patients.19 The DMHFR was established in 2003 to document and improve care quality and the registry includes data on all patients age ≥65 admitted with femoral fractures (International Classification of Diseases 10th revision codes) medial (DS720), pertrochanteric (DS721), or subtrochanteric (DS722) treated surgically according to the Classification for Surgical Procedures (codes) with osteosynthesis (KNFJ) or alloplastic (KNFB).20
DMHFR is a national clinical quality register and contains patient-level data on process performance measures reflecting current guidelines for in-hospital hip fracture care. The register also contains sociodemographic and clinical characteristics. Reporting to the registry is mandatory by law for all hospital departments treating hip fracture patients and data are recorded prospectively by the care staff starting from patient admission.19
The study database was then complemented with information from the nationwide administrative Danish National Patient Registry (DNPR), which holds data on all non-psychiatric hospital admissions since 1977 and on all outpatient and emergency visits since 1995, recorded according to the International Classification of Diseases (Eight Revision, ICD-9) until the end of 1993 and Tenth Revision (ICD-10) thereafter.18
We also linked the study database to the Danish Civil Registry System (DCRS), which has maintained electronic records of changes in vital status and migration for the entire Danish population since 1968, which allow complete follow-up on mortality in this study.18
Finally, we included demographic and socioeconomic information from Statistic Denmark. Statistic Denmark is a collection of register data, which contains detailed statistical information on residents in Denmark and the Danish society.21,22 These registers are updated yearly.
Study population
We identified all first time hospitalizations for hip fracture patients registered in the DMHFR with a discharge date between 2007 and 2016 (N=65,931). We excluded patients with more than one hip fracture during the study period (N=4092), so we only include the first admission for hip fracture in the study cohort. Further, we excluded patients residing less than five years in Denmark prior to the hip fracture surgery date (N=199) because of insufficient information on previous income and comorbidity in the Danish registries. We also excluded 1,636 patients for the following reasons; missing hip fracture surgery code, patients without a registered address, double registration, patients treated in January and February 2010 due to change in reporting system and patients registered at hospital departments with less than 10 hip fracture patients per year. The final study cohort included 60,004 patients (Figure 1).
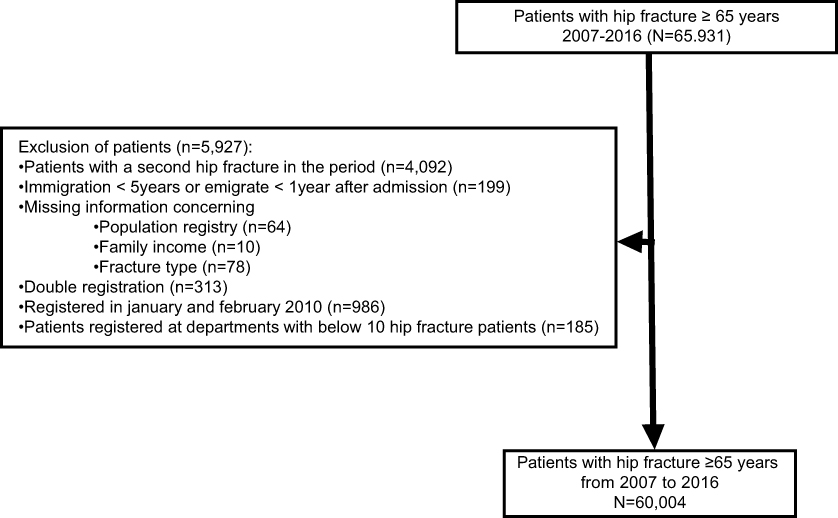 |
Figure 1 Flowchart patient inclusion. |
Assessment of variables
Outcome variables
We investigated all-cause mortality within 30 days based on data from DCRS.
Patient characteristics
In the analysis, we wish to interpret hospital differences, but part of these differences relates to selection bias that confounds the comparison between hospitals. To make the observational measurement of hospital effects as valid as possible we therefore, adjust for potential differences in patient sociodemographic and biomedical characteristics (Table 1).23,24
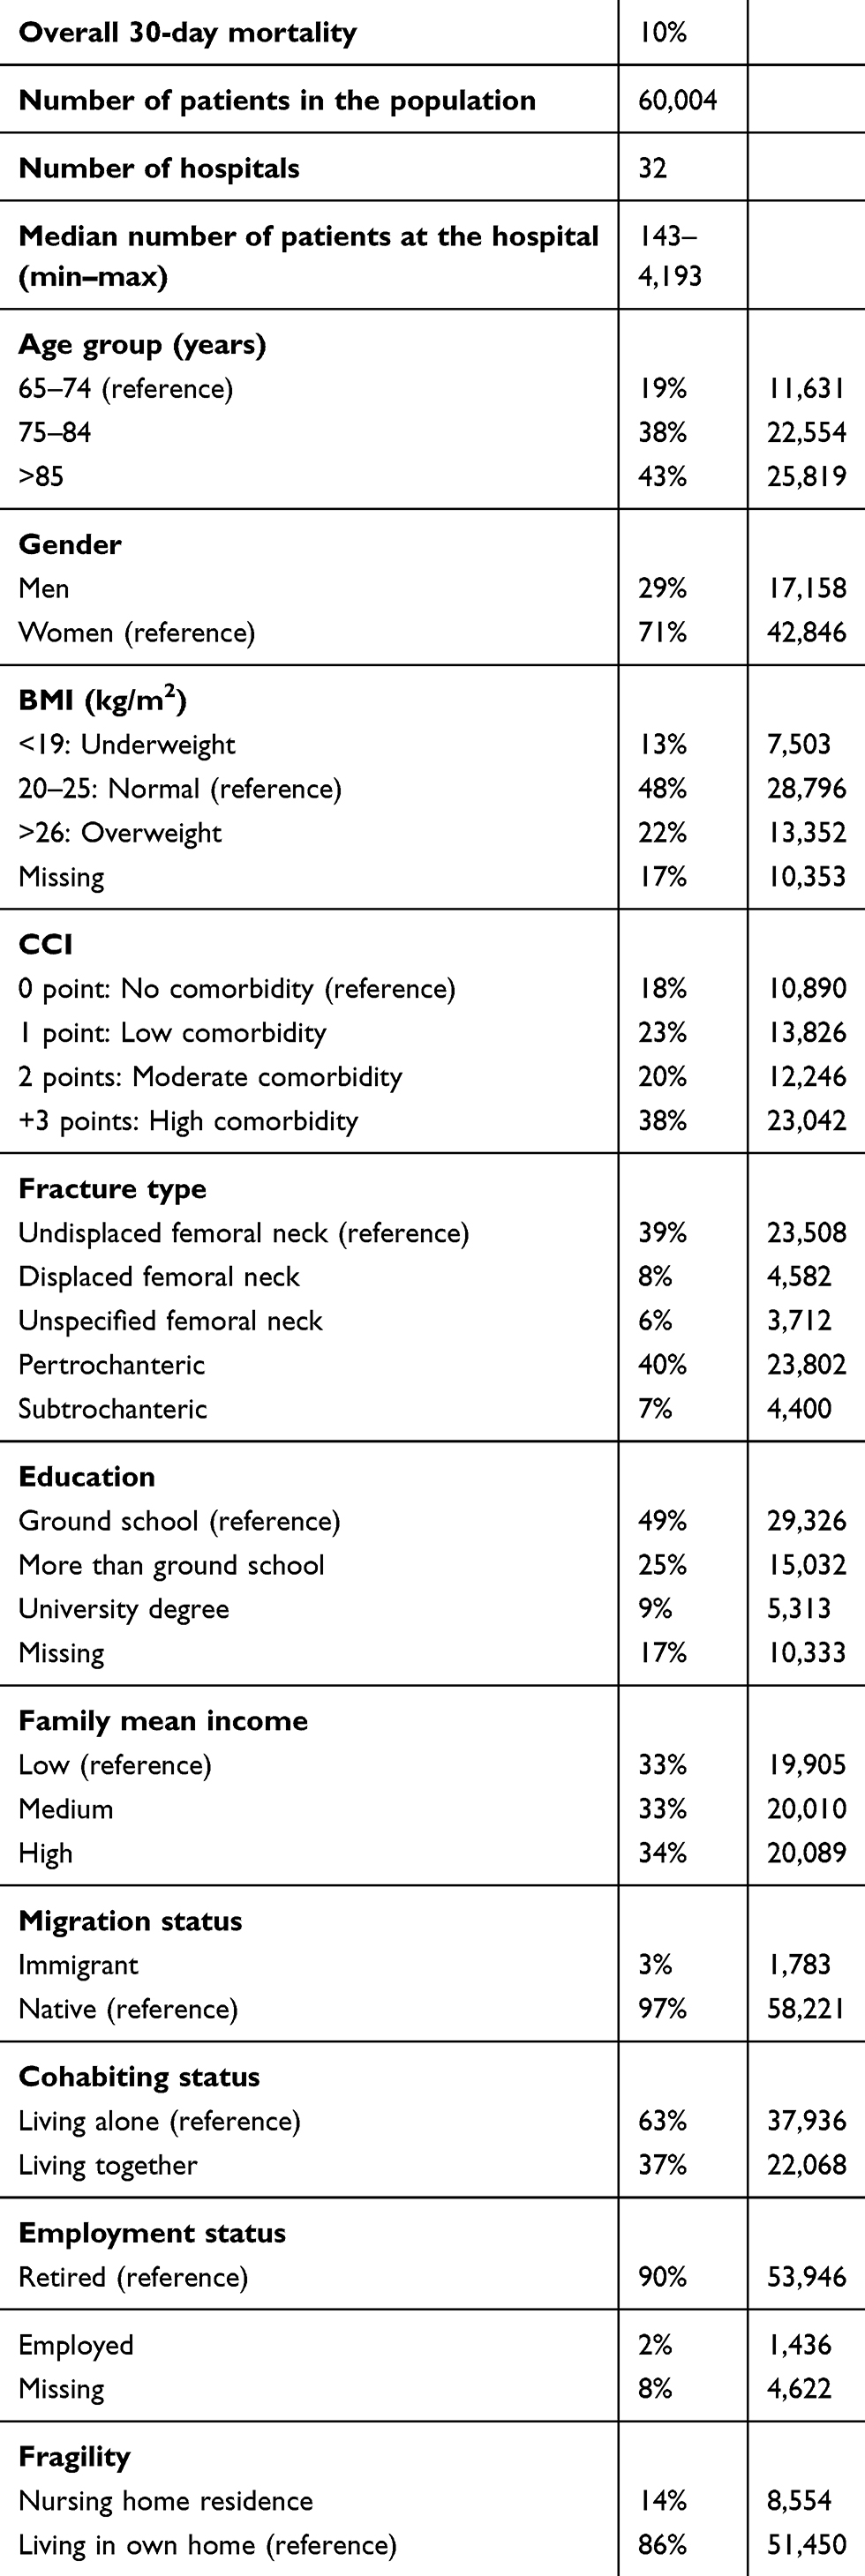 |
Table 1 Characteristic of the hip fracture population |
Sociodemographic characteristics
Age (65–75 years, 75–85 years, and >85 years) and sex were classified according to criteria used at the DMHFR. We categorized individualized family income into four groups by quartiles of increasing income.25 To account for yearly variation in family income, we calculated the average yearly total income in the five years before admission for the patient and cohabiting partner. We classified education achievement into (i) elementary school (7 years), (ii) more than elementary school, (iii) university degree, and (iv) missing values.25 We dichotomized the country of birth of the patients into migrant vs native and their cohabiting status into living alone vs living together. We classified employment status into (i) retired, (ii) employed, and (iii) missing values. To simplify the model and decrease the likelihood of non-convergence, which may be a problem when including multiple covariates in multilevel models, we combined sociodemographic characteristics into a single patient risk score. Using a conventional logistic regression analysis we estimated the individual patient´s sociodemographic risk score (predicted probability) for all-cause mortality based on sex, age, family income, education, migration, employment, and cohabitation status. The sociodemographic risk scores were then categorized into four groups by quartiles as low, medium, high, and very high. The low-risk score group was then used as the reference in the comparisons.
Biomedical characteristics
The body mass index (BMI) in kg/m2 and the type of hip fracture were classified according to criteria used at the DMHFR (Table 1). We summarized the complete comorbidity history of each patient. We ascertained all diagnoses included in the Charlson comorbidity index (CCI) during the last 10 years including the admission for hip fracture.26 The CCI is a method of categorizing comorbidities of patients based on ICD diagnosis codes from DNPR. Each comorbidity category has an associated weight, based on the adjusted risk of mortality or resource use, and the sum of all the weights results in a single comorbidity score for a patient that ranges from 1 to 6 points. The higher the score, the higher the level of comorbidity and thereby the mortality risk. We categorized the CCI into, no comorbidity (0 points), low comorbidity (1 point), moderate comorbidity (2 points), and high comorbidity (≥3 points). We also included a dichotomous variable distinguishing if the patient was living in nursing home residence or living in own home.
Statistical analysis
We estimated the cumulative risk for 30-day mortality. To quantify the variation in this outcome across the 32 hospitals and to disentangle hospitals from patient influences, we applied a stepwise-multilevel, logistic regression analysis of discriminatory accuracy with patients nested in hospitals.11 We developed three consecutive logistic regression analyses. For each model, we calculated the predicted probability of death and then used this to compute the Receiving Operator Characteristics Curve and to calculate the area under this curve (AUC).27 The AUC measures the ability of the model to correctly classify individuals with or without the outcome.
Model 1 was a simple conventional logistic regression aimed to evaluate the influence of patients’ demographic and socioeconomic characteristics on the outcome using the sociodemographic risk score groups. We calculated the AUC1.
Model 2 added the biomedical characteristics of the patients including BMI, CCI, frailty, and fracture type. We calculated the AUC2 and in order to quantify the value added of the biomedical information compared to only using sociodemographic information we obtained the increment in the AUC (AUC2 − AUC1).
Model 3 was a multilevel logistic regression model which included a random intercept for the 32 hospitals. This model aimed to isolate the contribution of the hospital to the individual risk of 30-day mortality. To quantify the variation in 30-day mortality across hospitals, we estimated the absolute risk of 30-day mortality and its 95% confidence intervals (CI) for each hospital by transformation of the results from the multilevel logistic regression to the probability scale. The absolute risk for each hospital was calculated as a function of both the sample average patient case -mix (the estimated fixed part of the model where the covariates are held at their average values) and the hospital attended (the predicted hospital random effect). This answers the question: how would mortality rates vary across hospitals if all hospitals had exactly the same case-mix where that case-mix matches the overall average case-mix in the data? The predicted hospital random effects provide reliability-weighted estimates of the hospital average risks. To illustrate adjusted absolute risk differences between hospitals, we created league tables by ranking hospitals according to their absolute risk. Model 3 also aimed to examine the size of the hospital general contextual effect in order to answer to what extent the variation in mortality was attributable to differences in patient characteristics or the hospital context. Besides the changes in AUC (AUC3 – AUC2), we used standard summary statistics including the intraclass correlation coefficient (ICC) and median odds ratio (MOR). The ICC is a measure of clustering that informs on the magnitude the correlation in the propensity for an outcome (having adjusted for the covariates) between two individuals, who are treated at the same hospital. This statistic can also be interpreted as a variance partition coefficient (VPC),28–30 namely the proportion of adjusted individual outcome variation that lies between hospitals. These statistics are derived from the latent response formulation of the logistic regression model where the patient-level residuals follow a logistic distribution with a constant variance of 3.29.31 The formula of the VPC/ICC is
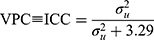
where  represent the hospital variance. The MOR is a measure of heterogeneity between hospitals. The MOR translates the hospital variance estimated on the log-odds scale, to the widely used OR scale, which makes it comparable with the OR of the covariates in the fixed part of the model. The MOR is defined as the median value of the distribution of ORs obtained when randomly picking two individuals with the same covariate values from two different hospitals, and comparing the one from the higher risk hospital to the one from the lower risk hospital. In simple terms, the MOR can be interpreted as the median increased odds of mortality if an individual was treated in another hospital with higher risk. The MOR is calculated as
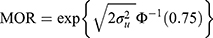
where  is the inverse cumulative standard normal distribution function. In the absence of any hospital variation (i.e.,
  ), the MOR is equal to 1.
We performed a likelihood ratio test to test for whether we were able to detect statistically significant differences between the 32 hospitals.
We performed the analyses using maximum likelihood estimation (via adaptive quadrature) as implemented in the melogit command in Stata (StataCorp., 2014).32
Results
Characteristics of the hip fracture population
The overall 30-day mortality rate in the cohort was 10%. The hip fracture patients in our cohort were mainly above 85 years and the majority were women. Most of the patients had an undisplaced femoral neck fracture or a pertrochanteric hip fracture. The additional characteristics of the hip fracture patients are described in Table 1.
Patient effects
The sociodemographic risk score was clearly associated with 30-day mortality (Table 2). Also, underweight patients and, especially, patients with missing information on BMI presented a higher risk of 30-day mortality. Comorbidity, as captured by the CCI, as well as frailty, both increased 30-day mortality risk. Patients with a subtrochanteric femur fracture presented an increased mortality risk whereas patients with a displaced femoral neck fracture have lower mortality risk. The AUC1 in model 1, which informs on the discriminatory accuracy of the sociodemographic information, had a value of 0.67 (95% CI: 0.66–0.68) (Table 2). Including the biomedical characteristics of the patients (model 2) increased the AUC to 0.73 (95% CI: 0.72–0.73).
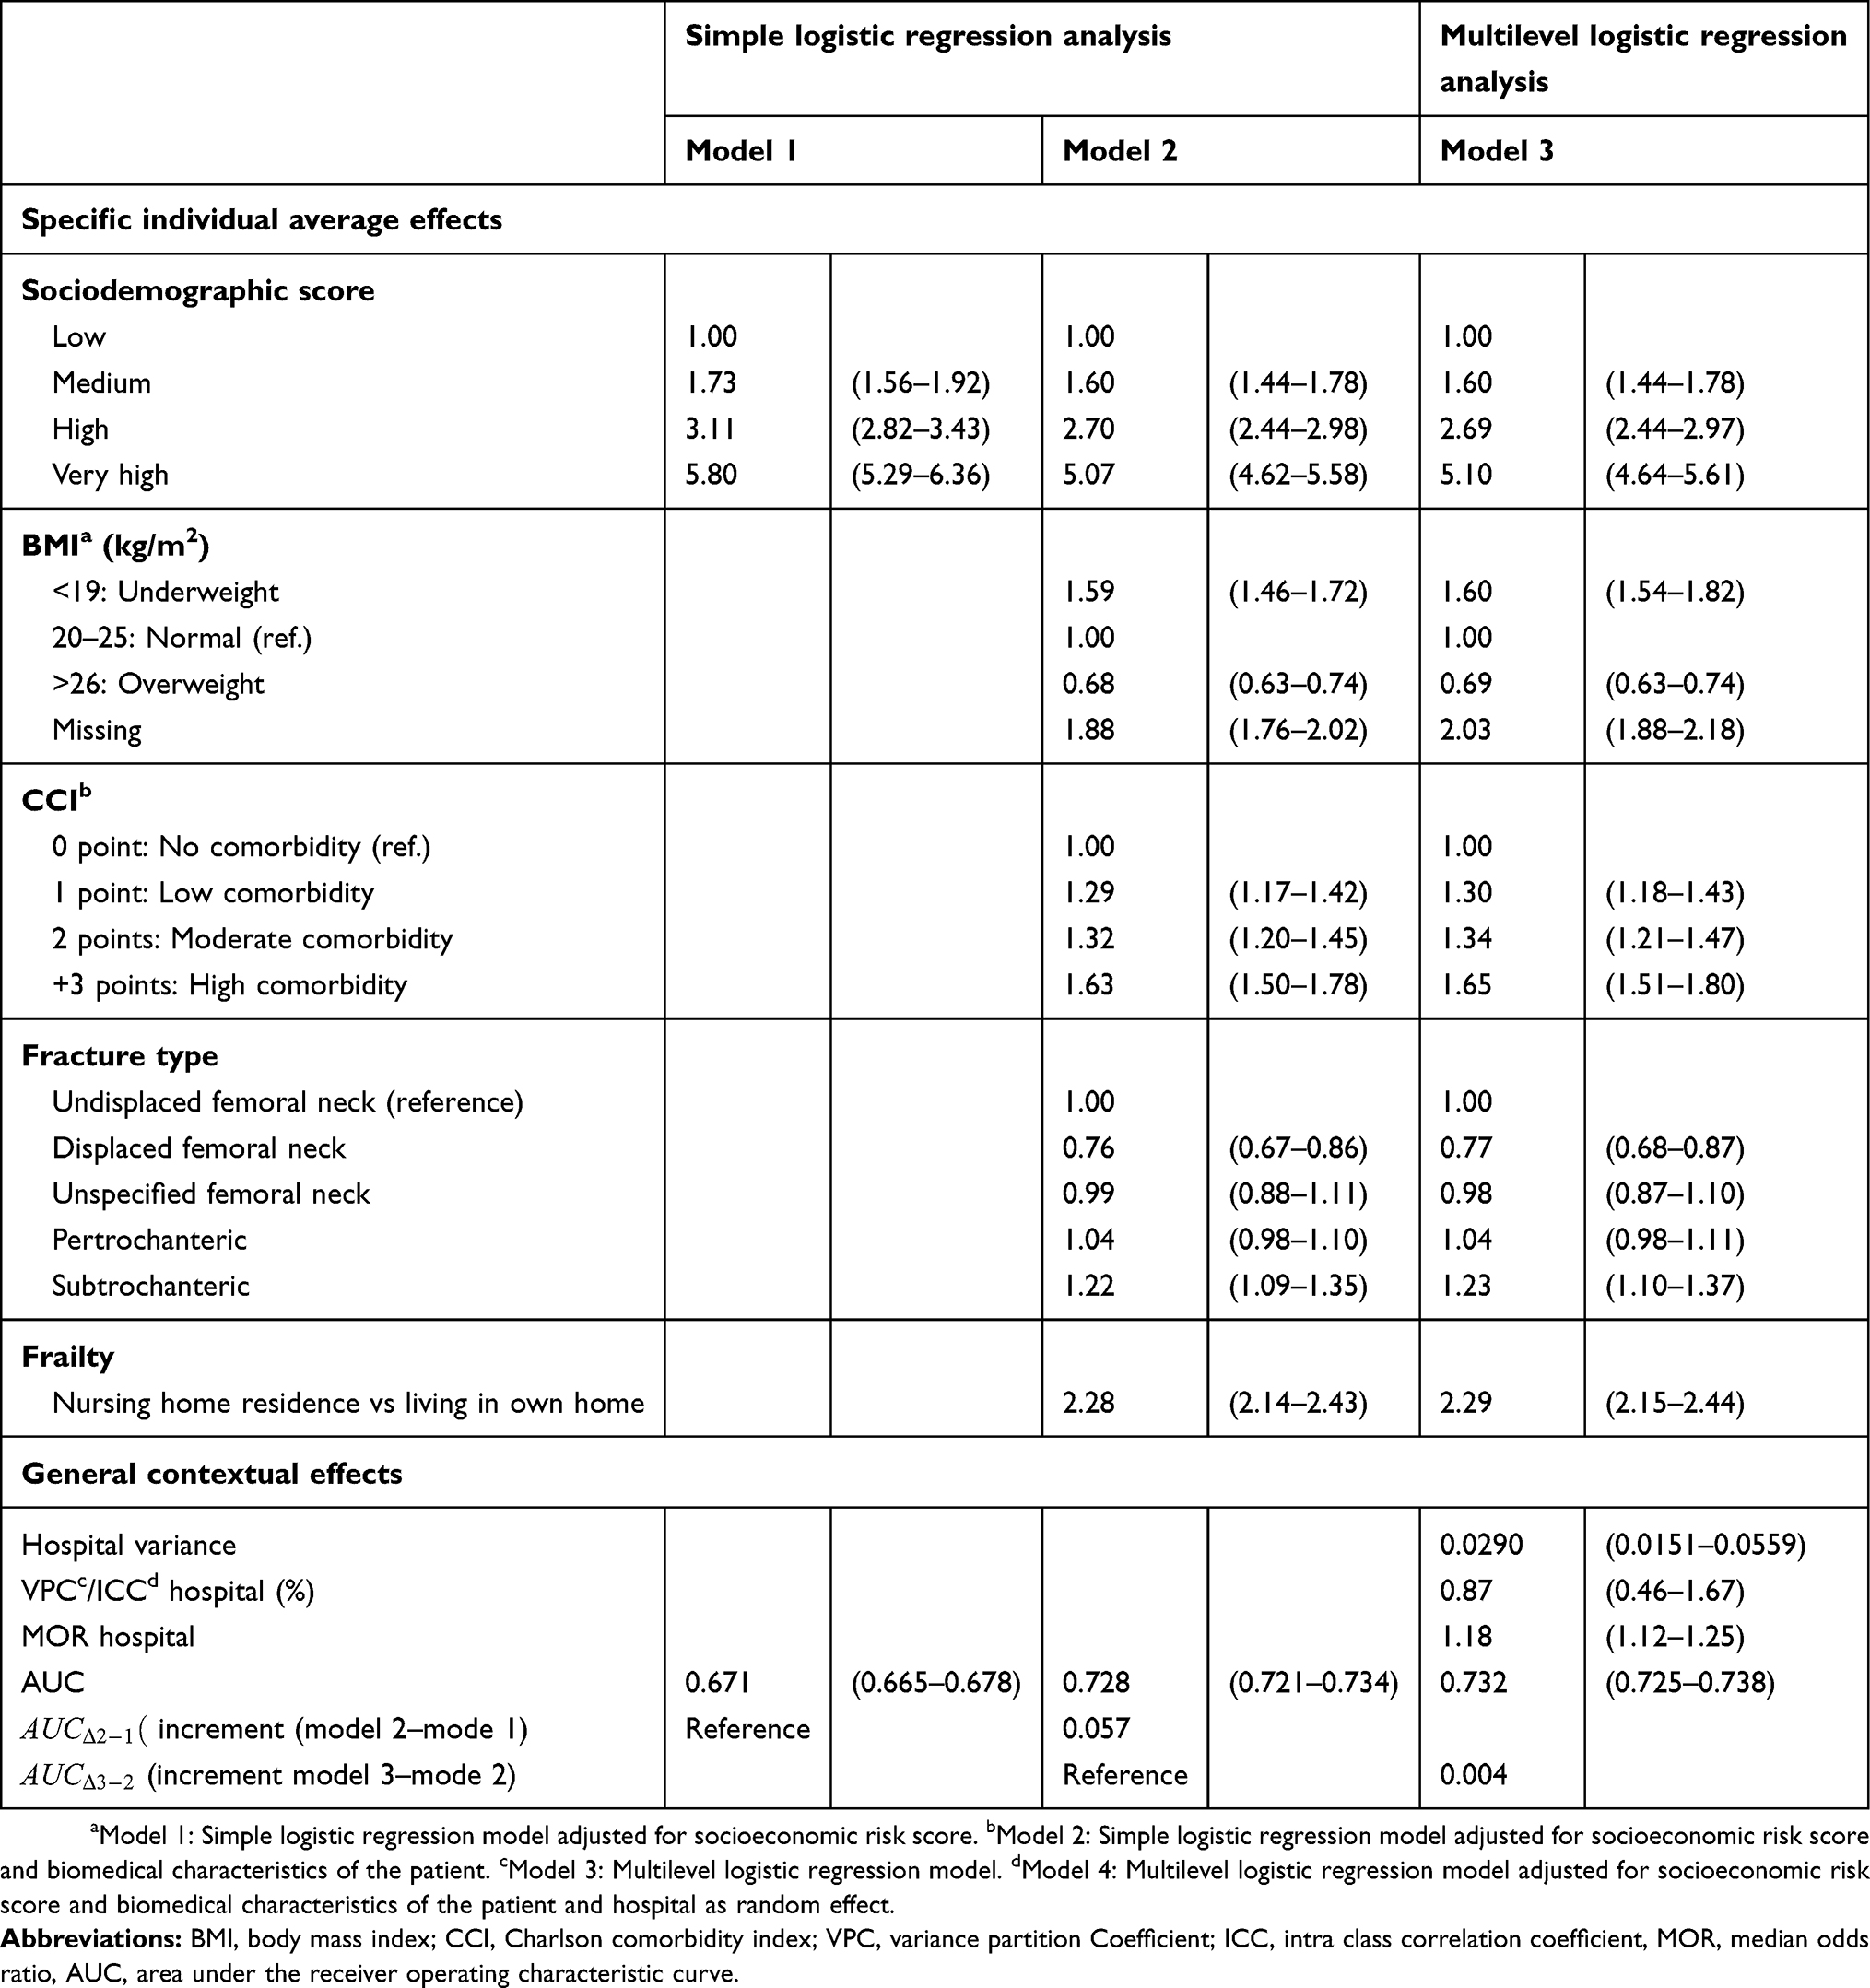 |
Table 2 Variation in 30-day mortality |
Hospital effects
The unadjusted 30-day mortality varied from 8% to 12% across the 32 hospitals (Figure 2). The adjusted differences between hospital averages in mortality extended from 5% to 9% (Figure 3). Figure 3 shows that the hospital with the highest absolute risk has an average mortality risk 1.8 times higher than the hospital with the lowest absolute risk. Similarly, the hospital variance, indicated by the MOR, showed an increased adjusted odds of dying within 30 days of 1.18 (95% CI: 1.12–1.25) if a patient was admitted to high-risk hospital compared to a low-risk hospital. However, the clustering of hip fracture patients within the 32 hospitals was small, as the VPC was 0.87% (95% CI: 0.46–1.67%), indicating that less than 1% of the adjusted individual variance in the underlying propensity of death was at the hospital level. A likelihood ratio test showed that these hospital differences while substantively small were statistically significant. Similarly, the AUC in model 3, which included the hospital level, only increased marginally by 0.004 points, when compared with the single-level model (model 2) (Table 2).
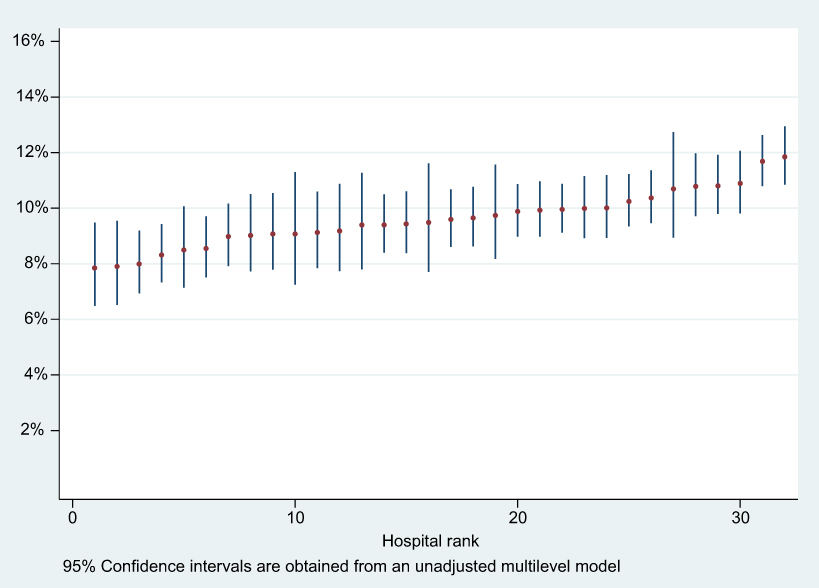 |
Figure 2 League table ranking the 32 hospitals according to their unadjusted absolute risk of 30-day mortality with 95 % confidence intervals obtained from a multilevel model. |
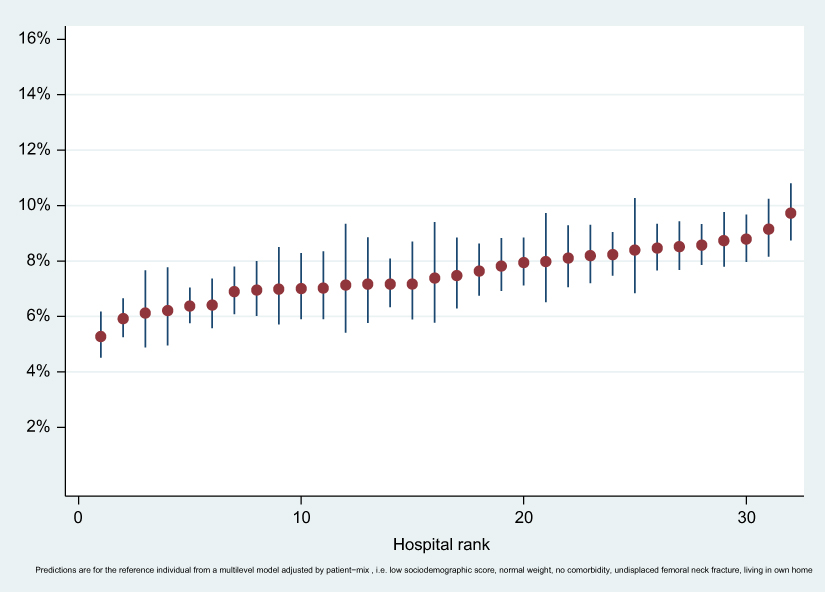 |
Figure 3 League table ranking the 32 hospitals according to their adjusted absolute risk of 30-day mortality with 95 % confidence intervals obtained from a multilevel model adjusted by patient-mix. |
Discussion
In this nationwide population-based study of hip fracture patients, the overall 30-day mortality rate was 10%. Patient factors including sociodemographic characteristics, underweight, comorbidity, and suffering from a subtrochanteric hip fracture were strong predictors of 30-day mortality (AUC=0.728). The adjusted hospital differences in 30-day mortality rates varied from 5% to 9% across the 32 hospitals. However, the multilevel analysis revealed that hospital-level variation corresponded to less than 1% of the overall individual variation in the underlying propensity of death.
Still, some hospitals presented a higher average absolute risk than others and the adjusted mortality rate was 1.8 times higher at the top than at the bottom of the hospital league table. The existence of hospital differences in average absolute risks may suggest that there is a place for some improvement by focusing on the hospitals at the higher extreme of the absolute risk distribution. However, the fact that most of the variance is related to known patient-level characteristics (AUC=0.728 in model 2) and that the hospital general context effect is very low argues against hospital-level interventions. Instead, health care systems should focus on improving care at the patient level as indicated by the substantial individual-level variation in 30-day mortality observed in our study.
Nationwide studies from Sweden and England among hip fracture patients observed an overall 30-day mortality rate below 8% compared to the Danish 10%.33,34 One potential explanation of the higher mortality in Denmark could be the lack of adherence to clinical guidelines observed in the Danish Multidisciplinary Hip Fracture Registry.35 Interestingly, in the UK, 30-day mortality after hip fracture is lower than in Denmark but the UK has a higher fulfillment of nearly identical process performance measures.36,37 Compliance with guideline recommended process performance measures are associated with lower mortality38,39 as well as unchanged or even lower hospital cost.40
The low variation at the hospital level, when examining outcome measures, is comparable to previous multilevel studies within other areas which have focused on rankability and reliability.4,10 Our study is therefore in accordance with these existing studies when questioning the use of continuous monitoring outcome measures as a mirrored image of the health care quality delivered at hospitals. Lilford et al,3 have pointed out that differences in health care are likely to be lost when using outcome indicators (eg, mortality), due to poor correlation between processes and outcomes and the inherent problem of confounding. However, as opposed to the existing studies, we quantified the size of the hospital differences as we have applied a comprehensive perspective which at the same time considers both hospital differences and patient differences including their relative importance instead of considering them as two separate and unrelated phenomena of interest. The fact that 30-day mortality and other related measures are routinely used even though there is a very little hospital-level variation calls for reflection. A more systematic evaluation of the relevance and usability of performance measures seems warranted in general and for generic outcome performance measures like 30-day mortality in particular if efforts invested in quality improvement work are to be effective. Advanced analytical approaches may be useful in this context as exemplified in our study.
Methodological considerations
Our results should be evaluated in light of several limitations. First, patient characteristics may have differed in ways that were not captured by the registries. However, to minimize confounding we adjusted for a range of well-established prognostic factors and the resulting AUC was moderate at 0.73.
Secondly, the multilevel approach is more conservative in identifying outliers compared to, conventional logistic regression which enters hospitals as dummy variables (ie, fixed-effect models), which have greater sensitivity. As opposed to this, the multilevel approach (ie, random-effect models) has higher specificity and is less susceptible to biased estimation by random variation if the number of patients in some hospitals is low.12,41
Thirdly, the length of hospital stay has decreased in our health care systems, which includes early discharge of patients to their own home with support from the municipality. The variation among hospitals in 30-day mortality therefore likely expresses the integrated performance of both hospital and municipality care. However, the analysis demonstrated that the hospital variance component in any case was very small in magnitude.
Conclusion
In conclusion, the adjusted differences between hospital 30-day mortality rates varied from 5% to 9%. However, less than 1% of the patient variation in adjusted propensity of death within 30 days operated between hospitals. To reduce 30-day mortality among hip fracture patients, we should focus on improving the care for the most vulnerable patients. A feasible way of improving care without increasing the health care cost is to focus on the implementation of basic health care processes reflecting clinical guideline recommendations. The hospital level is fundamental in hip fracture care, but our results suggest that interventions to ensure high care quality should be universal rather than focused on specific hospitals.
Acknowledgments
We thank the staff of the hospital departments caring for patients with hip fractures for their continuous effort and contribution to acquisition of the data in the Danish Multidisciplinary Hip Fracture Registry. This work was supported by the Health Research Fund of Central Denmark Region (Pia Kjær Kristensen). This work was also supported by funds from the Swedish Research Council (#2017-01321. PI: Juan Merlo) and research funds from the Faculty of Medicine, Lund University, and Region Skåne County Council. The financial sponsors did not play a role in the design, execution, analysis, interpretation of data, or writing of the study.
Disclosure
Dr Kristensen reports grants from Health Research Fund of Central Denmark Region, during the conduct of the study. The authors report no other conflicts of interest in this work.
References
1. Krumholz HM, Lin Z, Keenan PS, et al. Relationship between hospital readmission and mortality rates for patients hospitalized with acute myocardial infarction, heart failure, or pneumonia. JAMA. 2013;309(6):587–593. doi:10.1001/jama.2013.333
2. Faber M, Bosch M, Wollersheim H, Leatherman S, Grol R. Public reporting in health care: how do consumers use quality-of-care information? A systematic review. Med Care. 2009;47(1):1–8. doi:10.1097/MLR.0b013e3181808bb5
3. Lilford RJ, Brown CA, Nicholl J. Use of process measures to monitor the quality of clinical practice. BMJ (Clinical Research Ed). 2007;335(7621):648–650. doi:10.1136/bmj.39317.641296.AD
4. Dimick JB, Staiger DO, Birkmeyer JD. Ranking hospitals on surgical mortality: the importance of reliability adjustment. Health Serv Res. 2010;45(6 Pt 1):1614–1629. doi:10.1111/j.1475-6773.2010.01158.x
5. Dimick JB, Ghaferi AA, Osborne NH, Ko CY, Hall BL. Reliability adjustment for reporting hospital outcomes with surgery. Ann Surg. 2012;255(4):703–707. doi:10.1097/SLA.0b013e31824b46ff
6. Krell RW, Hozain A, Kao LS, Dimick JB. Reliability of risk-adjusted outcomes for profiling hospital surgical quality. JAMA Surg. 2014;149(5):467–474. doi:10.1001/jamasurg.2013.4249
7. Adab P, Rouse AM, Mohammed MA, Marshall T. Performance league tables: the NHS deserves better. BMJ. 2002;324(7329):95–98. doi:10.1136/bmj.324.7329.95
8. Henneman D, van Bommel AC, Snijders A, et al. Ranking and rankability of hospital postoperative mortality rates in colorectal cancer surgery. Ann Surg. 2014;259(5):844–849. doi:10.1097/SLA.0000000000000561
9. Hashmi ZG, Dimick JB, Efron DT, et al. Reliability adjustment. J Trauma Acute Care Surg. 2013;75(1):166–172.
10. van Dishoeck AM, Lingsma HF, Mackenbach JP, Steyerberg EW. Random variation and rankability of hospitals using outcome indicators. BMJ Qual Saf. 2011;20(10):869–874. doi:10.1136/bmjqs.2010.048058
11. Merlo J, Wagner P, Ghith N, Leckie G. An original stepwise multilevel logistic regression analysis of discriminatory accuracy: the case of neighbourhoods and health. PLoS One. 2016;11(4):e0153778. doi:10.1371/journal.pone.0153778
12. Ash AS, Fienberg SF, Louis TA, Normand S-LT, Stukel TA, Utts J. Statistical Issues in Assessing Hospital Performance. Quantitative Health Sciences Publications and Presentations; 2012.
13. Ghith N, Wagner P, Frolich A, Merlo J. Short term survival after admission for heart failure in Sweden: applying multilevel analyses of discriminatory accuracy to evaluate institutional performance. PLoS One. 2016;11(2):e0148187. doi:10.1371/journal.pone.0148187
14. Merlo J, Wagner P, Austin PC, Subramanian SV, Leckie G. General and specific contextual effects in multilevel regression analyses and their paradoxical relationship: a conceptual tutorial. SSM Popul Health. 2018;5:33–37. doi:10.1016/j.ssmph.2018.05.006
15. Ohlsson H, Librero J, Sundquist J, Sundquist K, Merlo J. Performance evaluations and league tables: do they capture variation between organizational units? An analysis of 5 Swedish pharmacological performance indicators. Med Care. 2011;49(3):327–331. doi:10.1097/MLR.0b013e31820325c5
16. Qureshi A, Gwyn Seymour D. Growing knowledge about hip fracture in older people. Age Ageing. 2003;32(1):8–9. doi:10.1093/ageing/32.1.8
17. Denmark S. Statistikbanken. 2018; Available from: http://www.statistikbanken.dk/statbank5a/default.asp?w=2327.
18. Schmidt M, Pedersen L, Sorensen HT. The Danish civil registration system as a tool in epidemiology. Eur J Epidemiol. 2014;29(8):541–549. doi:10.1007/s10654-014-9930-3
19. Mainz J, Krog BR, Bjornshave B, Bartels P. Nationwide continuous quality improvement using clinical indicators: the Danish national indicator project. Int J Qual Health Care. 2004;16(Suppl 1):i45–i50. doi:10.1093/intqhc/mzh031
20. Committee NM-S. NOMESCO Classification of Surgical Procedures. Copenhagen: WHO Collaborating Centre for the Family of International Classifications in the Nordic Countries Norwegian Directorate of Health; 2011.
21. Baadsgaard M, Quitzau J. Danish registers on personal income and transfer payments. Scand J Public Health. 2011;39(7 Suppl):103–105. doi:10.1177/1403494811405098
22. Norredam M, Kastrup M, Helweg-Larsen K. Register-based studies on migration, ethnicity, and health. Scand J Public Health. 2011;39(7 Suppl):201–205. doi:10.1177/1403494810396561
23. Hu F, Jiang C, Shen J, Tang P, Wang Y. Preoperative predictors for mortality following hip fracture surgery: a systematic review and meta-analysis. Injury. 2012;43(6):676–685. doi:10.1016/j.injury.2011.05.017
24. Schousboe JT, Paudel ML, Taylor BC, et al. Pre-fracture individual characteristics associated with high total health care costs after hip fracture. Osteoporos Int. 201
25. Kristensen PK, Thillemann TM, Pedersen AB, Soballe K, Johnsen SP. Socioeconomic inequality in clinical outcome among hip fracture patients: a nationwide cohort study. Osteoporos Int. 2017;28(4):1233–1243. doi:10.1007/s00198-016-3853-7
26. Andersen TF, Madsen M, Jorgensen J, Mellemkjoer L, Olsen JH. The Danish national hospital register. A valuable source of data for modern health sciences. Dan Med Bull. 1999;46(3):263–268.
27. Pepe MS, Janes H, Longton G, Leisenring W, Newcomb P. Limitations of the odds ratio in gauging the performance of a diagnostic, prognostic, or screening marker. Am J Epidemiol. 2004;159(9):882–890. doi:10.1093/aje/kwh101
28. Larsen K, Petersen JH, Budtz-Jorgensen E, Endahl L. Interpreting parameters in the logistic regression model with random effects. Biometrics. 2000;56(3):909–914.
29. Larsen K, Merlo J. Appropriate assessment of neighborhood effects on individual health: integrating random and fixed effects in multilevel logistic regression. Am J Epidemiol. 2005;161(1):81–88. doi:10.1093/aje/kwi017
30. Merlo J, Chaix B, Ohlsson H, et al. A brief conceptual tutorial of multilevel analysis in social epidemiology: using measures of clustering in multilevel logistic regression to investigate contextual phenomena. J Epidemiol Community Health. 2006;60(4):290–297. doi:10.1136/jech.2004.029454
31. Goldstein H, Browne W, Rasbash J. Partitioning variation in multilevel models. Understanding Stat. 2002;1(4):223–231. doi:10.1207/S15328031US0104_02
32. StataCorp. Stata Statistical Software: Release 14. College Station. Texas: StataCorp LP; 2014.
33. Mattisson L, Bojan A, Enocson A. Epidemiology, Treatment and Mortality of Trochanteric and Subtrochanteric Hip Fractures: Data from the Swedish Fracture Register. BMC Musculoskelet Disord. 2018;19(1):369. doi:10.1186/s12891-018-2276-3
34. Sayers A, Whitehouse MR, Berstock JR, Harding KA, Kelly MB, Chesser TJ. The Association between the Day of the Week of Milestones in the Care Pathway of Patients with Hip Fracture and 30-Day Mortality: Findings from a Prospective National Registry - the National Hip Fracture Database of England and Wales. BMC Med. 2017;15(1):62. doi:10.1186/s12916-017-0825-5
35. Regionernes Kliniske Kvalitets Program. De kliniske kvalitetsdatabaser. 2015; Available from: http://www.rkkp.dk/.
36. Patel NK, Sarraf KM, Joseph S, Lee C, Middleton FR. implementing the national hip fracture database: an audit of care. Injury. 2013;44(12):1934–1939. doi:10.1016/j.injury.2013.04.012
37. Hawkes D, Baxter J, Bailey C, et al. Improving the care of patients with a hip fracture: a quality improvement report. BMJ Qual Saf. 2015;24(8):532–538. doi:10.1136/bmjqs-2014-003700
38. Kristensen PK, Thillemann TM, Soballe K, Johnsen SP. Are process performance measures associated with clinical outcomes among patients with hip fractures? A population-based cohort study. Int J Qual Health Care. 2016;28(6):698–708. doi:10.1093/intqhc/mzw093
39. Nielsen KA, Jensen NC, Jensen CM, et al. Quality of care and 30 day mortality among patients with hip fractures: a nationwide cohort study. BMC Health Serv Res. 2009;9:
40. Kristensen PK, Sogaard R, Thillemann TM, Soballe K, Johnsen SP. High Quality of Care Did Not Imply Increased Hospital Spending- Nationwide Cohort Study among Hip Fracture Patients. Int J Qual Health Care. Epub 2018 Dec 21.
41. Merlo J, Chaix B, Yang M, Lynch J, Rastam L. A brief conceptual tutorial on multilevel analysis in social epidemiology: interpreting neighbourhood differences and the effect of neighbourhood characteristics on individual health. J Epidemiol Community Health. 2005;59(12):1022–1028. doi:10.1136/jech.2004.028035
 © 2019 The Author(s). This work is published and licensed by Dove Medical Press Limited. The
full terms of this license are available at https://www.dovepress.com/terms
and incorporate the Creative Commons Attribution
- Non Commercial (unported, 3.0) License.
By accessing the work you hereby accept the Terms. Non-commercial uses of the work are permitted
without any further permission from Dove Medical Press Limited, provided the work is properly
attributed. For permission for commercial use of this work, please see paragraphs 4.2 and 5 of our Terms.
© 2019 The Author(s). This work is published and licensed by Dove Medical Press Limited. The
full terms of this license are available at https://www.dovepress.com/terms
and incorporate the Creative Commons Attribution
- Non Commercial (unported, 3.0) License.
By accessing the work you hereby accept the Terms. Non-commercial uses of the work are permitted
without any further permission from Dove Medical Press Limited, provided the work is properly
attributed. For permission for commercial use of this work, please see paragraphs 4.2 and 5 of our Terms.