Back to Journals » Clinical Epidemiology » Volume 11
Homogeneity in prediction of survival probabilities for subcategories of hipprosthesis data: the Nordic Arthroplasty Register Association, 2000–2013
Authors Bartz-Johannessen C, Furnes O ![]() , Fenstad AM
, Fenstad AM ![]() , Lie SA, Pedersen AB
, Lie SA, Pedersen AB ![]() , Overgaard S
, Overgaard S ![]() , Kärrholm J
, Kärrholm J ![]() , Malchau H
, Malchau H ![]() , Mäkelä K, Eskelinen A
, Mäkelä K, Eskelinen A ![]() , Wilkinson JM
, Wilkinson JM ![]()
Received 22 December 2018
Accepted for publication 8 April 2019
Published 10 July 2019 Volume 2019:11 Pages 519—524
DOI https://doi.org/10.2147/CLEP.S199227
Checked for plagiarism Yes
Review by Single anonymous peer review
Peer reviewer comments 3
Editor who approved publication: Professor Henrik Toft Sørensen
Christoffer Bartz-Johannessen,1 Ove Furnes,1,2 Anne Marie Fenstad,1 Stein Atle Lie,1,3 Alma Becic Pedersen,4,5 Søren Overgaard,5,6 Johan Kärrholm,7 Henrik Malchau,7–9 Keijo Mäkelä,10,11 Antti Eskelinen,11,12 Jeremy M Wilkinson13
1Norwegian Arthroplasty Register, Department of Orthopaedic Surgery, Haukeland University Hospital, Bergen, Norway; 2Department of Clinical Medicine, University of Bergen, Bergen, Norway; 3Department of Clinical Dentistry, University of Bergen, Bergen, Norway; 4Department of Clinical Epidemiology, Aarhus University Hospital, Aarhus, Denmark; 5Department of Clinical Epidemiology, Aarhus University Hospital, Aarhus, Denmark; 6Department of Orthopaedic Surgery and Traumatology Odense University Hospital and Institute of Clinical Research, University of Southern Denmark, Odense Denmark; 7Swedish Hip Arthroplasty Register, Department of Orthopaedics, Institute of Surgical Sciences, Sahlgrenska University Hospital, Gothenburg, Sweden; 8Harris Orthopaedic Laboratory, Massachusetts General Hospital, Boston, USA; 9Department of Orthopaedic Surgery, Harvard Medical School, Boston, MA, USA; 10Department of Orthopaedics and Traumatology, Turku University Hospital, Turku, Finland; 11Finnish Arthroplasty Register, Finnish Institute of Health, Helsinki, Finland; 12Department of Orthopaedics Surgery, Coxa Hospital for Joint Replacement, Tampere, Finland; 13Department of Oncology and Metabolism, University of Sheffield, Sheffield, UK
Introduction: The four countries in the Nordic Arthroplasty Register Association (NARA) share geographic proximity, culture, and ethnicity. Pooling data from different sources in order to obtain higher precision and accuracy of survival-probability estimates is appealing. Nevertheless, survival probabilities of hip replacements vary between the countries. As such, risk prediction for individual patients within countries may be problematic if data are merged. In this study, our primary question was to address when data merging for estimating prosthesis survival in subcategories of patients is advantageous for survival prediction of individual patients, and at what sample sizes this may be advised.
Methods: Patients undergoing total hip replacements for osteoarthritis between January 1, 2000 and December 31, 2013 in the four Nordic countries were studied. A total of 184,507 patients were stratified into 360 patient subcategories based on country, age-group, sex, fixation, head size, and articulation. For each patient category, we determined the sample size needed from a single country to obtain a more accurate and precise estimate of prosthesis-survival probability at 5 and 10 years compared to an estimate using data from all countries. The comparison was done using mean-square error.
Results: We found large variations in the sample size needed, ranging from 40 to 2,060 hips, before an estimate from a single Nordic country was more accurate and precise than estimates based on the NARA data.
Conclusion: Using pooled survival-probability estimates for individual risk prediction may be imprecise if there is heterogeneity in the pooled data sources. By applying mean-square error, we demonstrate that for small sample sizes, applying the larger NARA database may provide a more accurate and precise estimate; however, this effect is not consistent and varies with the characteristics of the subcategory.
Keywords: hip replacement, arthroplasty registry, merging data sets, variance, accuracy, precision
Introduction
The Nordic Arthroplasty Register Association (NARA), comprising the national arthroplasty registers of Denmark, Finland, Sweden, and Norway, has developed a combined data set with a set of harmonized outcome definitions1 The NARA data have successfully been used to predict outcomes and identify risk factors of hip and knee replacements at the population level.1,2 The four Nordic countries share geographic proximity in northern Europe. The ethnic origin in the countries is also similar, and they have similar welfare and health-service models3 Still, within orthopedics, surgical practices, hospital surgery volume, training of surgeons, prostheses in use, threshold for revision, and completeness of reporting of revisions are different.1,2,4,5 These differences may explain the heterogeneity observed in survival estimates of total hip replacements (THRs) between the countries.1,2
Pooling data from different sources in order to increase sample size and obtain higher precision and accuracy of survival-probability estimates is appealing when calculating individual risk predictions, as in risk calculators6 However, for this approach to be sensible, the different sources should have similar survival probabilities. If the survival probabilities differ, pooled estimates will not represent any of the original sources of data, and will thus have less accuracy. As such, using pooled estimates for individual risk prediction may be imprecise if there is heterogeneity in the pooled data sources. Mean-square error (MSE) is a commonly used measure that accounts for both accuracy and precision when comparing estimates7 In this study, our primary question was to address when data merging for estimating prosthesis survival in subcategories of patients is advantageous for survival prediction of individual patients, and at what sample sizes this may be advised.
Study populations
Patients with THRs from the NARA held within the common database between January 1, 2000 and December 31, 2013 were included in the study.1,2 For homogeneity of indication, only patients with osteoarthritis were included. To avoid outdated prostheses, only THR operations with frequently used contemporary cemented HR stems (Lubinus, Exeter, Charnley, MS30, CPT, Müller, and C-stem) and uncemented HR (Cone, SCP, Bimetric, Bicontact, Corail, Versys, AML, CLS, ABG, Filler, and Omnifit) brands were included.8,9 For both stems and cups, all implants used in <500 operations within a country were also removed from that country’s data set. Furthermore, all stems and cups with <95% survival probability at 10-year follow-up in any of the four countries were excluded to minimize heterogeneity due to poorly performing implants. These cutoffs were based on a UK National Institute for Health and Care Excellence guideline10 For the Finnish data, separate results for stems and cups were not available. Therefore, stems and cups with overall survival (including all revision causes) <90% were excluded from the Finnish part of the data. Metal-on-metal articulation was considered noncontemporary and thus excluded.11,12 The difference between highly cross-linked polyethylene (XLP) and polyethylene has been identified in the NARA database13 Radiation of 5 Mrad and more was classified as XLP. For patients operated on for more than one hip, only time to revision for the first registered primary operation was included. Based on the given criteria, there remained 38,042 Norwegian, 14,385 Finnish, 21,439 Danish, and 110,641 Swedish patients. Therefore, a total of 184,507 patients from the NARA data remained for analyses (Figure 1).
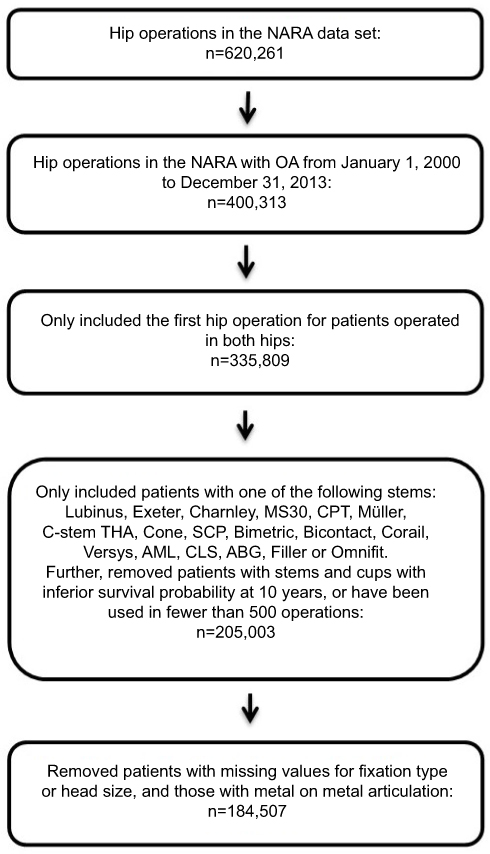 |
Figure 1 Flowchart for patients included in the study. Abbreviations: NARA, Nordic Arthroplasty Register Association; OA, osteoarthritis. |
The covariates availablefor the present analyses were: age (20–59 years, 60–74 years, 75 years and older), sex, prosthesis fixation (cemented, uncemented, hybrid, reversed hybrid), head size (<32 mm, 32 mm, >32 mm), and articulation (metal + XLP, ceramic + XLP, ceramic + ceramic, metal + polyethylene, ceramic + polyethylene). Table 1 summarizes the categories for the different variables. This categorization resulted in 360 combinations of the covariates, and thus 360 patient subcategories.
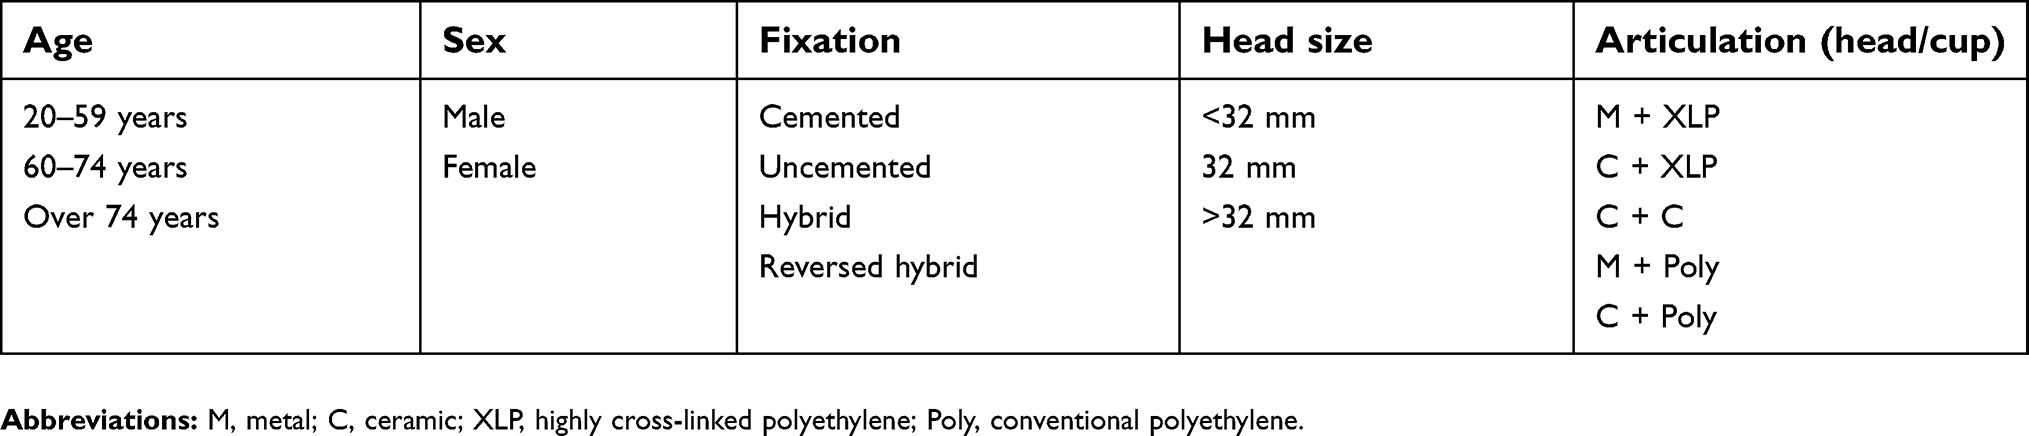 |
Table 1 Different variables for total hip replacements |
Statistical methods
We aimed to quantify at what sample size for different patient subcategories a country’s own data can be considered sufficient in survival-probability calculations for that country versus using the NARA database. For each country, we compared 5- and 10-year survival-probability estimates based on the country’s own data and estimates based on the NARA data set. The procedure was equivalent for all four countries and for the 5- and 10-years survival-probability estimates, but explained only for Norwegian data when analyzing 5-year survival-probability estimates.
Norwegian patient subcategories with >250 patients at risk at 5 years in both Norway and the NARA were included. A cut off point at 250 patients at risk has also been chosen in other studies, like Deere et al (2019).14
We chose one of these patient subcategories. The Kaplan–Meier survival-probability estimate at 5 years was calculated with the available Norwegian data in this subcategory and considered the correct Norwegian survival probability (S) for this patient subcategory.
A small sample (starting at n=20) of random Norwegian patients was drawn from the patient subcategory and the Kaplan–Meier survival-probability estimate at 5 years calculated. We named this the Norwegian estimate:  of S.
of S.
Additionally, a survival-probability estimate based on the corresponding data from the other NARA countries for the patient subcategory, including the random sample from Norway, was calculated. We named this the NARA estimate:  of S.
of S.
The latter two steps were repeated 500 times in a bootstrap-like simulation to obtain 500 Norwegian and 500 NARA estimates of S.
The MSE for the Norwegian estimate was then calculated:
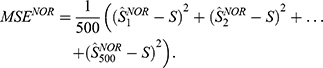
The MSE for NARA was calculated applying the same formula. MSE is defined as the variance plus the square of the bias for an estimator, and hence takes into account both the accuracy (bias) and the precision (variance) of survival-probability estimates7
MSE calculations were repeated, with sample sizes increasing by 20 at each step. The MSE for the Norwegian sample estimates will initially be large, due to low precision (large variation due to small sample). After increasing the sample size, the MSE for the Norwegian estimates will eventually be lower than the MSE for NARA, since the accuracy is less (the bias is larger) for the NARA estimates. At this point, the Norwegian estimate is preferable.
The procedure described was repeated for all Norwegian patient subcategories with >250 patients at risk at 5 years.
R version 3.4.1 was applied for all analyses (www.r-project.org).
Results
In Figure 2, the difference between the MSE for Norway and the NARA as a function of sample size (for the subcategory “female, age 60–74, cemented, head size <32 mm, and metal + conventional polyethylene) is shown. This figure shows that for approximately 1,460 patients, the curve crosses zero for this subcategory. This implies that for samples >1,460, the survival-probability estimate based on the Norwegian sample has smaller MSE than the estimate based on the NARA data. Therefore, for samples >1,460, the survival-probability estimate based on a Norwegian sample is superior with regard to precision and accuracy compared to the NARA estimate. This figure illustrates the principle for the MSE calculations performed. The same calculations were done for all patient subcategories with >250 patients at risk at 5 and 10 years, respectively (Supplementary Tables 1–7). We observed relatively large variation in the sample size needed from a single country to outperform the estimates based on the complete NARA data. The number of patients needed before the Norwegian estimates became more precise and accurate compared to estimates based on the NARA data varied from 120 to 960 at 5 years and from 140 to 2,060 at 10 years. For Denmark, the numbers were 80 and 440 at 5 years, respectively. At 10 years, there was no patient category with sufficient observations. For Finland, the numbers were 100 and 400 at 5 years and 80 and 240 at 10 years. For Sweden, the numbers were 40 and 1,880 at 5 years and 80 and 110 at 10 years (Supplementary Tables 1–7).
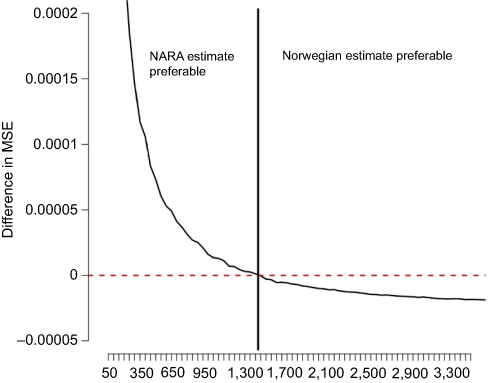 |
Figure 2 Norwegian MSE minus NARA MSE. Notes: The patient category in this figure is “60–74 years old, female, cemented, head size <32 mm, M + Poly”. The x-axis shows the sample size as explained in the “Statistical methods” section. The y-axis shows the difference in MSE. The red horizontal line is drawn at zero in order to visualize where the difference in MSE crosses zero, and hence shows at what sample size the Norwegian estimate becomes preferable with respect to the MSE.Abbreviations: MSE, mean-square error; NARA, Nordic Arthroplasty Register Association; M, metal; Poly, conventional polyethylene. |
Discussion
In the present study, we compared survival-probability estimates based on single Nordic countries versus estimates based on the common database from the NARA to determine whether amalgamation of data increase the accuracy and precision of risk estimates. Using the MSE approach, we demonstrated that for small samples applying the larger NARA database may provide a more precise and accurate estimate. This effect is however inconsistent, and varies with the characteristics of the subcategory studied.
Our approach assumes a “true” survival of a certain implant in a specific setting or in a regional hospital environment. Another important aim with the NARA initiative is that local factors, at least to a certain extent, should be “leveled out”, supposing that data in the compiled NARA database represent a more weighted assessment of a specific implant and a more global view. Further aims included studies of implants used in small numbers in solitary countries or comparatively rare outcomes in specific groups of patients. At an early stage in the NARA process, we were also interested in local variations perhaps caused by differences in hospital organization, local traditions, and possible differences in patient demography, which are highlighted in this study.
There are many examples of successful merging of data to generate overall survival estimates.5,11,15–17 Several studies have described validation and generalization of individual risk-prediction algorithms.18–25 However, there is a difference between merging data to obtain precise estimates with narrow confidence intervals and merging data from several databases for accurate and precise risk prediction of single individuals (subcategories of patients). The approach applied in this article is based on a standard statistical principle used to obtain a sample size when merging of data can be advantageous. MSE is a standard tool in statistics for comparison of estimators,7 taking both precision and accuracy into account. We argue that it is also a suitable tool for the present application.
This study has several strengths. We adjusted for individual confounders to the extent that it was possible within the NARA data set by stratifying patients into subcategories according to the known covariates age, sex, fixation, head size, and articulation to account for these covariates in the estimates. Only patients with primary osteoarthritis and contemporary prostheses with good results were included, in order to reduce heterogeneity across the study populations.
Our study also has limitations. Variables not captured within the NARA data set, including medical comorbidities, differences in perioperative management, revision thresholds, completeness of reporting, and differences in choice of prosthesis subtypes and head sizes within the three head-size categories chosen for this study, also affect individual prediction of prosthesis survivorship. When considering merging of data sets to enhance analytical power in individual-patient risk-prediction tools, it is thus important to consider the extent to which such confounders may be accounted for within the applied data sets. Further, the simulations done when calculating the MSE values is a demanding task, and this may take several hours depending on the equipment at hand.
In conclusion, using the MSE approach, we demonstrated that for small samples, applying the larger NARA database may provide a more accurate and precise estimate; however, this effect is inconsistent and varies with the characteristics of the subcategory studied.
Consent for publication
This study was approved through each national registry's own ethical process. Patients in Norway gave individual written concent to participate. In Finland and Denmark it is mandatory to participate for all hospitalized patients, and no consent is required for an approved national medical registry. In Sweden, no written consent is needed, but the patient can opt not to participate.
Ethics approval and consent to participate
Permission for the study was obtained from the Norwegian Data Protection Authority (03/00058-20/CGN). Selection and transformation of the data sets and deidentification of the patients, including deletion of national civil registration numbers, was performed within each national registry. Anonymous data were then merged into a common database, and thus individuals are not possible to identify in the NARA database. Ethical approval for the study was obtained through each national registry.
Acknowledgments
We thank all the surgeons, secretaries, and coordinators in the different Nordic countries for contributing data to the NARA database. The project was partly funded by NordForsk.
Disclosure
AE reports grants from DePuy Synthes and grants and personal fees from Zimmer Biomet outside the submitted work. The other authors report no conflicts of interest in this work.
References
1. Havelin, L.I., Fenstad A. M., Salomonsson R., et al The Nordic Arthroplasty Register Association: a unique collaboration between 3 national hip arthroplasty registries with 280,201 THRs. Acta Orthop. 2009;80(4):393–401. doi:10.3109/17453670903039544
2. Makela, K.T., Matilainen M., Pulkkinen P. et al. Countrywise results of total hip replacement. An analysis of 438,733 hips based on the Nordic Arthroplasty Register Association database. Acta Orthop. 2014;85(2):107–116. doi:10.3109/17453674.2014.893498
3. Formal Nordic Co-Operation. The Nordic Council of Ministers. Availble from: http://www.norden.org/en. Accessed May 24, 2019.
4. Glassou, E.N., Hansen T. B., Mäkelä K. et al. Association between hospital procedure volume and risk of revision after total hip arthroplasty: a population-based study within the Nordic Arthroplasty Register Association database. Osteoarthritis Cartilage. 2016;24(3):419–426. doi:10.1016/j.joca.2015.09.014
5. NARA report 2015. Nordic Arthroplasty Register Association. 2016. Availble from: https://stratum.registercentrum.se/Handlers/ResourceManager.ashx?ID=32308.
6. Paxton, E.W., Inacio M. C., Khatod M. et al. Risk calculators predict failures of knee and hip arthroplasties: findings from a large health maintenance organization. Clin Orthop Relat Res. 2015;473(12):3965–3973. doi:10.1007/s11999-015-4506-4
7. Encyclopedia of survey research methods. 2008. Availble from: http://methods.sagepub.com/base/download/ReferenceEntry/encyclopedia-of-survey-research-methods/n290.xml.
8. Hailer, N.P., Lazarinis S., Mäkelä K. T. et al. Hydroxyapatite coating does not improve uncemented stem survival after total hip arthroplasty! Acta Orthop. 2015;86(1):18–25. doi:10.3109/17453674.2014.957088
9. Junnila, M., Laaksonen I., Eskelinen A., et al. Implant survival of the most common cemented total hip devices from the Nordic Arthroplasty Register Association database. Acta Orthopaedica. 2016;87(6):546–553. doi:10.1080/17453674.2016.1222804
10. Total hip replacement and resurfacing arthroplasty for end-stage arthritis of the hip. Availble from: nice.org.uk/guidance/ta304, 2014.
11. Furnes, O., Paxton E., Cafri G., et al. Distributed analysis of hip implants using six national and regional registries: comparing metal-on-metal with metal-on-highly cross-linked polyethylene bearings in cementless total hip arthroplasty in young patients. J Bone Joint Surg Am. 2014;96(Suppl 1):25–33. doi:10.2106/JBJS.N.00459
12. Johanson, P.E., Fenstad A. M., Furnes O., et al. Inferior outcome after hip resurfacing arthroplasty than after conventional arthroplasty. Evidence from the Nordic Arthroplasty Register Association (NARA) database, 1995 to 2007. Acta Orthop. 2010;81(5):535–541. doi:10.3109/17453674.2010.525193
13. Johanson, P.E., Furnes O., Ivar Havelin L. et al. Outcome in design-specific comparisons between highly crosslinked and conventional polyethylene in total hip arthroplasty. Acta Orthop. 2017;88(4):363–369. doi:10.1080/17453674.2017.1307676
14. Deere KC, Whitehouse MR, Porter M, Blom AW, Sayers A. Assessing the non-inferiority of prosthesis constructs used in hip replacement using data from the National Joint Registry of England, Wales, Northern Ireland and the Isle of Man: a benchmarking study. BMJ Open. 2019. 9(4): p. e026685. doi:10.1136/bmjopen-2018-026685
15. Allepuz, A., Havelin L., Barber T., et al. Effect of femoral head size on metal-on-HXLPE hip arthroplasty outcome in a combined analysis of six national and regional registries. J Bone Joint Surg Am. 2014;96(Suppl 1):12–18. doi:10.2106/JBJS.N.00461
16. Lie, S.A., Pratt N., Ryan P., et al. Duration of the increase in early postoperative mortality after elective hip and knee replacement. J Bone Joint Surg Am. 2010;92(1):58–63. doi:10.2106/JBJS.H.01882
17. Makela, K.T., Matilainen M., Pulkkinen P., et al. Failure rate of cemented and uncemented total hip replacements: register study of combined Nordic database of four nations. Bmj. 2014;348:f7592. doi:10.1136/bmj.f7592
18. Alba, A.C., Agoritsas T., Jankowski M., et al. Risk prediction models for mortality in ambulatory patients with heart failure: a systematic review. Circ Heart Fail. 2013;6(5):881–889. doi:10.1161/CIRCHEARTFAILURE.112.000043
19. Echouffo-Tcheugui, J.B., Greene S. J., Papadimitriou L. et al. Population risk prediction models for incident heart failure: a systematic review. Circ Heart Fail. 2015;8(3):438–447. doi:10.1161/CIRCHEARTFAILURE.114.001896
20. Lalmohamed, A., Welsing P. M., Lems W. F., et al. Calibration of FRAX (R) 3.1 to the Dutch population with data on the epidemiology of hip fractures. Osteoporos Int. 2012;23(3):861–869. doi:10.1007/s00198-011-1852-2
21. Lehmann ED. Computerised decision-support tools in diabetes care: hurdles to implementation. Diabetes Technol Ther. 2004;6(3):422–429. doi:10.1089/152091504774198142
22. Leslie, W.D., Lix L. M., Johansson H., et al. Independent clinical validation of a Canadian FRAX tool: fracture prediction and model calibration. J Bone Miner Res. 2010;25(11):2350–2358. doi:10.1002/jbmr.123
23. Nayak, S., Edwards D. L., Saleh A. A., et al. Performance of risk assessment instruments for predicting osteoporotic fracture risk: a systematic review. Osteoporos Int. 2014;25(1):23–49. doi:10.1007/s00198-013-2504-5
24. Rochau, U., Schwarzer R., Jahn B., et al. Systematic assessment of decision-analytic models for chronic myeloid leukemia. Appl Health Econ Health Policy. 2014;12(2):103–115. doi:10.1007/s40258-013-0071-8
25. Vieta A, Badia X, Sacristan JA. A systematic review of patient-reported and economic outcomes: value to stakeholders in the decision-making process in patients with type 2 diabetes mellitus. Clin Ther. 2011;33(9):1225–1245. doi:10.1016/j.clinthera.2011.07.013
 © 2019 The Author(s). This work is published and licensed by Dove Medical Press Limited. The
full terms of this license are available at https://www.dovepress.com/terms
and incorporate the Creative Commons Attribution
- Non Commercial (unported, 3.0) License.
By accessing the work you hereby accept the Terms. Non-commercial uses of the work are permitted
without any further permission from Dove Medical Press Limited, provided the work is properly
attributed. For permission for commercial use of this work, please see paragraphs 4.2 and 5 of our Terms.
© 2019 The Author(s). This work is published and licensed by Dove Medical Press Limited. The
full terms of this license are available at https://www.dovepress.com/terms
and incorporate the Creative Commons Attribution
- Non Commercial (unported, 3.0) License.
By accessing the work you hereby accept the Terms. Non-commercial uses of the work are permitted
without any further permission from Dove Medical Press Limited, provided the work is properly
attributed. For permission for commercial use of this work, please see paragraphs 4.2 and 5 of our Terms.