Back to Journals » Clinical Ophthalmology » Volume 19
Home Tonometry Diurnal Intraocular Pressure Patterns, Patient Adherence, and Measurement Reliability in a Prospective Clinical Cohort
Authors Perkins SW ![]() , Joo JH, Allan KC, Sood S, Schulgit MJ
, Joo JH, Allan KC, Sood S, Schulgit MJ ![]() , Markakis GA, Li A
, Markakis GA, Li A
Received 6 June 2025
Accepted for publication 27 August 2025
Published 26 September 2025 Volume 2025:19 Pages 3547—3556
DOI https://doi.org/10.2147/OPTH.S545165
Checked for plagiarism Yes
Review by Single anonymous peer review
Peer reviewer comments 3
Editor who approved publication: Dr Scott Fraser
Scott W Perkins,1 Julia H Joo,1 Kevin C Allan,2 Shalini Sood,2 Matthew James Schulgit,1 George A Markakis,2 Ang Li2
1Cleveland Clinic Lerner College of Medicine, Case Western Reserve University, Cleveland, OH, USA; 2Cole Eye Institute, Cleveland Clinic, Cleveland, OH, USA
Correspondence: Scott W Perkins, Cleveland Clinic Lerner College of Medicine, Case Western Reserve University, 9500 Euclid Ave, Cleveland, OH, 44195, USA, Email [email protected]
Purpose: Assess patient adherence, diurnal intraocular pressure patterns, and correlation with in-office tonometry of home intraocular pressure monitoring (IOP).
Patients and Methods: In this prospective cohort study, 75 patients with open-angle disease (150 eyes) were recruited and loaned the iCare HOME2 tonometer (ICH2) after in-person training and instructed to take 6 measurements per day for 10 ± 4 days. Statistical analysis of adherence, diurnal IOP patterns, and correlation with in-office tonometry was conducted.
Results: Most patients had good adherence (65% of patients took ≥ 6 measurements per day, median 7.4 measurements/day). However, adherence was poor for a notable minority of patients (19% of patients took less than 2 measurements per day). Patients with low adherence reported difficulty obtaining measurements and desire for more training with the ICH2 device. ICH2 identified diurnal patterns of IOP fluctuation: IOP varied significantly over the 24-hour day (p < 0.0001), and early morning peak IOP at 3 AM decreased significantly throughout the day to minimum mean IOP at 10 PM (p < 0.0001). IOP variance was significantly greater outside of clinic hours (p < 0.0001) and 36% of patients had maximum IOP outside of clinic hours. In-office IOP measurements had significant positive correlation to the closest ICH2 measurement obtained by the patient in time for both Goldman applanation (r2 = 0.35, p < 0.0001) and iCare IC100 (r2 = 0.48, p < 0.0001).
Conclusion: ICH2 is clinically useable and effective for detecting out-of-office IOP spikes, diurnal IOP patterns, and IOP variation.
Keywords: glaucoma, home monitoring, prospective, intraocular pressure fluctuation
Introduction
High intraocular pressure (IOP) is the greatest modifiable risk factor for disease progression and vision loss in glaucoma.1 IOP is routinely measured during office visits, and reducing IOP is the only known method of slowing glaucoma progression.1–5 IOP has both intra-day and inter-day variation.6–8 Therefore, in-office IOP monitoring provides only limited IOP surveillance, missing clinically relevant peaks and fluctuations that occur outside of office hours or from day to day.9 Previous studies have found that many eyes have increased IOP mean, peak, and range during non-office hours, and out-of-office IOP can inform changes in glaucoma management.10,11 Home tonometry has promise for enabling more detailed IOP measurement by capturing such information for improved risk stratification and management.12
24-hour home monitoring of IOP by healthcare professionals is impractical in terms of logistics and healthcare resource utilization. As a result, patient-operated home tonometers have been developed and investigated for practical use. These included the first study of home tonometry with the Schiøtz tonometer in 1973,13 as well as a later device that discovered large diurnal IOP fluctuations as an independent risk factor for glaucoma progression, but did not reach widespread clinical use.14,15 More recently, the iCare HOME (iCare USA, Raleigh, NC) rebound tonometer was developed and FDA-approved for patient home self-use, enabling over 75% of trained patients to take home IOP measurements that are accurate when compared to Goldmann applanation tonometry.16–22
The iCare HOME2 (ICH2) is the second generation of iCare home tonometer, and has shown reliability in a large retrospective study.12 Small prospective studies have reported that patients are satisfied with the device,23 confirmed test-retest reliability,24 and reported good correlation with Goldman applanation tonometry (GAT),23,25 but have limited sample size and no assessment of diurnal IOP fluctuations in all 24 hours of the day. Furthermore, a large prospective study of ICH2 investigating patient adherence, diurnal IOP patterns, and correlation with in-office tonometry has previously not been undertaken. This study was conducted to examine patient adherence, diurnal IOP patterns, and correlation with in-office tonometry in a large prospective study using the ICH2 device. This work is needed to inform real-world best practices for home tonometry.
Materials and Methods
Study Design
This IRB-approved prospective study (Cleveland Clinic IRB #23-355) investigated eyes with open-angle disease and low threshold for change in treatment seen at Cleveland Clinic main campus and satellite locations in Ohio, United States of America. The study adhered to guidelines for prospective studies and good clinical practice, including the Declaration of Helinski, International Conference on Harmonization of Technical Requirements of Pharmaceuticals for Human Use E6, applicable Food and Drug Administration regulations, and the Health Insurance Portability and Accountability Act. Informed consent was obtained at study enrollment for each participant.
Study Participants
Adult patients (> 18 years old) with non-angle-closure glaucoma, ocular hypertension, or glaucoma suspect and low threshold for change in treatment were included in the study. Diagnoses were established and confirmed based on documentation in the patient’s electronic medical record. A wide range of eyes reflecting the varying disease severity and co-occurring conditions seen in routine clinical practice were recruited to best study the real-world performance of the ICH2 device. Exclusion criteria included angle closure glaucoma or patient inability to use the ICH2 device during an in-office training session. Descriptive statistics of demographics (age, sex, and race) and diagnoses of study participants were calculated.
In-Office Training Protocol
Study participants were loaned a home tonometer (iCare HOME2; ICH2) and were instructed to take 6 measurements per day for 10±4 days, aiming to obtain more data than previous studies that loaned for one week with 4 measurements per day.19,26 In-office training with the ICH2 device was administered in a one-on-one format with a study coordinator in a format similar to prior studies.16,19,26 During the training session, the study coordinator demonstrated how to take a measurement with ICH2, the participant was observed taking measurements, and the coordinator ensured that the participant was capable of independently obtaining measurements. If the participant had significant difficulty taking measurements in the opinion of the participant or coordinator, or if the total time of the training session exceeded 45 minutes, the patient was excluded from the study.
Analyzing Patterns in iCare HOME2 Utilization
Histograms of the number of measurements per patient, number of measurements per eye, days between first and last measurement, and measurements per patient per day were plotted to visualize trends in ICH2 utilization. Descriptive statistics were calculated of the same metrics. Patients with low adherence (average of < 2 measurements per day over the loan period) were surveyed via an in-person or telephone conversation to determine barriers to adherence.
Analyzing Patterns of IOP Variation
Histograms were made and descriptive statistics were calculated for mean, minimum, and maximum IOP during the home measurement period. The mean and standard deviation IOP for all patients was determined for each hour of the 24-hour day, and these data were plotted to visualize diurnal patterns of IOP fluctuation. Analysis of variance was used to assess the variation of IOP across hours in the day and t-tests were used to assess differences in IOP between individual hours in the day.
Clinic hours were defined as between 8 AM and 5 PM as in previous home tonometry studies.19 The proportion of patients with maximum IOP outside of clinic hours was calculated. IOP variance during and outside of clinic hours was compared using an F-test.27 A t-test was used to test for a difference in mean age between patients who did and did not have maximum IOP outside of clinic hours.27 A chi-square test was used to test for a difference in the proportion of males or females who had maximum IOP outside of clinic hours.27
Correlation of Home and In-Office Tonometry
To assess the correlation of home and in-office tonometry in this real-world clinical cohort and inform the real-world reliability, utility, and interpretation of home tonometry data, each patient’s in-office IOP from the last visit before and first visit after their ICH2 loan period were obtained along with the method of in-office IOP measurement. The nearest ICH2 measurement in time to each visit was then determined. In-office IOP was measured by either an attending ophthalmologist, ophthalmology resident, or certified ophthalmic technician. The correlation these in-office IOP measurements and the corresponding home measurements were then determined using linear regression and the coefficient of determination for all in-office measurement methods, Goldman applanation individually, iCare IC100 (the iCare devices typically used in clinic) individually, and Tonopen individually.28 Bland-Altman analysis was also conducted to assess agreement between methods.29 To directly compare office-based measurement to ICH2 during office hours, these values were plotted on a boxplot and descriptive statistics were calculated. While some variation between in-office and home measurements is expected due to differences in measurement time and measurement technique, this analysis is important for characterizing measurement differences as they occur in real-world use.
Results
Study Sample
150 eyes from 75 patients were enrolled in the study. Demographic and diagnosis characteristics of study participants are shown in Table 1. Participants had a mean age of 64.6 ± 13.2 years. 48% of participants were male and 52% were female. Diagnoses represented in the cohort included ocular hypertension (7% of eyes), glaucoma suspect (4%), primary open angle glaucoma (63%), normal tension glaucoma (9%), and secondary glaucoma (13%).
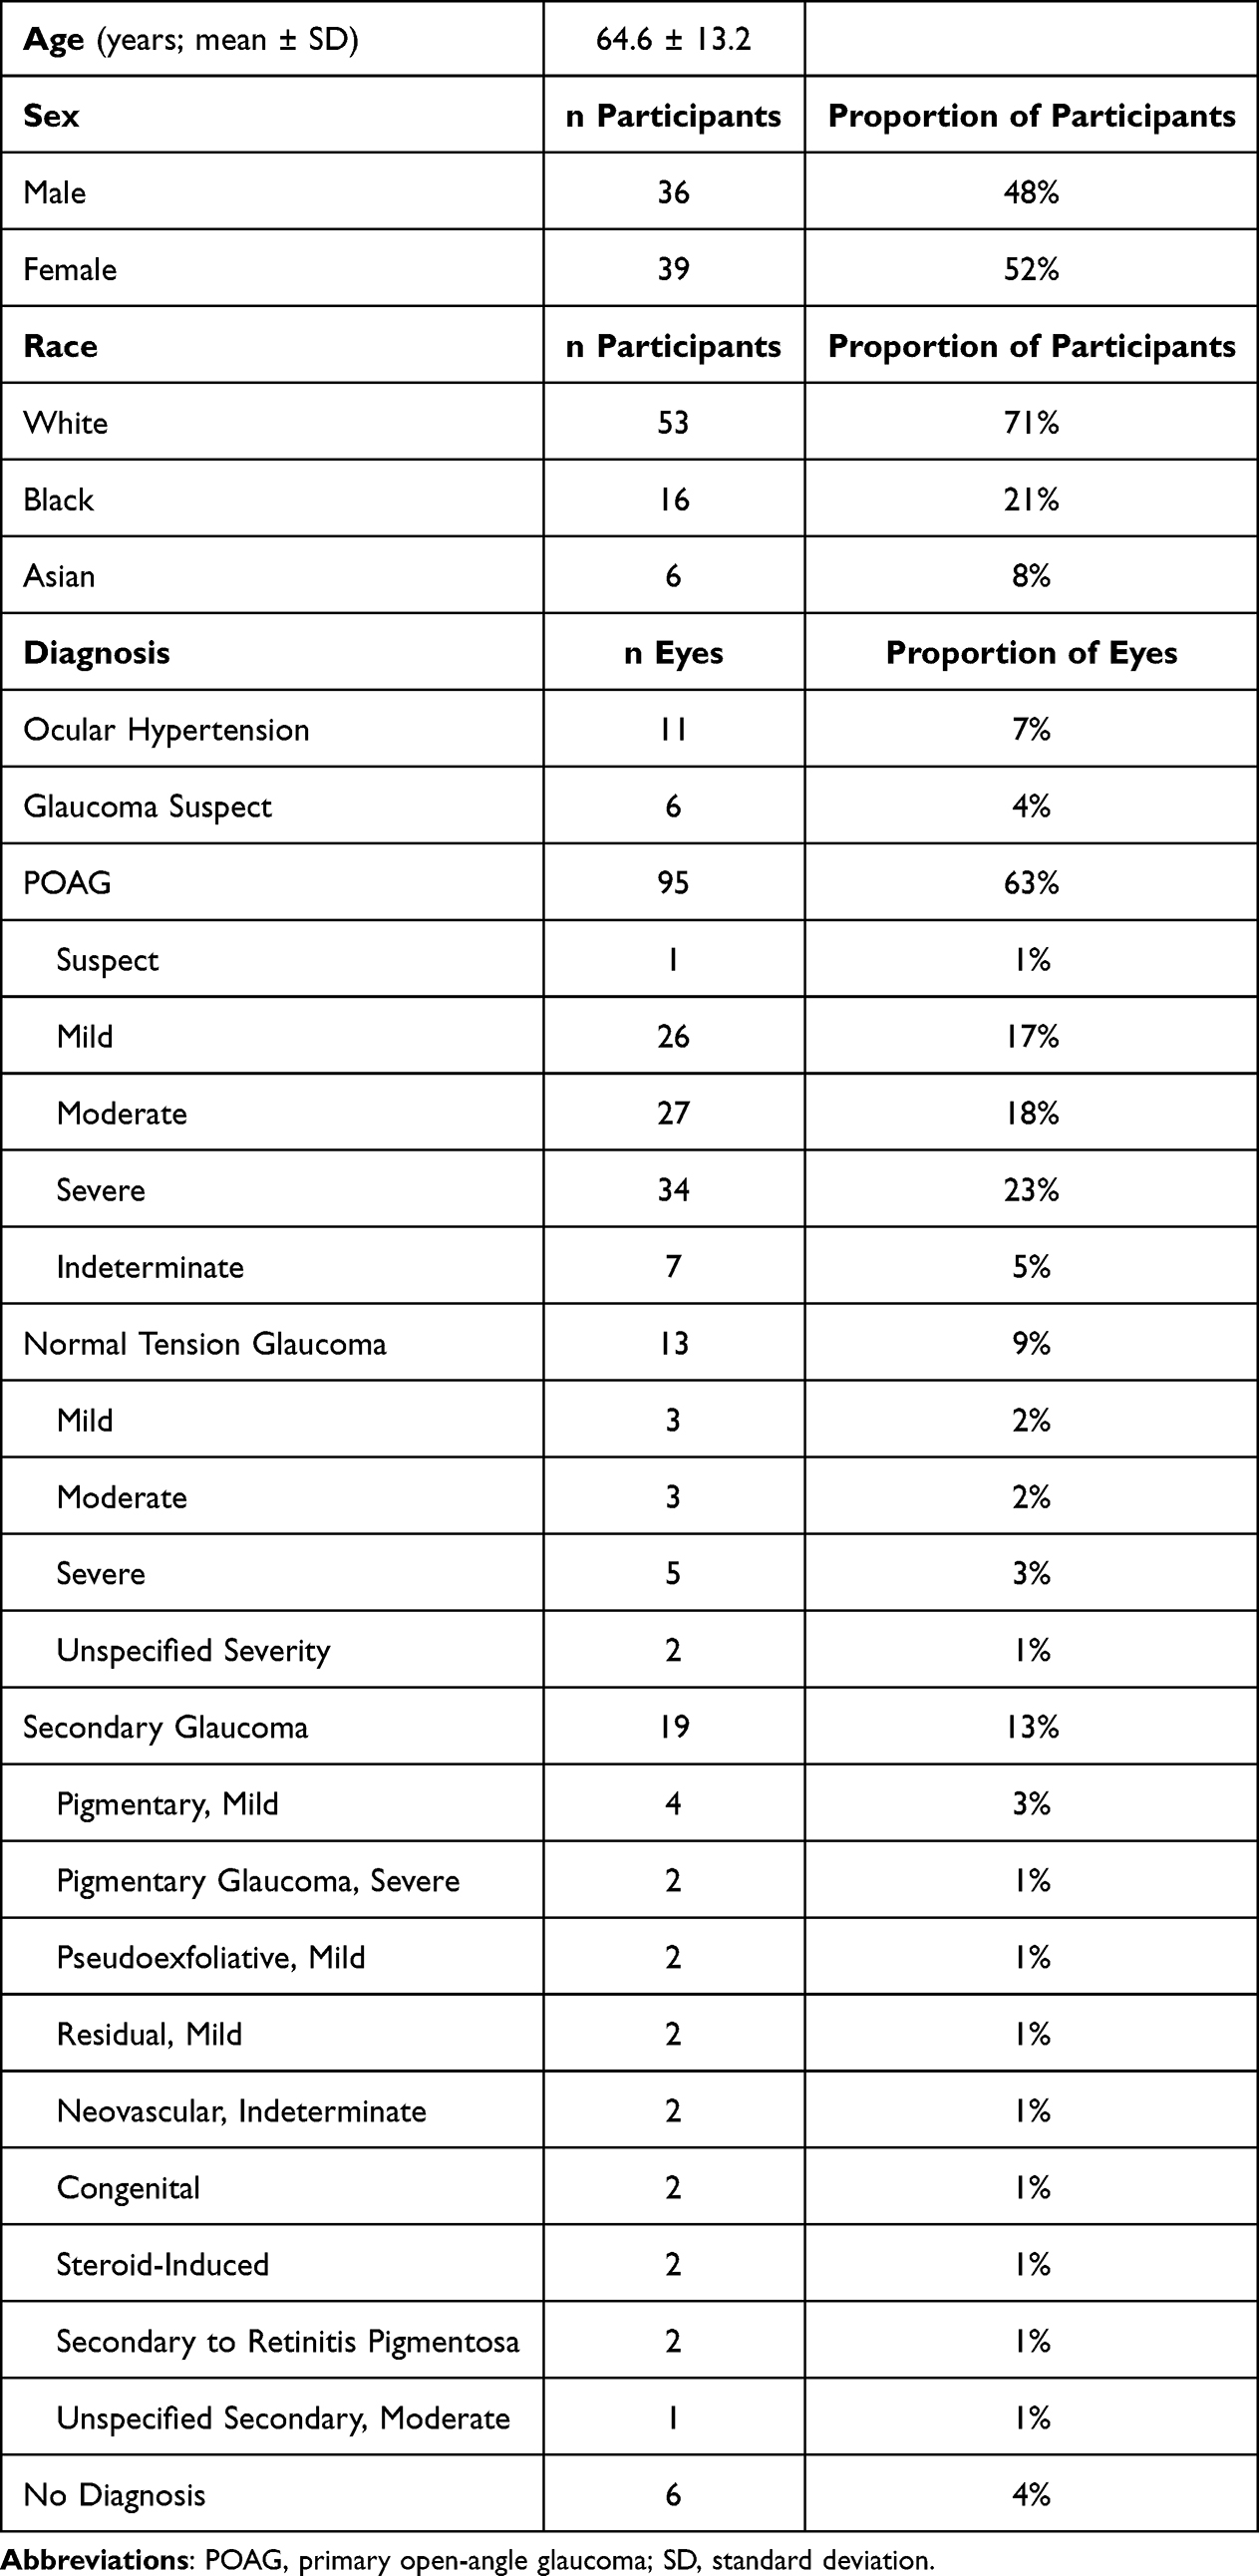 |
Table 1 Demographics and Characteristics of Study Participants |
Device Handling for Home IOP Monitoring
74 (98.7%) patients took at least one IOP measurement and 145 (96.7%) eyes were measured at least one time. The number of measurements taken per patient occurred in a bimodal pattern, with most patients taking approximately 1–25 measurements or 75–125 measurements (Figure 1A). The median number of measurements per patient was 97 with IQR equal to 98 (Table 2). The maximum number of measurements taken by a patient was 239 (Figure 1A). The number of measurements per eye was also bimodally distributed, with most eyes being measured approximately 1–10 or 45–75 times (Figure 1B). The median number of measurements per eye was 49 with IQR equal to 52 (Table 2). The maximum number of measurements per eye was 120. Patients took measurements over a mean duration of 12.9 ± 6.0 days. The longest measurement period was 30 days (Figure 1C). The average number of measurements per patient per day was bimodally distributed, with most patients taking 1–2 or 6–11 measurements per day, with an average maximum of 21.7 measurements per day (Figure 1D). The median number of measurements per day was 7.4 with IQR of 5.8 (Table 2). 65% of patients took ≥ 6 measurements per day and 19% of patients took less than 2 measurements per day (Figure 1D). Among the 14 patients with less than 2 measurements per day, 6 were able to be contacted for a survey of barriers to adherence. All 6 surveyed patients reported difficulty obtaining measurements as the barrier to adherence. 2 reported difficulty due to poor central vision and 2 reported a desire for more training to improve ease of measurement.
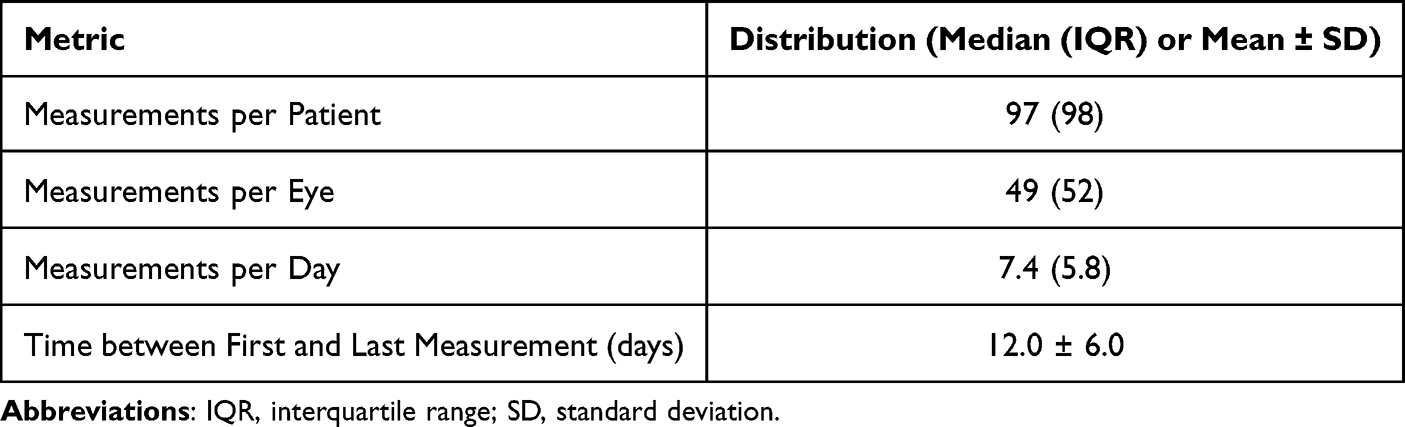 |
Table 2 Center and Spread of Home IOP Measurement Patterns. Normally Distributed Metrics are Presented as Mean ± SD. Non-Normally Distributed Metrics are Presented as Median (IQR) |
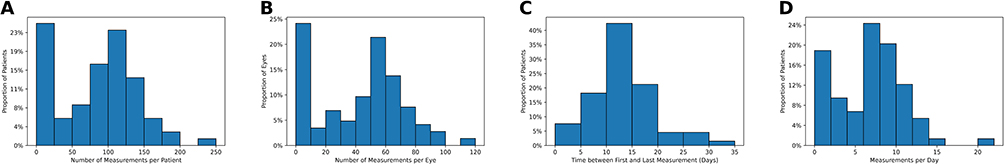 |
Figure 1 Home IOP measurement patterns of patients who took at least one measurement. Number of measurements taken by each patient (A), number of measurements per eye (B) and measurements per day (D) during the study period follow bimodal distributions. Time between first and last measurement (C) follows an approximately normal distribution. |
Patient-Level Patterns of Intraocular Pressure Measured by Home Tonometry
Mean IOP for all patients during the measurement period was 17.3 ± 4.8 mm Hg (Figure 2A, Table 3). The mean maximum IOP was 23.9 ± 7.5 mm Hg (Figure 2B and Table 3). The mean minimum IOP had right-skewed distribution with a median of 11.0 and an IQR of 6.0 mm Hg (Figure 2C and Table 3).
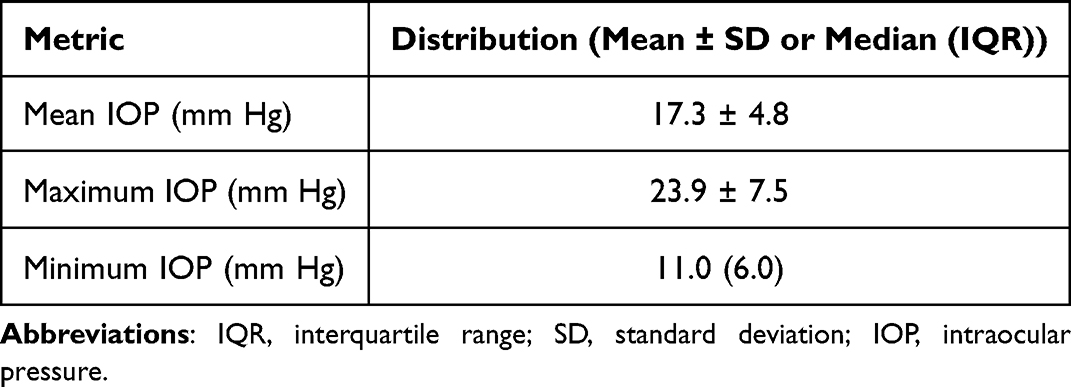 |
Table 3 Center and Spread of Patient-Level Mean, Maximum, and Minimum IOP Measured by Home Tonometry. Normally Distributed Metrics are Presented as Mean ± SD. Non-Normally Distributed Metrics are Presented as Median (IQR) |
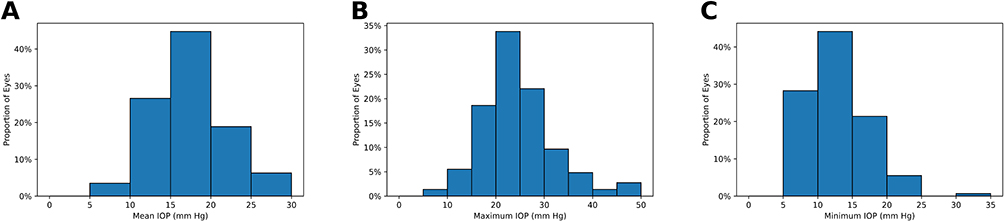 |
Figure 2 Distribution of patient-level mean (A), maximum (B), and minimum (C) IOP measured by home tonometry. |
Diurnal IOP Fluctuations Measured by Home Tonometry
54 eyes (36%) had maximum IOP outside of clinic hours. No significant association was found between age (p = 0.71) or sex (p = 0.31) and likelihood of having maximum IOP outside of clinic hours. Significant IOP variation occurred across all 24 hours of the day (p < 0.0001). An early morning average IOP peak was observed at 3 AM (22.2 ± 4.1 mm Hg), which decreased significantly (p < 0.0001) throughout the day to a minimum mean IOP at 10 PM (14.1 ± 4.2 mm Hg) (Figure 3).
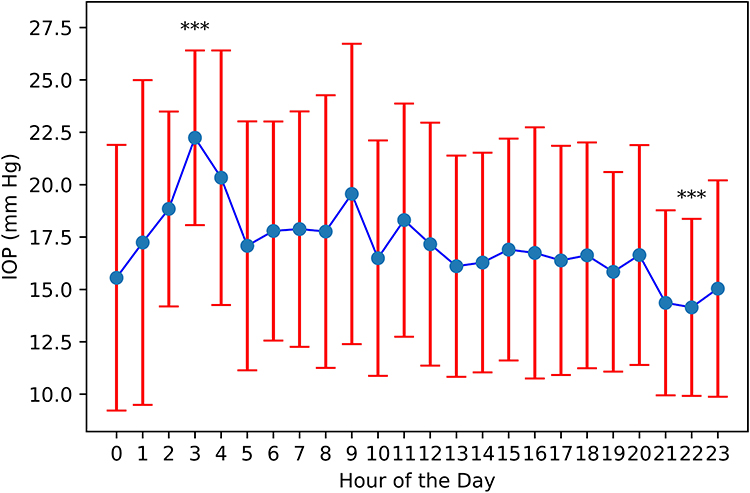 |
Figure 3 Diurnal IOP variation measured by home tonometry. ***Significantly different mean IOP (p < 0.0001) when comparing values at the hour of the diurnal early morning maximum mean IOP to the hour of the late-day minimum mean IOP. Blue dots represent mean IOP for measurements obtained in each hour of the day. Red bars represent ± one standard deviation. |
Correlation of In-Office and Home Tonometry
In-office and home tonometry measurements showed a significant positive linear relationship (p < 0.0001), with 34% of the variability in home tonometry being explained by variation in in-office tonometry across all in-office measurement methods (Figure 4A). Applanation (r2 = 0.35) and iCare IC100 (r2 = 0.48) had the strongest correlation between in-office and home IOP measurements, while the analysis of Tonopen measurements was limited by sample size (Figure 4B–D). Bland-Altman analysis showed no significant over- or under-estimation when comparing methods (Figure 5) In-office tonometry and home tonometry measurements during office hours had similar median and IQR—15 (6) and 16 (7) respectively—while home tonometry had several outlying high IOPs that were not present on in-office tonometry (Figure 6).
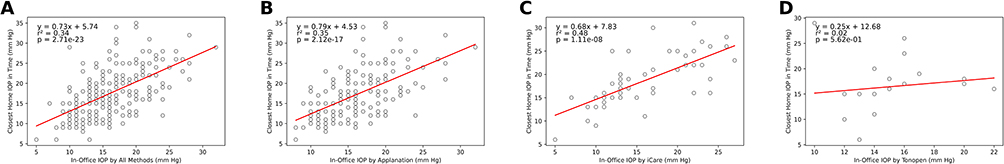 |
Figure 4 Regression analysis of in-office IOP by all methods (A), applanation (B), iCare (C) and tonopen (D) and closest home IOP in time. Axis labels indicate method of in-office IOP measurement compared to iCare HOME2. |
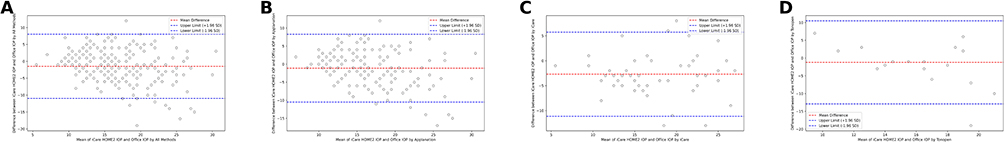 |
Figure 5 Bland-Altman analysis of in-office IOP by all methods (A), applanation (B), iCare (C), and tonopen (D) and closest home IOP in time. Axis labels indicate method of in-office IOP measurement compared to iCare HOME2. |
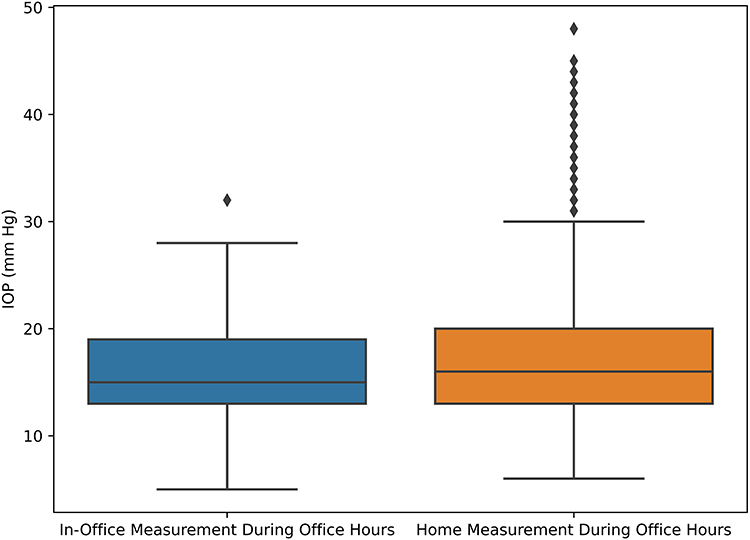 |
Figure 6 Distribution of home IOP measurements obtained between 8 AM and 5 PM (office hours) compared to in-office IOP measurements obtained during the same hours. Home and in-office IOP measurements have similar median values, but home IOP measurements show more outlying high values. |
Discussion
This is the first large prospective cohort study to investigate patterns of patient adherence, diurnal IOP fluctuation, and correlation with in-office tonometry using the ICH2 device, in contrast to previous studies that were either retrospective, had small sample sizes, or investigated older devices. This study found a bimodal distribution of patient adherence to home tonometry, showed good agreement between home tonometry and in-office measurement methods, and showed the ability of the ICH2 to characterize out-of-office IOP peaks, variation, and diurnal fluctuations. While home tonometry has been investigated since the 1970s, it has not reached widespread clinical use. Therefore, such prospective data with the latest home tonometer technology are needed to inform real-world best practice.
This study reveals patterns in patient adherence that could be used to optimize home tonometry adoption. Patients demonstrated a bimodal distribution of measurements per patient, measurements per eye, and measurements per day. The good adherence of many patients and results of the barriers to adherence survey suggest that home tonometry can be well-adopted by patients after a brief training session, and that the smaller but notable number of patients with poor adherence could be helped through increased training, barring limiting conditions such as poor central vision. Such intervention could improve overall quality of IOP monitoring and glaucoma management at the population level as improving adherence decreases the risk of developing severe glaucoma. Beyond improving adherence, further training and addressing specific patient concerns could improve the accuracy and consistency of IOP readings obtained by home tonometry. This study builds on prior investigations that found that patients had a positive impression of home tonometry, but that did not investigate the distribution of adherence patterns as the present study did.18,20,23
This work also demonstrates the ability of ICH2 to detect significant diurnal IOP patterns, informing the utility of ICH2 for monitoring diurnal IOP fluctuation in real-world clinical practice. These patterns are consistent with other diurnal patterns observed in the literature: the 3 AM maximum and 10 PM minimum mean IOP observed in this study are similar to those observed at 3:30 AM and 9:30 PM, respectively, by Liu et al7,30 While other studies found peaks later in the morning, they did not always measure IOP in the early hours of the morning.9 A strength of this study is inclusion of data from all 24 hours of the day. As glaucoma medications differ in their ability to modulate diurnal versus nocturnal IOP, the robust monitoring of diurnal IOP could be increasingly important for standard-of-care glaucoma management in the future.8 Besides implications for management, future work should also focus on determining factors underlying these diurnal patterns including differences in diurnal patterns between measurement methods due to factors such as corneal biomechanics.31
In addition to diurnal IOP patterns, ICH2 also detected increased IOP variance outside of clinic hours. As diurnal IOP fluctuation is an independent risk factor for glaucoma progression, these results suggest that ICH2 could play an important role in diurnal IOP variability quantification, progression risk stratification, and management decision support in routine clinical practice.15 IOP variation was also measured in terms of peak IOP, finding that 36% of eyes had maximum IOP outside of clinical hours. This agrees with previous studies finding that 44% of patients has higher home-tonometry maximum IOP than clinic-measured IOP.19 However, no association was found between age or sex and out-of-office maximum IOP. This is in contrast to a previous study which found that younger age and male sex increased risk of higher home IOP, although the authors acknowledged that the mechanisms and reproducibility of these findings were unclear.19,32 As IOP variance is a risk factor for glaucoma progression, these results have relevance for clinical use of IOP variance as measured by home tonometry to inform management decisions.
The results of ICH2 correlation with in-office IOP measurement reinforce previous findings that ICH2 is in good agreement with in-office tonometry. The decreased r2 values in this study compared to previous back-to-back comparisons of applanation tonometry with ICH2 (r2 = 0.88 by Kratz et al12 and 0.98 by Kuo and Rahimy25) are expected as the home and in-office measurements were not taken in a back-to-back fashion in this study. Nevertheless, the significant (p < 0.0001) correlation demonstrates the ability of ICH2 to identify patients with generally higher versus lower IOP in a manner that correlates with in-office IOP.
The number of high outlying IOP pressures identified by home tonometry during business hours compared to in-office IOP is also notable (Figure 6). As ICH2 has previously shown test-retest reliability24 and good correlation with in-office tonometry,12,23,25 it is unlikely that these are the result of instrument error. Rather, it is likely that ICH2 detects IOP spikes occurring at home due to routine daily activities,33 yoga,34 or vigorous exercise35 compared to in-office IOP measurements taken in a sedentary clinic environment.
This study has several strengths and important limitations. Strengths include a large prospective clinical cohort design representing a clinical cross-section of disease types, investigation of IOP across a large range of time outside of office hours, and investigation of the distribution of ICH2 adherence beyond simply mean and standard deviation number of measurements. Additionally, to avoid over-burdening clinicians with many outside-of-clinic-hours messages, patients were not able to see their ICH2 IOP values on-device, instead discussing their results with the physician at their next office visit. Limitations include that not all diseases were equally represented and IOP was only measured during one loan period without intervention. These are important opportunities for further investigation. Future studies should include investigating the impact of adherence interventions for patients with low baseline ICH2 adherence, as well as the impact of ICH2-dected IOP patterns on management decisions and disease progression, particularly in patients who have unclear indication for further intervention as was previously suggested in a case series by Levin et al.36
Conclusion
Overall, this study demonstrates that home tonometry shows a more complete IOP profile of a patient compared to in-office tonometry, detecting risk factors that could inform management decisions. This study showed detection of diurnal IOP patterns, increased IOP variance outside of clinic hours, and maximum IOP outside of clinic hours for over one-third of patients with the ICH2 device. Good adoption of the ICH2 device was observed for most patients, with low adaptation in a notable minority that shows potential for targeted intervention. This investigation also added real-world prospective data to previous literature demonstrating the correlation of ICH2 with in-office IOP measurements. Overall, these findings reinforce the utility of ICH2 for comprehensive, reliable, and practical IOP monitoring, with potential future applications for improved clinical risk stratification and management decision support.
Ethics
This study was approved by the Cleveland Clinic Institutional Review Board (number 23-355).
Acknowledgments
The authors acknowledge Dusica Vasic for assistance with study coordination.
Author Contributions
All authors made a significant contribution to the work reported, whether that is in the conception, study design, execution, acquisition of data, analysis and interpretation, or in all these areas; took part in drafting, revising or critically reviewing the article; gave final approval of the version to be published; have agreed on the journal to which the article has been submitted; and agree to be accountable for all aspects of the work.
Funding
This study was funded by an internal Cleveland Clinic research grant (RPC).
Disclosure
AL: Consultant: New World Medical, Abbvie, Nova Eye; Research funding: Nova Eye. The authors report no other conflicts of interest or competing interests in this work.
References
1. Coleman AL, Miglior S. Risk factors for glaucoma onset and progression. Surv Ophthalmol. 2008;53(6, Supplement):S3–S10. doi:10.1016/j.survophthal.2008.08.006
2. Kass MA. The ocular hypertension treatment study: a randomized trial determines that topical ocular hypotensive medication delays or prevents the onset of primary open-angle glaucoma. Arch Ophthalmol. 2002;120(6):701. doi:10.1001/archopht.120.6.701
3. Heijl A. Reduction of intraocular pressure and glaucoma progression: results from the early manifest glaucoma trial. Arch Ophthalmol. 2002;120(10):1268. doi:10.1001/archopht.120.10.1268
4. Group CN. The effectiveness of intraocular pressure reduction in the treatment of normal-tension glaucoma. Collaborative normal-tension glaucoma study group. Am J Ophthalmol. 1998;126(4):498–505. doi:10.1016/s0002-9394(98)00272-4
5. The AGIS Investigators. The Advanced Glaucoma Intervention Study (AGIS): 7. The relationship between control of intraocular pressure and visual field deterioration. Am J Ophthalmol. 2000;130(4):429–440. doi:10.1016/s0002-9394(00)00538-9
6. David R, Zangwill L, Briscoe D, Dagan M, Yagev R, Yassur Y. Diurnal intraocular pressure variations: an analysis of 690 diurnal curves. Br J Ophthalmol. 1992;76(5):280–283. doi:10.1136/bjo.76.5.280
7. Liu JHK, Zhang X, Kripke DF, Weinreb RN. Twenty-four-hour intraocular pressure pattern associated with early glaucomatous changes. Invest Ophthalmol Vis Sci. 2003;44(4):1586–1590. doi:10.1167/iovs.02-0666
8. Bagga H, Liu JHK, Weinreb RN. Intraocular pressure measurements throughout the 24 h. Curr Opin Ophthalmol. 2009;20(2):79–83. doi:10.1097/ICU.0b013e32831eef4f
9. Huang J, Katalinic P, Kalloniatis M, Hennessy MP, Zangerl B. Diurnal intraocular pressure fluctuations with self-tonometry in glaucoma patients and suspects: a clinical trial. Optometry Vision Sci. 2018;95(2):88. doi:10.1097/OPX.0000000000001172
10. Barkana Y. Clinical utility of intraocular pressure monitoring outside of normal office hours in patients with glaucoma. Arch Ophthalmol. 2006;124(6):793. doi:10.1001/archopht.124.6.793
11. Hughes E, Spry P, Diamond J. 24-hour monitoring of intraocular pressure in glaucoma management: a retrospective review. J Glaucoma. 2003;12(3):232–236. doi:10.1097/00061198-200306000-00009
12. Kratz A, Zbidat R, Kishner R, Cohen M, Shalata W, Goldberg I. Assessment of the iCare HOME2, a new intraocular pressure self-measurement tonometer. J Glaucoma. 2023;32(11):926. doi:10.1097/IJG.0000000000002298
13. Jensen AD, Maumenee AE. Home Tonometry. Am J Ophthalmol. 1973;76(6):929–932. doi:10.1016/0002-9394(73)90084-6
14. Zeimer RC, Wilensky JT, Gieser DK, Mori MM, Baker JP. Evaluation of a self tonometer for home use. Arch Ophthalmol. 1983;101(11):1791–1793. doi:10.1001/archopht.1983.01040020793027
15. Asrani S, Zeimer R, Wilensky J, Gieser D, Vitale S, Lindenmuth K. Large diurnal fluctuations in intraocular pressure are an independent risk factor in patients with glaucoma. J Glaucoma. 2000;9(2):134–142. doi:10.1097/00061198-200004000-00002
16. Mudie LI, LaBarre S, Varadaraj V, et al. The icare HOME (TA022) study: performance of an intraocular pressure measuring device for self-tonometry by glaucoma patients. Ophthalmology. 2016;123(8):1675–1684. doi:10.1016/j.ophtha.2016.04.044
17. Takagi D, Sawada A, Yamamoto T. Evaluation of a new rebound self-tonometer, icare HOME: comparison with goldmann applanation tonometer. J Glaucoma. 2017;26(7):613–618. doi:10.1097/IJG.0000000000000674
18. Pronin S, Brown L, Megaw R, Tatham AJ. Measurement of intraocular pressure by patients with glaucoma. JAMA Ophthalmol. 2017;135(10):1030. doi:10.1001/jamaophthalmol.2017.3151
19. McGlumphy EJ, Mihailovic A, Ramulu PY, Johnson TV. Home self-tonometry trials compared with clinic tonometry in patients with glaucoma. Ophthalmol Glaucoma. 2021;4(6):569–580. doi:10.1016/j.ogla.2021.03.017
20. Thaprawat P, Dugan S, Zhang A. Patient perspectives on home tonometer usage for glaucoma. OPTH. 2025;Volume 19:199–207. doi:10.2147/OPTH.S501234
21. Berneshawi AR, Shue A, Chang RT. Glaucoma home self-testing using VR visual fields and rebound tonometry versus in-clinic perimetry and goldmann applanation tonometry: a pilot study. Trans Vision Sci Technol. 2024;13(8):7. doi:10.1167/tvst.13.8.7
22. Quérat L, Chen E. iCare® home vs goldmann applanation tonometry: agreement of methods and comparison of inter-observer variation at a tertiary eye centre. Eur J Ophthalmol. 2023;33(1):312–318. doi:10.1177/11206721221099252
23. Quérat L, Chen E. Self‐monitoring of the intraocular pressure with ICARE® HOME2 and a smartphone application: feasibility and acceptability. Acta Ophthalmologica. 2025;103(1):109–114. doi:10.1111/aos.16789
24. Realini T, Halenda K, Palko J, McMillan B, Balasubramani GK. Test-retest reliability of intraocular pressure measurements with office-based versus home-based rebound tonometers. J Glaucoma. 2024;33(10):758–762. doi:10.1097/IJG.0000000000002441
25. Kuo DS, Rahimy E. Agreement of SERIAL iCare HOME2 and goldmann applanation tonometry. Ophthalmol Glaucoma. 2024;7(5):440–444. doi:10.1016/j.ogla.2024.04.007
26. Scott AT, Kanaster K, Kaizer AM, et al. The utility of iCare HOME tonometry for detection of therapy-related intraocular pressure changes in glaucoma and ocular hypertension. Ophthalmol Glaucoma. 2022;5(1):85–93. doi:10.1016/j.ogla.2021.05.007
27. Snedecor GW, Cochran WG, Cochran WG. Statistical Methods.
28. Su X, Yan X, Tsai C. Linear regression. WIREs Computational Stats. 2012;4(3):275–294. doi:10.1002/wics.1198
29. Martin Bland J, Altman Douglas G. Statistical methods for assessing agreement between two methods of clinical measurement. Lancet. 1986;327(8476):307–310. doi:10.1016/S0140-6736(86)90837-8
30. Liu JHK, Mansouri K, Weinreb RN. Estimation of 24-hour intraocular pressure peak timing and variation using a contact lens sensor. PLoS One. 2015;10(6):e0129529. doi:10.1371/journal.pone.0129529
31. Kida T, Liu JHK, Weinreb RN. Effects of aging on corneal biomechanical properties and their impact on 24-hour measurement of intraocular pressure. Am J Ophthalmol. 2008;146(4):567–572.e1. doi:10.1016/j.ajo.2008.05.026
32. Rochtchina E, Mitchell P, Wang JJ. Relationship between age and intraocular pressure: the blue mountains eye study. Clin Exper Ophthalmol. 2002;30(3):173–175. doi:10.1046/j.1442-9071.2002.00519.x
33. Baser G, Karahan E, Bilgin S, Unsal U. Evaluation of the effect of daily activities on intraocular pressure in healthy people: is the 20 mmHg border safe? Int Ophthalmol. 2018;38(5):1963–1967. doi:10.1007/s10792-017-0684-2
34. Shajiei TD, Wachtl J, Schuknecht A, Bachmann L, Kniestedt C. The effect of yoga on intraocular pressure using the “iCare HOME2” tonometer. Klin Monbl Augenheilkd. 2024;241(04):347–354. doi:10.1055/a-2200-3970
35. Gildea D, Doyle A, O’Connor J. The effect of exercise on intraocular pressure and glaucoma. J Glaucoma. 2024;33(6):381–386. doi:10.1097/IJG.0000000000002411
36. Levin AM, McGlumphy EJ, Chaya CJ, Wirostko BM, Johnson TV. The utility of home tonometry for peri-interventional decision-making in glaucoma surgery: case series. Am J Ophthalmol Case Rep. 2022;28:101689. doi:10.1016/j.ajoc.2022.101689
 © 2025 The Author(s). This work is published and licensed by Dove Medical Press Limited. The
full terms of this license are available at https://www.dovepress.com/terms
and incorporate the Creative Commons Attribution
- Non Commercial (unported, 4.0) License.
By accessing the work you hereby accept the Terms. Non-commercial uses of the work are permitted
without any further permission from Dove Medical Press Limited, provided the work is properly
attributed. For permission for commercial use of this work, please see paragraphs 4.2 and 5 of our Terms.
© 2025 The Author(s). This work is published and licensed by Dove Medical Press Limited. The
full terms of this license are available at https://www.dovepress.com/terms
and incorporate the Creative Commons Attribution
- Non Commercial (unported, 4.0) License.
By accessing the work you hereby accept the Terms. Non-commercial uses of the work are permitted
without any further permission from Dove Medical Press Limited, provided the work is properly
attributed. For permission for commercial use of this work, please see paragraphs 4.2 and 5 of our Terms.
Recommended articles
Effect of Hemodialysis on Glaucoma Patients
Hendricks TM, Quist TS, Wang K, Antes LM, Boese EA
Clinical Ophthalmology 2025, 19:827-834
Published Date: 12 March 2025