Back to Journals » Clinical Ophthalmology » Volume 20
Home-Based Visual Field Monitoring for Open-Angle Glaucoma Using a Web-Enabled Quantitative Perimeter (Perimouse): An Evaluation Over Six Months
Authors Shen X, Chen Z, Yang W, Wang M, Tan K ![]() , Fan Y, Liu P, Ye J, Ouyang Z, Zheng G, Yang Y, Yu M
, Fan Y, Liu P, Ye J, Ouyang Z, Zheng G, Yang Y, Yu M
Received 17 November 2025
Accepted for publication 27 January 2026
Published 2 February 2026 Volume 2026:20 582204
DOI https://doi.org/10.2147/OPTH.S582204
Checked for plagiarism Yes
Review by Single anonymous peer review
Peer reviewer comments 3
Editor who approved publication: Dr Scott Fraser
Xiaoyuan Shen,1,* Zidong Chen,1,* Wenxin Yang,1 Mingqin Wang,1 Kaixin Tan,1 Yanmei Fan,1 Pingping Liu,1 Jiexin Ye,2 Zhiqiang Ouyang,2 Guifeng Zheng,2 Yangfan Yang,1 Minbin Yu1
1State Key Laboratory of Ophthalmology, Zhongshan Ophthalmic Center, Sun Yat-Sen University, Guangdong Provincial Key Laboratory of Ophthalmology and Visual Science, Guangdong Provincial Clinical Research Center for Ocular Diseases, Guangzhou, People’s Republic of China; 2School of Computer Science and Engineering, Sun Yat-sen University, Guangzhou, People’s Republic of China
*These authors contributed equally to this work
Correspondence: Minbin Yu, State Key Laboratory of Ophthalmology, Zhongshan Ophthalmic Center, Sun Yat-sen University, Guangdong Provincial Key Laboratory of Ophthalmology and Visual Science, Guangdong Provincial Clinical Research Center for Ocular Diseases, Guangzhou, People’s Republic of China, Tel +8620 6661 5460, Fax +8620 3761 9853, Email [email protected]
Purpose: To assess the reliability and acceptability of home-based visual field monitoring in glaucoma patients using a self-developed online perimeter (Perimouse).
Patients and Methods: In this prospective study, patients with stable open-angle glaucoma conducted monthly remote visual field tests using the Perimouse threshold program in an unsupervised home setting over six months, with Humphrey Field Analyzer (HFA) tests performed before and after the trial. The study evaluated patient compliance with Perimouse and compared its stability and variability to HFA. Additionally, a questionnaire assessed patient acceptability of Perimouse.
Results: Sixty glaucoma patients (97 eyes) participated in this study. The follow-up completion rate of home tests remained 67.01% in the sixth month despite a gradual decline over time. A pointwise analysis demonstrated overall consistency, although variability increased as sensitivity decreased. Bland–Altman analysis of Perimouse mean deviation (MD) showed that the mean differences between Month 1 and Months 2– 6 were close to zero. The mean absolute error for Perimouse MD ranged from 0.71 to 1.04, compared to 0.55 for HFA. Perimouse test duration decreased over six months, from 10.04 ± 2.74 minutes to 8.31 ± 2.77 minutes. The questionnaire indicated that Perimouse scoring higher than HFA in stress relief, visual comfort, and cost-effectiveness (P< 0.05).
Conclusion: This study showed that participants could perform Perimouse remotely in an unsupervised setting with video and written instructions. Perimouse may support home-based visual field monitoring and enhance self-management for glaucoma patients.
Keywords: telemedicine, remote patient monitoring, glaucoma, visual field tests
Introduction
Glaucoma is a chronic, progressive optic neuropathy characterized by damage to the optic nerve and the retinal nerve fiber layer, often leading to irreversible loss of peripheral or central vision.1 Timely intervention is crucial to prevent permanent damage. Early detection and prompt treatment are essential for minimizing vision loss. Visual field testing is vital for monitoring disease progression, as it establishes a baseline and detects disease progression in visual function over time. This enables timely adjustments to treatment strategies.1–3 According to the European Glaucoma Society (EGS) guidelines, at least six VF tests are recommended within the first two years following diagnosis.4 This proposed practice is essential for preventing irreversible damage and maintaining patients’ quality of life, while also offering health economic benefits by enhancing monitoring for newly diagnosed patients.5 However, in less-developed regions, the allocation of medical resources remains inadequate, with standard automated perimeters (SAP) not widely available, limiting the standardization of glaucoma diagnosis and treatment.6
Health service delivery for glaucoma presents significant challenges due to the large number of diagnosed patients requiring lifelong periodic monitoring by hospital eye services.5 What’s more, loss to follow-up and delays in care are common issues in chronic diseases, particularly when irreversible progression occurs before symptoms manifest, like glaucoma.7 Given these challenges, telemedicine plays a crucial role in promoting remote patient monitoring for individuals with chronic condition.8 Moreover, the use of telehealth interventions may improve medication adherence, facilitate outpatient follow-up, and support self-management.9,10 As a key branch of telemedicine, teleophthalmology has experienced rapid growth recently, demonstrating significant potential in subspecialty ophthalmic care. It is anticipated to advance healthcare services and contribute to reducing societal costs.11,12 Among its key applications, teleglaucoma could offer remote solutions for glaucoma early detection and management.13,14
Remote technologies such as tonometry, perimetry, and fundus photography are evolving to offer more accessible and patient-centered care models.15 These tools may facilitate continuous monitoring of glaucoma progression without the need for frequent in-person visits, potentially providing a more convenient and efficient way to manage the disease while ensuring timely intervention when necessary. Building on this, we developed Perimouse, a portable perimeter that is free-to-use and internet-based for remote visual field testing on personal computers (PC). Perimouse’s test gird simulated the HFA 24–2 pattern, with the positioning of adjacent points personalized based on the participant’s physiological blind spot. Compared to SAP, Perimouse adopts a fixation alteration strategy, eliminating the need for a fixed central fixation. Perimouse measures visual field sensitivity by having subjects locate random screen stimuli with a mouse, using the left and right buttons to indicate detection or non-detection. Perimouse has both threshold and suprathreshold screening programs to accommodate various testing requirements. In our previous work, we demonstrated its feasibility, reliability, and consistency with SAP. It showed a moderate to strong correlation with HFA in both suprathreshold and threshold programs, confirming its potential for remote patient monitoring.16
To further validate whether participants can accurately and consistently use this tool remotely in a home environment, this real-world study conducted a six-month follow-up with glaucoma patients and assessed patient acceptability through a questionnaire survey.
Material and Methods
Study Design and Participants
This prospective observational study was conducted at Zhongshan Ophthalmic Center, Sun Yat-sen University, from December 1, 2022, to December 1, 2023. Ethics approval was obtained from the ethics committee of the Zhongshan Ophthalmic Center (No. 2023KYPJ119). The study adhered to the principles in the Declaration of Helsinki.
Inclusion criteria included participants aged 18 years or older, diagnosed with primary open angle glaucoma (POAG), including normal tension glaucoma (NTG), with stable visual fields, defined by at least three reliable Humphrey Field Analyzer (HFA) Swedish Interactive Threshold Algorithm (SITA) 30–2 tests showing no significant progression. Additional criteria included a best-corrected visual acuity (BCVA) of 0.1 or better, normal colour vision, and open angles on gonioscopy. Typical glaucomatous optic neuropathy was confirmed by optic disc and retinal nerve fiber layer (RNFL) abnormalities on optical coherence tomography (OCT), along with corresponding visual field defects on HFA 30–2. All subjects provided informed consent and understood the trial before participating. Exclusion criteria included significant media opacities such as severe cataract or corneal opacities, history of retinal diseases, optic neuritis, primary angle-closure glaucoma, secondary glaucoma, amblyopia, severe strabismus, previous ocular surgeries, severe systemic diseases such as uncontrolled hypertension or diabetes, pregnancy, breastfeeding, or any disability that could interfere with the study procedures.
Apparatus
Perimouse
Perimouse is an innovative, computer-based remote perimeter and has been granted a software copyright in China (2024SR1555522). To ensure accuracy, this study required a minimum resolution of 1280×720 pixels, a screen size of at least 13 inches, and brightness above 200 cd/m2 for clear display and test integrity. All devices used by participants met the minimum hardware requirements. Participants were provided with written instructions and instructional videos to guide home testing, which was required to be performed in a dim room. Prior to home-based testing, participants received guidance on Perimouse test procedures either during an in-person session at the hospital or through remote instruction, including fixation requirements and response procedures. Perimouse visual field testing was performed monocularly, with the fellow eye occluded using a white eye patch. The screen brightness should be calibrated to the maximum and the distance between the participant’s eyes and the screen should be maintained at 30–35 cm, with the exact distance determined by the initial physiological blind spot identification test. To minimize head movement and keep the eye-to-screen distance constant, the participant was instructed to support their chin with one hand, placing the same-side elbow on the desk as a makeshift chinrest.
Figure 1 illustrated that Perimouse, operating on a PC with internet access and a mouse, comprises a physiological blind spot identification test and a main visual field test. The participant’s physiological blind spot determines the saccadic vector, which in turn establishes the location of the stimulus. The Perimouse test pattern utilizes a modified HFA 24–2 strategy and assays 44 locations, including two locations in the physiological blind spot. Perimouse adopts a fixation alteration strategy, allowing participants to shift their gaze naturally instead of maintaining a fixed central fixation. It also employs a “click and confirm” strategy, where the left mouse button is used to indicate when a stimulus is detected, and the right mouse button is pressed when no new stimulus perceived. Regarding reliability indices, when the current stimulus is yellow and the mouse cursor deviates, both the yellow and new stimuli vanish simultaneously, which is recorded as a fixation loss (see Figure 1). This mechanism may help participants focus on the current stimulus and minimizes unnecessary visual searches. False-negative rates are assessed similarly to HFA, using six suprathreshold stimuli.
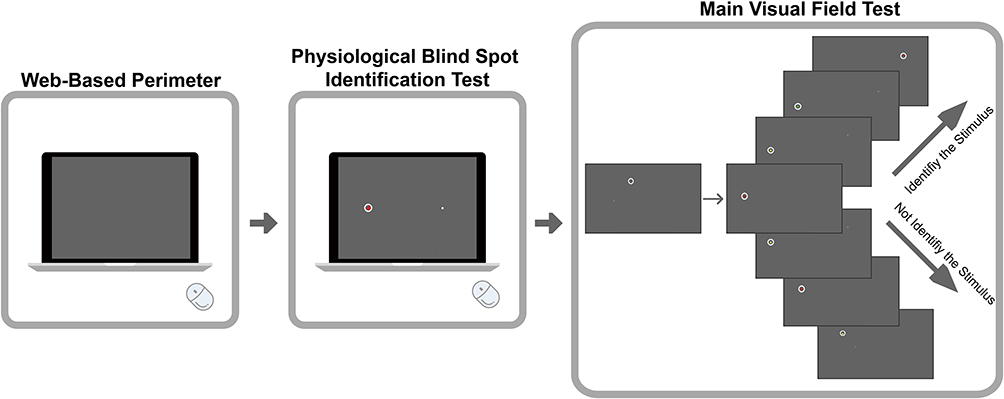 |
Figure 1 Diagram of the operation. Perimouse includes a blind spot identification test before the main test. During the main test, a randomly selected point initially appears in gray–white. When the cursor hovers over it, the stimulus turns red. Clicking the left mouse button then changes it to yellow, and a new stimulus appears immediately. Participants must fixate on the current stimulus and use peripheral vision to judge its presence, which remains displayed until the subject makes a decision. If detected, participants click again with the left mouse button so that the yellow stimulus turns green, then reposition the cursor to the new stimulus, fixate on it, and repeat the test. If not detected, a right-click turns the stimulus red and causes the new stimulus to disappear. A subsequent left-click turns the stimulus yellow and triggers another new stimulus to appear. When the stimulus is yellow, if the mouse cursor leaves it, both the current and new stimuli vanish and a fixation loss is recorded. A right-click must be performed again, causing the original stimulus to reappear. In this approach, participants use a computer mouse to determine whether a stimulus is detected via their peripheral vision, and then confirm their perception by clicking the corresponding mouse button. This procedure is termed the “click and confirm” strategy. |
The stimulus size used in Perimouse is 9 mm2 (0.52°), which is larger than the 4 mm2 (0.43°) of the Goldmann Size III stimulus. The test background is set to an RGB value of (100, 100, 100) with a luminance of 38 cd/m2. Perimouse includes both threshold and suprathreshold programs. In the threshold program, stimulus brightness is determined using a modified binary search strategy (MOBS) to assess visual field sensitivity, with a measurement range of 0–24dB. The overall stimulus brightness ranges from 38 to 300 cd/m2, corresponding to an RGB range of 100 to 255. In practical validation, the maximum recognizable light sensitivity was 21dB.16 The suprathreshold program uses a brightness of 12 dB for screening visual field defects, while the threshold program provides a quantitative analysis of visual field loss for follow-up monitoring. This study utilized the threshold program.16
Upon completion of each Perimouse test, data were automatically transmitted to the study server and concurrently saved locally on the participant’s computer. Server-side data were retrieved by the investigators for subsequent analysis.
Humphrey Field Analyzer
The HFA (Carl Zeiss Meditec AG, Jena, Germany) SITA 30–2 program was used, and HFA results were reliable with fixation loss <20%, false-positive rates <15%, and false-negative rates <15%.
Test Procedures
As shown in Figure 2A, participants performed a monthly monocular or binocular Perimouse threshold program at home for a duration of 6 months. In the first month, participants were additionally required to perform a retest within one week after the first test to assess test–retest reliability. The research team reminded participants to conduct self-assessments through phone calls or text messages at the beginning of each month. Participants underwent a baseline HFA SITA 30–2 visual field test clinically and repeated it after six months of follow-up. The mean deviation (MD) of HFA and Perimouse was used to evaluate visual field defects.
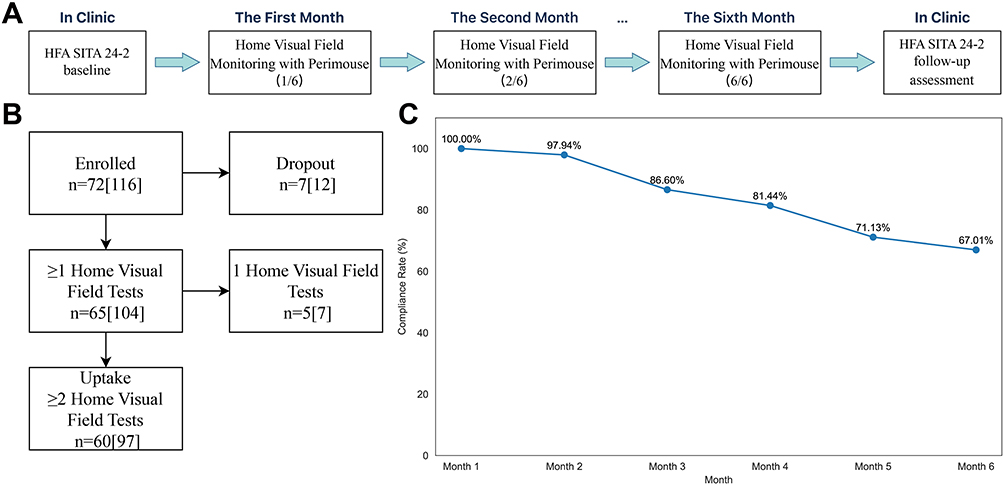 |
Figure 2 (A) Trial Flowchart. (B) Participant enrollment flowchart. (C) Monthly completion rates for home visual field test. |
Statistical Analysis
Data were analyzed using SPSS version 26.0 (IBM Corp., Armonk, NY, USA) and Python 3.8. The normality of the data was assessed using the Shapiro–Wilk test. Continuous variables were expressed as mean ± standard deviation (SD). For paired comparisons, a paired Student’s t-test was used for normally distributed data, while the Wilcoxon signed-rank test was applied for non-normally distributed data. Consistency of Perimouse measurements across was evaluated using Bland-Altman plot and intraclass correlation coefficients (ICC). For group comparisons of Perimouse 6-month follow-up results, an analysis of variance (ANOVA) was used for normally distributed data, and the Kruskal–Wallis test for non-normally distributed data. Mean absolute error (MAE) was calculated to assess variability, and Cronbach’s alpha measured the internal consistency of the questionnaire. A P-value of <0.05 was considered statistically significant.
Results
In this study, 72 participants (116 eyes) were recruited (Figure 2B). Among them, 7 participants (12 eyes) were lost to follow-up without completing any Perimouse home visual field tests. Additionally, 5 participants (7 eyes) completed one home visual field test. Ultimately, a total of 60 participants (97 eyes) were enrolled in the analysis. The clinical characteristics of the participants were presented in Table 1. Figure 2C illustrated the monthly completion rates of home visual field tests, with an expected 97 results each month (Figure 3). The follow-up completion rate in the final month remained 67.01% despite a gradual decline over time. Baseline characteristics of eyes that completed and did not complete the 6-month follow-up were comparable, with no significant differences in age, baseline HFA MD, or glaucoma severity distribution, although a difference in sex distribution was noted (Supplementary Table S1). For test–retest analysis, 52 participants (72 eyes) underwent the retest. All included participants completed two clinical HFA tests that met the reliability criteria.
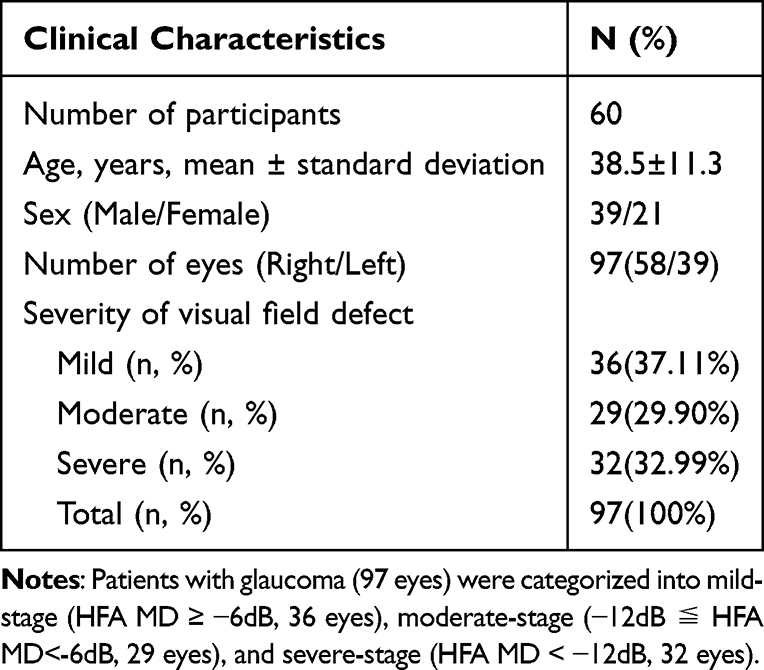 |
Table 1 Clinical Characteristics of Participants |
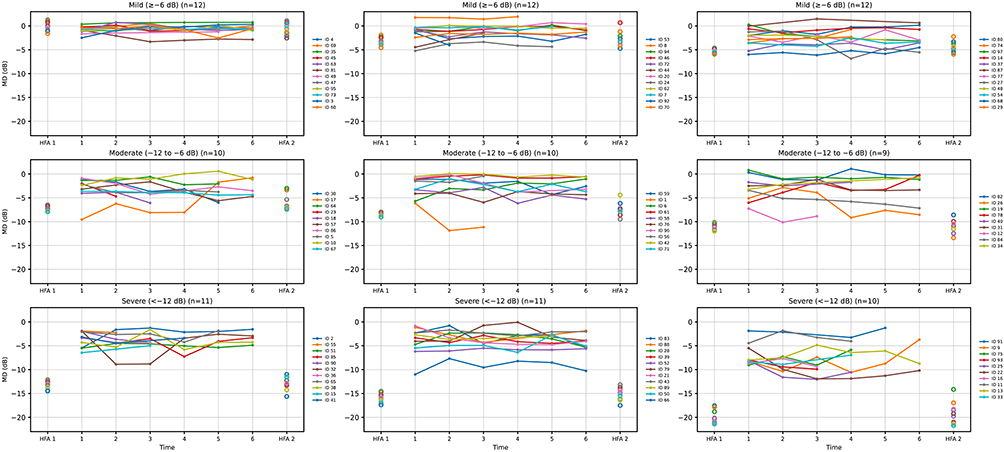 |
Figure 3 MD values of Perimouse and HFA over a 6-month follow-up period, stratified by baseline glaucoma severity. Eyes were classified as mild (≥ −6 dB), moderate (−12 to −6 dB), or severe (< −12 dB) based on baseline HFA MD. Within each panel, colored lines represent individual eyes and depict Perimouse MD values across Months 1–6. Hollow circles at the left and right margins indicate HFA MD values obtained before and after the follow-up period, respectively. |
Stability and Variability of Perimouse in 6-Month Remote Visual Field Monitoring of Glaucoma Patients
In pointwise analyses, test–retest results (Figure 4A) showed that variability depended on visual field sensitivity. For lower sensitivities (≤10dB), the interquartile range (IQR) and whisker length were noticeably wider, indicating greater variability. In contrast, for sensitivities ≥14dB, the distributions were tighter, indicating lower variability. Figure 4B illustrated the pointwise agreement between month 1 and months 2 to 6 using Bland–Altman plots at each 24–2 test location. Most locations showed relatively small fluctuations in mean differences, typically within ±1 dB across follow-up visits.
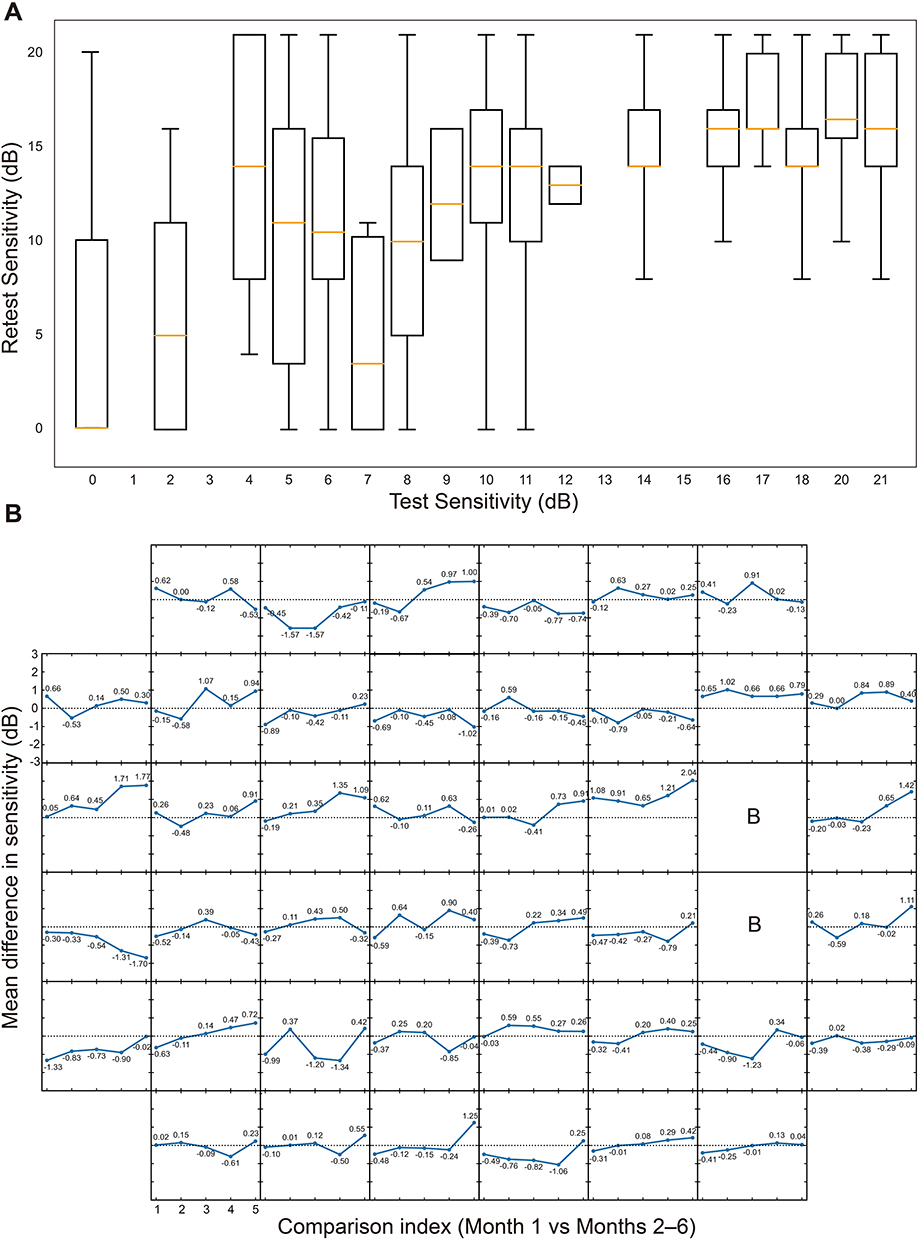 |
Figure 4 (A) Pointwise test–retest sensitivity boxplots for Perimouse. The x‑axis represents the initial test sensitivity (dB), and the y‑axis represents the corresponding retest sensitivity (dB). The box represents the 25th to 75th percentile (interquartile range, IQR), the Orange horizontal line inside the box indicates the median, and the whiskers extend to the 5th and 95th percentiles of the dataset. (B) Bland-Altman mean difference line graphs for Perimouse. Each small square represents a Perimouse 24–2 test location. The shared x-axis indicates the comparison index (Month 1 versus Months 2–6), and the shared y-axis represents the mean difference in sensitivity (dB) calculated by Bland–Altman analysis. Squares marked with the letter “B” indicate test locations corresponding to the physiological blind spot. The horizontal dotted line denotes a mean difference of zero. |
Based on the Garway-Heath map (Supplementary Figure S1),17 the Perimouse test points were divided into corresponding zones. As shown in Table 2, the mean sensitivity (MS) and MD values across different zones during the follow-up period indicate that all regions, except the temporal visual field region (zone 4), demonstrated moderate consistency, with ICC values fluctuating between 0.559 and 0.722.
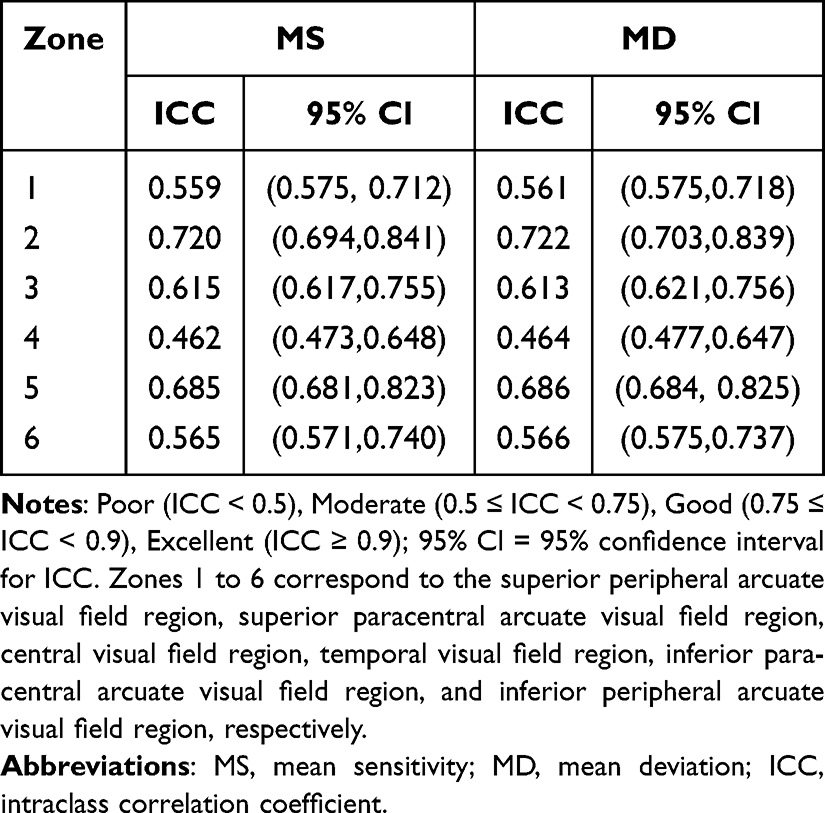 |
Table 2 Consistency of Six-Month Zone Mean Sensitivity and Mean Deviation in Perimouse |
In Figure 5A, the violin plots illustrate the distribution and variability of MD values across six Perimouse tests and two HFA tests, providing a visual comparison between the two methods. For Perimouse, the median MD values ranged from −2.85 dB to −1.95 dB, with distributions primarily clustered between −5 dB and 0 dB. The one-way ANOVA confirmed no significant differences across the six tests (P>0.05). The median values for the two HFA tests were relatively consistent (−7.96dB and −7.22dB), with similar distribution ranges. The overall HFA data exhibited a wider spread. Additionally, the paired t-test results indicated no significant difference between the two tests (P>0.05).
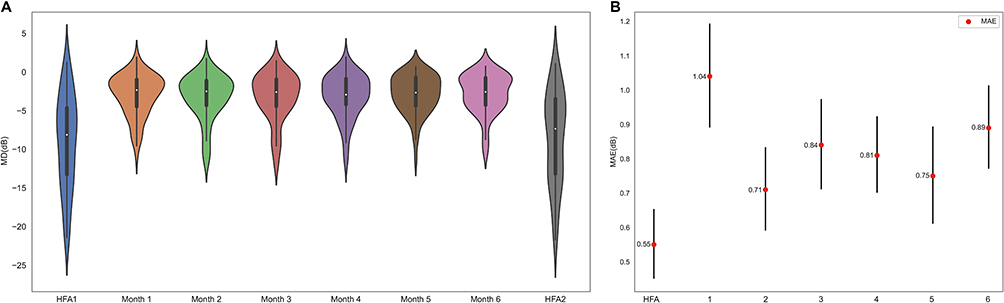 |
Figure 5 Stability and variability of Perimouse in remote home-based visual field monitoring. (A) Violin plot of Perimouse and HFA 6-month follow-up results. (B) MAE (with Bootstrap Method) for Perimouse and HFA. Red dots represent the MAE values, and error bars indicate the standard error of the mean (SEM), calculated using the bootstrap method (N=1000). For HFA, the MAE was calculated using Mean HFA MD as the true value. For Perimouse, the MAE was calculated using Mean Perimouse MD (from Month 1 to Month 6) as the true value. |
As shown in Figure 5B, MAE was used as a key metric to assess the variability between Perimouse and HFA over the follow-up period. The MAE for HFA was 0.55dB, indicating relatively stable test outcomes. In contrast, the MAE for Perimouse varied between 0.71dB to 1.04dB, with the highest MAE observed in the first test. Subsequent tests showed a downward trend in Perimouse’s MAE, but it remained slightly higher than that of HFA. Therefore, Perimouse, as a home-based visual field test, demonstrates more variability compared to traditional clinical HFA tests.
Figure 6 showed Bland–Altman plots for Perimouse global MD values comparing Month 1 with Months 2–6 and the two HFA tests. The mean difference was near zero, and most values fell within the 95% limits of agreement (LoA), demonstrating acceptable agreement. Figure 7 and Table 3 then compared the mean MD from the two HFA tests with Perimouse MD at each monthly visit. The average difference across six measurements was approximately −5dB, indicating that, for these subjects, HFA measurements were around 5dB lower than those from Perimouse. Over the six-month period, the 95% LoA remained relatively consistent. The scatter plots showed an upward trend with increasing mean values, suggesting that lower MD values may correspond to larger differences between the two methods. For individual participants, Figure 3 illustrates longitudinal MD trajectories measured by Perimouse and HFA, stratified by baseline glaucoma severity. Overall, MD values remained relatively stable in most eyes throughout the 6-month follow-up period. However, greater variability was observed in eyes with more advanced glaucoma.
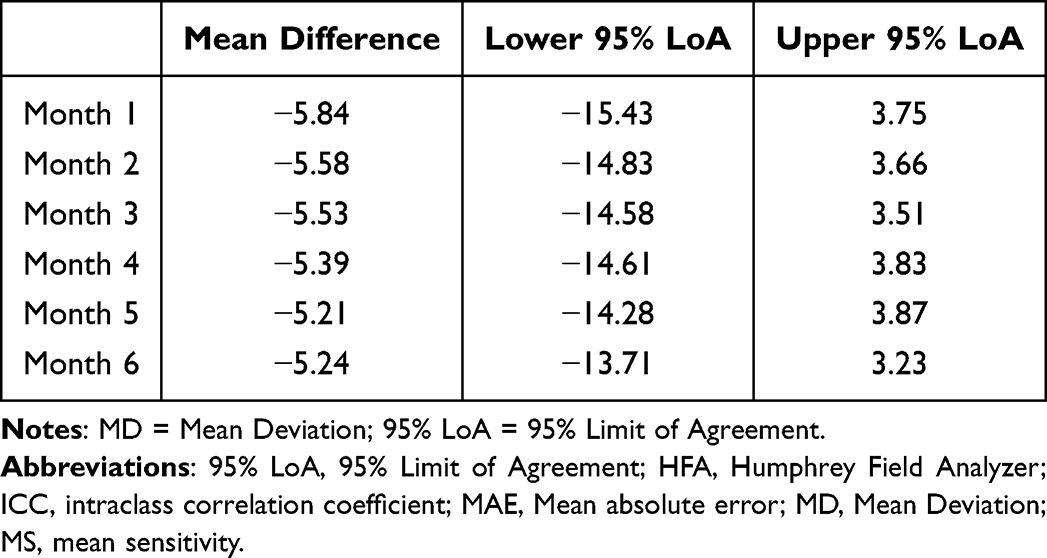 |
Table 3 Agreement Between Perimouse and Mean HFA in Different Months |
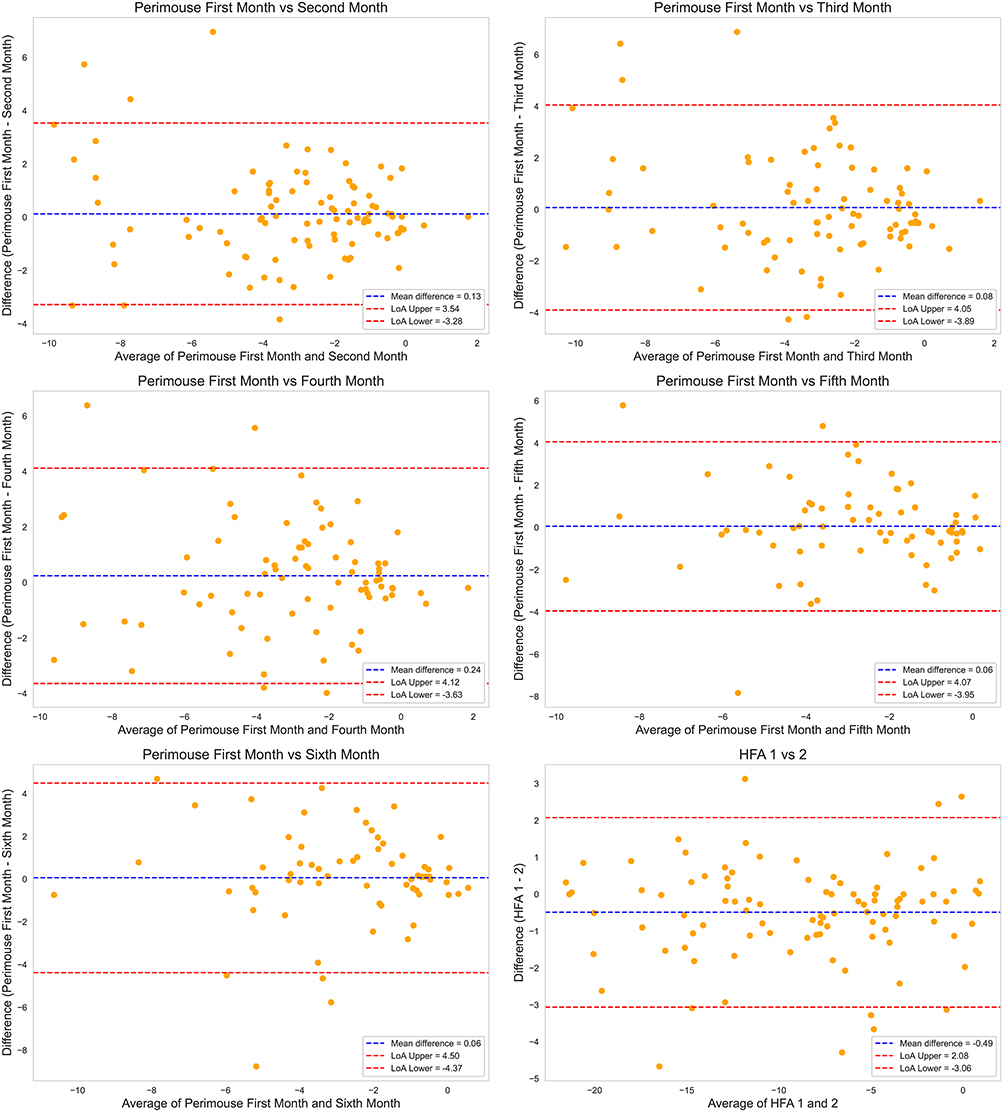 |
Figure 6 Bland–Altman plots comparing MD values. The first five panels compare Perimouse MD values from Month 1 with those from Months 2–6, while the final panel compares MD values between the two HFA tests. In each plot, the blue line represents the mean difference (bias) between measurements, and the red lines denote the 95% limits of agreement (bias ± 1.96 SD). |
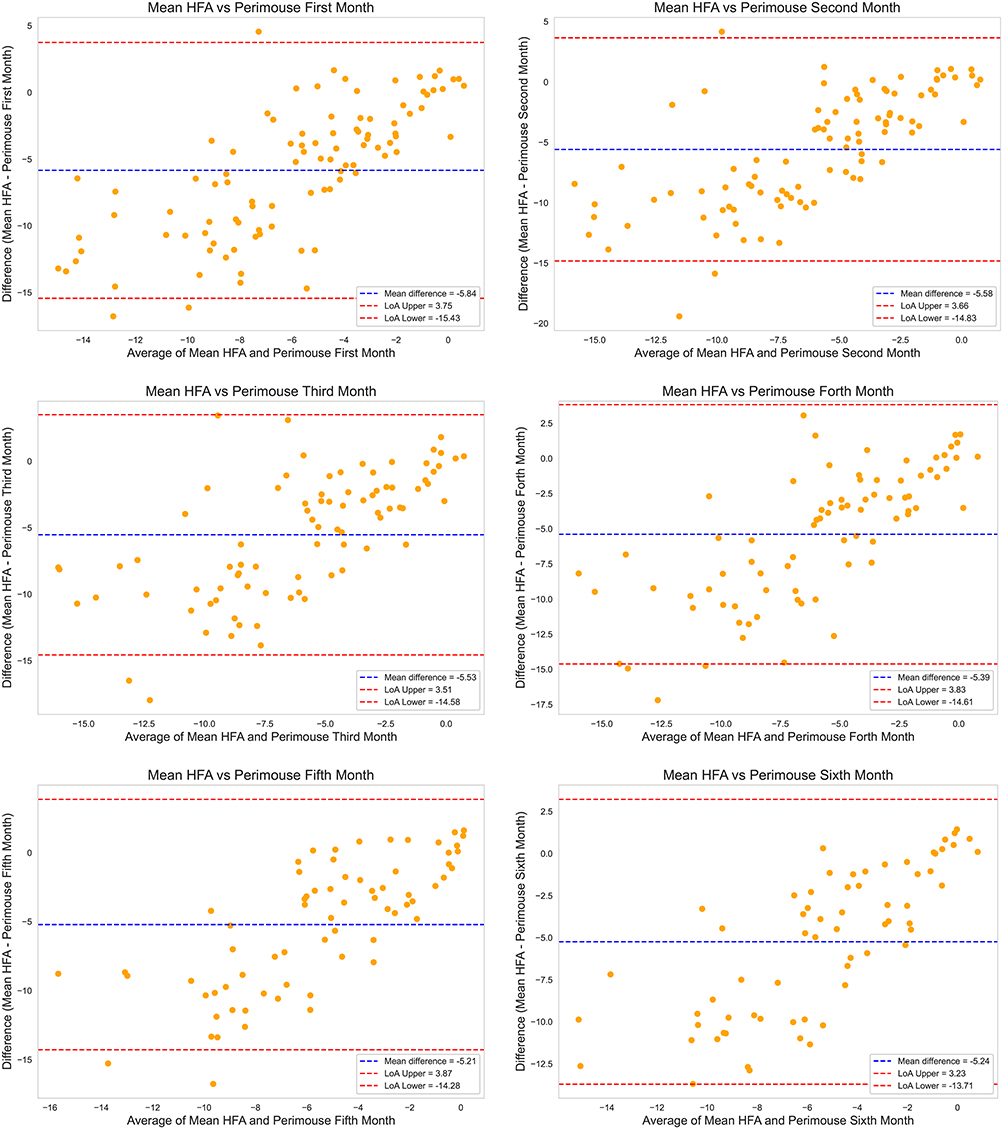 |
Figure 7 Bland-Altman plots for mean HFA MD and monthly Perimouse MD. Each graph showed a monthly Perimouse test result compared to mean HFA. For Bland-Altman plots, the blue line represented the mean differences (bias) between tests, red lines represent the 95% limits of agreement (Bias±1.96SD). |
Test Duration
The durations for HFA were 6.27±1.42 minutes and 6.19±1.35 minutes, respectively, with a paired t-test revealing no significant difference between the two tests (P>0.05). The six Perimouse tests had durations of 10.04±2.74, 9.44±3.07, 9.00±2.97, 8.89±2.66, 8.41±2.65, and 8.31±2.77 minutes, respectively. These durations exclude the time spent on blind spot mapping, which typically took only a few seconds. Significant differences were observed between the first Perimouse test and the third, fourth, fifth, and sixth tests (P<0.05), with longer durations noted in the initial test. This may reflect increased participant familiarity with the Perimouse testing procedure, resulting in a gradual reduction in test duration.
Analysis of Participant Acceptability Using a Rating Scale
This study distributed 60 questionnaires and received 51 valid responses. The Likert scale was used for analysis, aiming to assess participants’ acceptability of the Perimouse device in terms of cost-effectiveness, ease of use, and accuracy. From the perspective of reliability assessment, the questionnaire’s Cronbach’s alpha coefficient was 0.913, indicating a high internal consistency among the items and reflecting the questionnaire’s high reliability.
Radar chart results (Figure 8) showed that Perimouse scored averages of 3.52, 3.26, 4.2, and 4.42 in “stress relief”, “visual ease”, “economic advantage” and “economic relief” respectively, while HFA scored 3.31, 3.13, 2.77, and 3.28 in the same categories. The Wilcoxon signed-rank test revealed significant differences (P<0.05) between Perimouse and HFA, with Perimouse scoring higher in all these individual domains. In contrast, in other aspects such as “ease of understanding,” “acceptance of results,” “practicality”, “focus ease”, “satisfaction with test time,” and “ operation difficulty,” the Wilcoxon signed-rank test showed no significant difference (P>0.05) between the two methods. Scores for Perimouse were 4.00, 3.80, 3.86, 3.58, 3.66, and 3.78 respectively; scores for Humphrey in the same categories were 4.33, 4.22, 4.02, 3.87, 3.71, and 3.81 respectively.
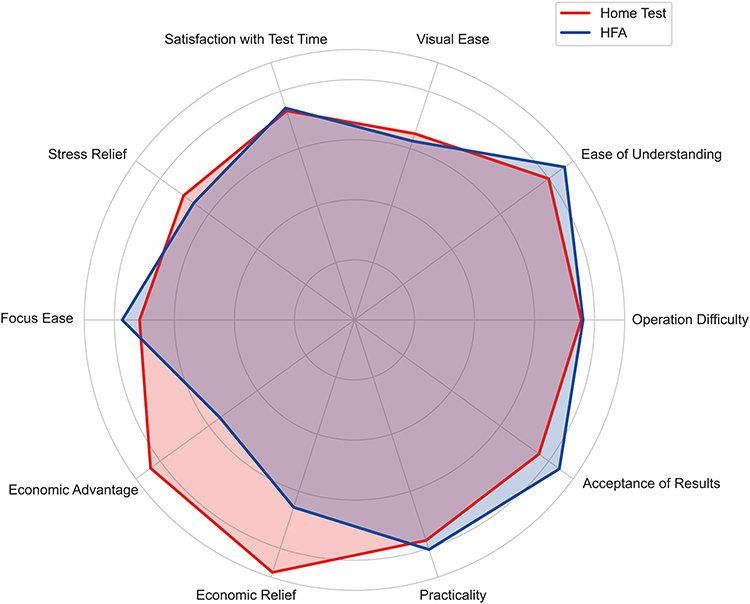 |
Figure 8 Radar chart of participant acceptability for Perimouse and HFA. |
Discussion
This study evaluated the feasibility and reliability of Perimouse, a free-of-charge portable perimeter, for remote visual field monitoring in Chinese glaucoma patients over six months. Although pointwise analyses showed variability at lower sensitivity locations, test–retest results remained relatively consistent in high-sensitivity locations. Over the six months, Perimouse demonstrated consistent test results and reasonable agreement with HFA. Nevertheless, the systematic difference between the two devices indicated that they should not be used interchangeably. These findings underscore the potential of Perimouse as a supplementary tool for remote patient monitoring in glaucoma, offering convenient self-assessment of visual fields.
Our results revealed that Perimouse demonstrated acceptable adherence and feasibility for remote patient monitoring. By the sixth test, about two-thirds of participants remained adherent. This suggests that while remote follow-up improves convenience, challenges remain in the long-term management of chronic conditions like glaucoma. Patient adherence may be influenced by factors including system usability, the effectiveness of regular reminder mechanisms, and the patients’ comprehension of remote monitoring.
Pointwise test-retest analyses indicated higher variability at lower-sensitivity locations (Figure 4A), whereas high-sensitivity locations remained close to initial measurements with tighter distributions, suggesting greater repeatability. Therefore, for high sensitivity test locations, subsequent measurements falling below the 5% lower limit may serve as an early indicator of visual field progression. Over the six-month period, Perimouse demonstrated generally stable local measurements (Figure 4B). Given the characteristic patterns of visual field damage in POAG, this study used the Garway-Heath map to analyze Perimouse’s measurement consistency across different regions (Table 2). Perimouse exhibited moderate consistency across the zones during the follow-up except for the temporal visual field region. This may relate to its proximity to the physiological blind spot and the fixation alteration strategy used by Perimouse.
As shown in (Figures 5A and 6), Perimouse global MD values demonstrated acceptable agreement throughout the six‑month follow‑up, with consistent distributions and minimal bias. Bland–Altman analysis (Figure 7 and Table 3) showed that the bias and limits of agreement between Perimouse and HFA remained relatively stable over six months, supporting the repeatability of Perimouse during long‑term follow‑up. However, Perimouse generally demonstrated higher mean MD values and lower data dispersion than HFA (Figures 5A and 7). Furthermore, Perimouse showed greater variability than HFA, as indicated by larger MAE (Figure 5B). This finding is consistent with our previous study, which demonstrated substantial variability in agreement between Perimouse and HFA, attributable to differences in testing techniques and test conditions.16 Thus, the two devices are not directly interchangeable. Firstly, Perimouse has a narrower threshold range (0–24dB) than HFA (0–51dB), which may restrict sensitivity detection in low-contrast areas and lead to a “ceiling effect”. Moreover, Perimouse employs a larger stimulus size and a variable stimulus duration based on the subject’s response time, while HFA uses a fixed 200 ms duration. Consequently, Perimouse may underestimate certain visual field defects. Furthermore, Perimouse functions as a tangent perimeter rather than hemispherical. It also employs a fixation alteration strategy and lacks of a chin rest, which placing higher fixation demands and requiring stricter control over head positioning and eye-screen distance. All these factors contribute to the differences between the two devices and Perimouse’s comparatively higher variability. Nevertheless, as a portable perimeter, these differences remain acceptable in telemedicine applications.
The questionnaire results demonstrated strong participant acceptability of Perimouse, highlighting its ability to reduce visual fatigue, possibly due to its fixation alteration strategy. Participants also considered it offered a more relaxed experience and significant economic benefits. Given these advantages, home-based visual field monitoring has the potential to reduce hospital visits for stable patients. The cost-effectiveness analysis, which considers medical costs, non-medical costs (eg, transportation), indirect costs from income loss, and time savings, suggests potential savings of approximately $84.9 every six months.18,19 These positive patient experiences support Perimouse as a convenient, effective tool for remote monitoring and long-term glaucoma management.
Currently, various portable threshold perimeters are available, but few have been assessed for feasibility and reliability in long-term, unsupervised home follow-up studies.20,21 Melbourne Rapid Fields (MRF), an iPad-based threshold perimeter (range 0–30dB), has shown promising results in remote follow-up.22–24 In a 6-month study, MRF correlated strongly with HFA, with ICC for MD ranging from 0.71 to 0.90 and test-retest reliability of 0.98.22 A 12-month study using MRF for weekly home testing achieved 75% compliance and detected visual field progression in two cases.23 A study using Eyecatcher, combining a Microsoft Surface Pro 3 tablet with an eye tracker (Tobii EyeX), was evaluated monthly over 6 months in 20 glaucoma patients, showing high concordance with clinical tests (r = 0.94, P < 0.001) and 98% adherence.25 Spaeth/Richman Contrast Sensitivity Test (SPARCS), an internet‑based contrast sensitivity (CS) test for central and peripheral CS, proved useful in monitoring POAG over 24 months.26 Both MRF and Eyecatcher require stable central fixation and are limited by screen size (eg, Eyecatcher ±15° horizontally, ±9° vertically).24,25 Additionally, MRF is a commercial software and Eyecatcher requires an expensive eye tracker, while SPARCS is free but less comprehensive for pointwise defects.26 Perimouse is a free-to-use, PC‑based perimeter that employs a fixation alteration strategy to assess both central and peripheral sensitivity without hindering foveation reflex.
The study has several limitations. Firstly, this study used Perimouse 24–2 in comparison with HFA 30–2, as some follow-up participants were from the Laser in Glaucoma and Ocular Hypertension Trial (LiGHT) in China, which utilizes HFA 30–2 in its protocol.27 Previous study has demonstrated that the MD values of HFA 24–2 and 30–2 are comparable, with no statistically significant differences.28 Given that the primary aim of this study is to assess the stability of Perimouse in remote patient monitoring, this difference has limited impact on the conclusions. Secondly, the relatively small sample size and younger participant age may limit the generalizability of the findings, particularly in terms of perimetric performance and adherence to home testing. Moreover, variability may arise from differences in user devices and the lack of supervision during home testing. Future versions should incorporate automatic device checks and camera-based eye tracking to monitor fixation and estimate eye-to-screen distance, thereby improving test accuracy and reliability. Lastly, while Perimouse showed relatively stable performance, the study did not define a clear boundary between long-term fluctuations and true progression, which is important for glaucoma management. Increasing the frequency of testing may help reduce the impact of such fluctuations. Accordingly, future studies will be needed to define clear progression criteria and evaluate the ability of Perimouse to detect true visual field deterioration over time.
In conclusion, remote home visual field testing with the Perimouse is a feasible and effective supplement to clinical perimeter. It offers a convenient, cost-effective, and patient-friendly option for monitoring glaucoma, supporting the broader trend towards personalized and remote healthcare solutions. Further studies are needed to determine its utility for detecting visual field progression and for longitudinal glaucoma management.
Acknowledgments
Xiaoyuan Shen and Zidong Chen contributed equally as co-first authors.
Author Contributions
All authors made a significant contribution to the work reported, whether that is in the conception, study design, execution, acquisition of data, analysis and interpretation, or in all these areas; took part in drafting, revising or critically reviewing the article; gave final approval of the version to be published; have agreed on the journal to which the article has been submitted; and agree to be accountable for all aspects of the work.
Funding
Supported by Innovative Clinical Technique of Guangzhou (2024P-GX07).
Disclosure
The authors report no conflicts of interest in this work.
References
1. Stein JD, Khawaja AP, Weizer JS. Glaucoma in Adults-Screening, Diagnosis, and Management: a Review. JAMA. 2021;325(2):164–14. doi:10.1001/jama.2020.21899
2. Gedde SJ, Vinod K, Wright MM, et al. Primary Open-Angle Glaucoma Preferred Practice Pattern®. Ophthalmology. 2021;128(1):P71–P150. doi:10.1016/j.ophtha.2020.10.022
3. Chen RI, Gedde SJ. Assessment of visual field progression in glaucoma. Curr Opin Ophthalmol. 2023;34(2):103–108. doi:10.1097/ICU.0000000000000932
4. European Glaucoma Society. Terminology and Guidelines for Glaucoma, 5th Edition. Br J Ophthalmol. 2021;105(Suppl 1):1–169.
5. Boodhna T, Crabb DP. More frequent, more costly? Health economic modelling aspects of monitoring glaucoma patients in England. BMC Health Serv Res. 2016;16(1):611. doi:10.1186/s12913-016-1849-9
6. Zhan L, Xu X, An L, Feng J. Analysis of the status of the services for glaucoma diagnosis and treatment in medical institutions at the county level and above in China. Chin J Optom Ophthalmol Vis Sci. 2019;21(9):711–714.
7. Davis A, Baldwin A, Hingorani M, Dwyer A, Flanagan D. A review of 145 234 ophthalmic patient episodes lost to follow-up. Eye. 2017;31(3):422–429. doi:10.1038/eye.2016.225
8. Mecklai K, Smith N, Stern AD, Kramer DB. Remote Patient Monitoring — overdue or Overused? N Engl J Med. 2021;384(15):1384–1386. doi:10.1056/NEJMp2033275
9. Omboni S, Campolo L, Panzeri E. Telehealth in chronic disease management and the role of the Internet-of-Medical-Things: the Tholomeus® experience. Expert Rev Med Devices. 2020;17(7):659–670. doi:10.1080/17434440.2020.1782734
10. Hamine S, Gerth-Guyette E, Faulx D, Green BB, Ginsburg AS. Impact of mHealth chronic disease management on treatment adherence and patient outcomes: a systematic review. J Med Internet Res. 2015;17(2):e52. doi:10.2196/jmir.3951
11. Meshkin RS, Armstrong GW, Hall NE, Rossin EJ, Hymowitz MB, Lorch AC. Effectiveness of a telemedicine program for triage and diagnosis of emergent ophthalmic conditions. Eye Lond Engl. 2023;37(2):325–331.
12. Jørgensen EP, Muttuvelu DV, Peto T, et al. Implementing teleophthalmology services to improve cost-effectiveness of the national eye care system. Eye Lond Engl. 2024;38(14):2788–2795.
13. Lam PY, Chow SC, Lai JSM, Choy BNK. A review on the use of telemedicine in glaucoma and possible roles in COVID-19 outbreak. Surv Ophthalmol. 2021;66(6):999–1008. doi:10.1016/j.survophthal.2021.03.008
14. Brandão-de-Resende C, Alcântara LAR, Vasconcelos-Santos DV, Diniz-Filho A. Glaucoma and Telemedicine. J Glaucoma. 2023;32(5):327–332. doi:10.1097/IJG.0000000000002200
15. Jo JJ, Pasquale LR. Recent developments of telemedicine in glaucoma. Curr Opin Ophthalmol. 2024;35(2):116–123. doi:10.1097/ICU.0000000000001019
16. Chen Z, Shen X, Zhang Y, et al. Development and Validation of an Internet-Based Remote Perimeter (Perimouse). Transl Vis Sci Technol. 2024;13(3):16. doi:10.1167/tvst.13.3.16
17. Garway-Heath DF, Poinoosawmy D, Fitzke FW, Hitchings RA. Mapping the visual field to the optic disc in normal tension glaucoma eyes. Ophthalmology. 2000;107(10):1809–1815. doi:10.1016/S0161-6420(00)00284-0
18. Tang J, Liang Y, O’Neill C, Kee F, Jiang J, Congdon N. Cost-effectiveness and cost-utility of population-based glaucoma screening in China: a decision-analytic Markov model. Lancet Glob Health. 2019;7(7):e968–e978. doi:10.1016/S2214-109X(19)30201-3
19. Liu H, Li R, Zhang Y, et al. Economic evaluation of combined population-based screening for multiple blindness-causing eye diseases in China: a cost-effectiveness analysis. Lancet Glob Health. 2023;11(3):e456–e465. doi:10.1016/S2214-109X(22)00554-X
20. Vingrys AJ, Healey JK, Liew S, et al. Validation of a Tablet as a Tangent Perimeter. Transl Vis Sci Technol. 2016;5(4):3. doi:10.1167/tvst.5.4.3
21. Jones PR. An Open-source Static Threshold Perimetry Test Using Remote Eye-tracking (Eyecatcher): description, Validation, and Preliminary Normative Data. Transl Vis Sci Technol. 2020;9(8):18. doi:10.1167/tvst.9.8.18
22. Prea SM, Kong YXG, Mehta A, et al. Six-month Longitudinal Comparison of a Portable Tablet Perimeter With the Humphrey Field Analyzer. Am J Ophthalmol. 2018;190:9–16. doi:10.1016/j.ajo.2018.03.009
23. Prea SM, Vingrys AJ, Kong GYX. Test Reliability and Compliance to a Twelve-Month Visual Field Telemedicine Study in Glaucoma Patients. J Clin Med. 2022;11(15):4317. doi:10.3390/jcm11154317
24. Prea S, Guymer R, Kong G, Vingrys A. Performance of a Smart Device over 12-Months for Home Monitoring of Patients with Intermediate Age-Related Macular Degeneration. J Clin Med. 2023;12(7):2530. doi:10.3390/jcm12072530
25. Jones PR, Campbell P, Callaghan T, et al. Glaucoma Home Monitoring Using a Tablet-Based Visual Field Test (Eyecatcher): an Assessment of Accuracy and Adherence Over 6 Months. Am J Ophthalmol. 2021;223:42–52. doi:10.1016/j.ajo.2020.08.039
26. Ichhpujani P, Singh T, Thakur S, Singh RB, Kumar S. Assessing glaucoma deterioration using Spaeth/Richman contrast sensitivity test. Ther Adv Ophthalmol. 2020;12:2515841420977412. doi:10.1177/2515841420977412
27. Yang Y, Jiang Y, Huang S, et al. Laser in Glaucoma and Ocular Hypertension Trial (LIGHT) in China - A Randomized Controlled Trial: design and Baseline Characteristics. Am J Ophthalmol. 2021;230:143–150. doi:10.1016/j.ajo.2021.04.020
28. Bae SH, Yi K. Comparison of clinical usefulness of central 30-2 and 24-2 threshold tests using SITA strategy. Int Ophthalmol. 2022;42(2):621–626. doi:10.1007/s10792-021-02034-2
 © 2026 The Author(s). This work is published and licensed by Dove Medical Press Limited. The
full terms of this license are available at https://www.dovepress.com/terms
and incorporate the Creative Commons Attribution
- Non Commercial (unported, 4.0) License.
By accessing the work you hereby accept the Terms. Non-commercial uses of the work are permitted
without any further permission from Dove Medical Press Limited, provided the work is properly
attributed. For permission for commercial use of this work, please see paragraphs 4.2 and 5 of our Terms.
© 2026 The Author(s). This work is published and licensed by Dove Medical Press Limited. The
full terms of this license are available at https://www.dovepress.com/terms
and incorporate the Creative Commons Attribution
- Non Commercial (unported, 4.0) License.
By accessing the work you hereby accept the Terms. Non-commercial uses of the work are permitted
without any further permission from Dove Medical Press Limited, provided the work is properly
attributed. For permission for commercial use of this work, please see paragraphs 4.2 and 5 of our Terms.