Back to Journals » Drug Design, Development and Therapy » Volume 9
High-throughput virtual screening with e-pharmacophore and molecular simulations study in the designing of pancreatic lipase inhibitors
Authors Veeramachaneni GK, Raj KR, Chalasani LM, Bondili JS, Talluri VR
Received 5 March 2015
Accepted for publication 30 April 2015
Published 6 August 2015 Volume 2015:9 Pages 4397—4412
DOI https://doi.org/10.2147/DDDT.S84052
Checked for plagiarism Yes
Review by Single anonymous peer review
Peer reviewer comments 3
Editor who approved publication: Professor Shu-Feng Zhou
Ganesh Kumar Veeramachaneni, K Kranthi Raj, Leela Madhuri Chalasani, Jayakumar Singh Bondili, Venkateswara Rao Talluri
Department of Biotechnology, K L University, Guntur, India
Background: Obesity is a progressive metabolic disorder in the current world population, and is characterized by the excess deposition of fat in the adipose tissue. Pancreatic lipase is one of the key enzymes in the hydrolysis of triglycerides into monoglycerides and free fatty acids, and is thus considered a promising target for the treatment of obesity. The present drugs used for treating obesity do not give satisfactory results, and on prolonged usage result in severe side effects. In view of the drastic increase in the obese population day-to-day, there is a greater need to discover new drugs with lesser side effects.
Materials and methods: High-throughput virtual screening combined with e-pharmacophore screening and ADME (absorption, distribution, metabolism, and excretion) and PAINS (pan-assay interference compounds) filters were applied to screen out the ligand molecules from the ZINC natural molecule database. The screened molecules were subjected to Glide XP docking to study the molecular interactions broadly. Further, molecular dynamic simulations were used to validate the stability of the enzyme–ligand complexes. Finally, the molecules with better results were optimized for in vitro testing.
Results: The screening protocols identified eight hits from the natural molecule database, which were further filtered through pharmacological filters. The final four hits were subjected to extra precision docking, and the complexes were finally studied with molecular dynamic simulations. The results pointed to the zinc 85893731 molecule as the most stable in the binding pocket, producing consistent H-bond interaction with Ser152 (G=-7.18). The optimized lead molecule exhibited good docking score, better fit, and improved ADME profile.
Conclusion: The present study specifies zinc 85893731 as a lead molecule with higher binding score and energetically stable complex with pancreatic lipase. This lead molecule, along with its various analogs, can be further tested as a novel inhibitor against pancreatic lipase using in vitro protocols.
Keywords: obesity, triglycerides, ZINC database, docking, extra precision, molecular dynamic simulations
Introduction
Obesity is one of the major health threats in the population worldwide. It is associated with various health threats, especially type II diabetes, hypertension, heart-related problems, asthma, and cancer, and is increasing at an alarming rate.1–3 According to statistics, approximately 42 million children below the age of 5 years were obese in 2013.4 Obesity is mainly due to imbalance in the lipid metabolism, resulting in interruption in energy homeostasis. Identifying and controlling the enzymes involved in lipid metabolism using drugs may be helpful in the treatment of obesity and its related disorders.
Pancreatic lipase is one of the important enzymes involved in the breakdown of lipids, and has become a promising therapeutic target for the treatment of obesity.5 It is a key enzyme secreted by pancreas, and plays a vital role in the digestion of total dietary lipids (50%–70%) by breaking them down into monoglycerides and fatty acids. These end products combine with bile acids, cholesterol, and lysophosphatidic acid, forming micelles. The resynthesis of triglycerides takes place once these micelles are absorbed into the intestine and are stored in adipose tissue.6,7 Inhibiting pancreatic lipase blocks the breakdown of triglycerides, and thereby helps in the reduction of excess fat absorption. Colipase is a precursor protein required by the pancreatic lipase for its activity, formed from procolipase secreted by exocrine pancreas. This protein binds to the C-terminal end of the pancreatic lipase without any conformation modifications, forming a lipase–procolipase complex.8 The entire activity of the enzyme is maintained by the catalytic triad in the active pocket of the protein. The catalytic triad comprises Ser152, Asp176, and His263. Among them, Ser152 is the foremost important residue essential for performing lipolytic activity.9 Pancreatic lipase inhibition was a broadly studied pathway for the purpose of developing antiobesity drugs. Orlistat is one of the popular US Food and Drug Administration (FDA)-approved drugs for the treatment of obesity, and has been shown to act through inhibition of pancreatic lipase. Even though it is one of the most widely used drugs for the treatment of obesity, severe side effects, including gastrointestinal disturbances and oily stools, were reported over prolonged usage.10 Therefore, there is a need to develop a much safer drug from natural products with minimal side effects.
In vitro screening of a large number of natural molecules for their biological activity is an expensive and time-consuming process with low success rates. High-speed computational methods became prominent by crossing all these barriers. Using in silico screening filters for the identification of lead molecules reduced drug-discovery time and cost as well. Currently, accessibility to a large number of high-resolution protein crystal structures, high-throughput screening, protein–ligand docking, and other various protocols has immensely accelerated the drug-discovery pipeline.11–16 The aim of this work was to identify potent inhibitors against pancreatic lipase using the ZINC natural molecule database.
Materials and methods
Protein preparation
The 3-D structure of pancreatic lipase with 2.8 Å resolution was retrieved from the protein data bank (ID 1LPB).17 The Protein Preparation Wizard was used to prepare the protein by applying biological units, bond orders to hydrogen, zero-order bonds to metal atoms, disulfide-bond recreation, selenomethionine-to-methionine reconversion, missing side chains, loop filling, and capping the termini. Crystallized free water molecules beyond 5 Å distance surrounding the cocrystallized ligand were removed from the protein; tautomer/ionization states were generated for the ligand at pH 7.0. Further, hydrogen bonds in the protein were optimized to repair the overlapping hydrogens.18 Finally, force-field OPLS-2005 was applied to energetically minimize the protein.
Receptor-grid generation
The Glide (grid-based ligand docking with energetics) version 5.9 docking protocol generates a grid around the active site for docking.19 Initially, a grid box of size 72×72×72 Å with coordinates x=12.188, y=20.152, and z=48.922 was generated using the centroid of the cocrystallized ligand. The grid enclosed the amino acids of the receptors Ser30, Tyr41, Ser110, Thr112, Tyr114, Thr115, Ser118, Ser152, Thr185, Thr204, Ser243, Thr255, Ser266, Tyr267, Tyr269, and Thr271.
Ligand preparation
Ligands for the present study were obtained from the ZINC database.20 This database consists of 1.2 million commercially available natural compounds. All compound structural coordinates were retrieved in the mol format. Structural coordinates were converted from 2-D to 3-D format, and were energetically minimized using the OPLS-2005 force filed at a pH of 7±2.21–23 The chiral centers of all the ligand molecules were selected to retain the original state, in order to avoid stereoisomer generation.
Structure-based virtual screening
High-throughput virtual screening
Virtual screening was one of the potential screening methodologies used to identify potential leads against a target. Virtual screening was carried out using an active site of the receptor. The in silico protocol comprises three steps: high-throughput virtual screening (HTVS), standard precision, and extra precision (XP). In the present study, HTVS and XP procedures were applied. The screened molecules were ranked accordingly using G-scores.
e-Pharmacophore hypothesis generation and database screening
Structure-based drug-design and ligand-based drug-design methodologies were recognized as important computational approaches for the in silico drug discovery. e-Pharmacophore methodology24 combines the advantages of both structure-based and ligand-based drug-design theories, and can be employed rapidly to screen the ligands based on pharmacophore properties.25 Using the e-pharmacophore protocol from the scripts, pharmacophore sites were generated from protein with redocked crystal–ligand complexes, preserving a maximum of seven pharmacophore features as default. Pharmacophore chemical properties are hydrogen-bond acceptor (A), represented as vectors, hydrogen-bond donor (D) as projected points, aromatic ring (R) as ring, positive ionizable (P), and negative ionizable (N). Explicit matching was required in the e-pharmacophore approach for generation of the most energetically favorable site. The generated pharmacophore was validated by calculating enrichment factor and GH score using the following formulae:
|
|

|
|
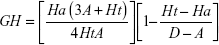
where E = enrichment factor, GH = goodness of hit, D = total compounds in the data set, A = total number of actives in the data set, Ht = total hits, and Ha = active hits. Based on the fitness score, the database hits were ranked, indicating the best match between the generated ligand conformer and the pharmacophore hypothesis.
ADME and PAINS evaluation
QikProp version 3.6 (Schrödinger suite) was used to calculate the ADME (absorption, distribution, metabolism, and excretion) properties of the ligands.25,26 This module was used to analyze the relevant pharmaceutical properties, including human oral absorption, central nervous system activity, predicted brain/blood partition coefficient (QPlogBB), octanol/water and water/gas log Ps, log S, Caco-2, MDCK cell permeability, Lipinski rule of five, and Jorgensen rule of three. The compounds obtained from e-pharmacophore screening were selected as input molecules for analyzing the ADME properties. The molecules showing values within the permissible range were further analyzed with the PAINS (pan-assay interference compounds) filter to screen out false positives.27
Glide docking
For ligand docking, the Glide version 6.1 protocol was used.28 The active site of the prepared protein was defined using default parameters of receptor-grid generation present in the Glide module. Once the receptor grid was generated, the ligands were docked using the XP docking protocol.29 The receptor–ligand complex-interaction scores, ie, G-scores, were calculated based on the equation:
Glide score =0.065× vdW +0.130× Coul + Lipo + Hbond + Metal + BuryP + RotB + Site | (3) |
where vdW signifies van der Waals energy, Coul represents Coulomb energy, Lipo denotes lipophilic term derived from hydrophobic grid potential, Hbond means hydrogen-bonding term, Metal means metal-binding term, BuryP implies penalty for buried polar groups, RotB infers penalty for freezing rotatable bonds, and Site means polar interactions in the active site.
Molecular dynamic simulations
In the present study, Desmond version 3.6 was used to perform the molecular dynamic simulations (MDSs) of all the ligand–protein complexes.30 Using the system-builder option, the simple point charge (SPC) water model was incorporated in the docked protein–ligand complex in an orthorhombic periodic boundary of box volume 813,562 Å3 under solvated conditions. To neutralize the system, one Cl− ion was added depending on the total charge of the system, and a salt concentration of 0.15 M was also added. Further, MDS studies were carried out with a periodic boundary condition in the number of atoms, pressure, temperature (NPT) ensemble, temperature at 300 K, 1 atmospheric pressure, and finally relaxed using the default relaxation protocol integrated in the Desmond. The simulation job was carried out over a period of 10 ns. Root-mean-square deviation (RMSD), root-mean-square fluctuation (RMSF), and total energy of the complexes were analyzed by using event-analysis and simulation-interaction diagrams.
Results and discussion
The present in silico screening approach contains five different filters. HTVS was a primary filter used to screen the database molecules against the active pocket region of human pancreatic lipase protein. Molecules with G-scores more than the standard drug orlistat were selected for further screening. The e-pharmacophore was used as a secondary filter to screen the hits obtained from primary screening, and the hits were further screened using ADME and PAINS filters. The hits obtained from secondary screenings were further analyzed with XP docking to understand the molecular interactions. These docked complexes were refined and validated using molecular dynamic studies.
High-throughput virtual screening
Initial database filtering was performed using the HTVS protocol for restricted conformational sampling to screen out molecules at a faster pace.31 The molecules were docked into the active site of the pancreatic lipase with the generated receptor grid and HTVS option in the precision mode of Glide. The outcome ranked molecules based on docking scores. The docking score of orlistat (G=−6.901) was used as a cutoff, and docking above −7.0 was ranked as best active and below −7.0 as low active compounds. Using this threshold, a total of 14,389 molecules with docking score over −7.0 were identified as potential 1LPB inhibitory molecules and further passed through e-pharmacophore-based screening.
e-Pharmacophore hypothesis generation and database screening
Generation of an e-pharmacophore hypothesis protocol requires a “pose viewer” file of the crystal protein along with the ligand as an input for the generation of pharmacophore. 1LPB was re-docked with inbuilt crystal ligand methoxy undecyl phosphonic acid (MUP) using the Glide XP docking protocol. With the receptor grid and XP option in the precision mode, the molecule was docked into the active site of the pancreatic lipase receptor. This redocked complex was used as an input for the e-pharmacophore to generate a hypothesis. The e-pharmacophore was implemented to screen the molecules obtained from the initial screening. The hypothesis was computed by imposing Glide XP energy properties over pharmacophore sites based on the protein and ligand structural information. The initial number for pharmacophore site generation was set to default; however, a five-pharmacophore site hypothesis AAHHH was generated, as shown in Figure 1. The hydrophobic site H5 lies on the C3 atom, H3 on C6, and last, H4, lies on the C9 atom of MUP. The first acceptor, A1, lies on P–O, and the other acceptor, A2, on the P=O group of the crystal ligand. The generated pharmacophore showed a high enrichment factor of 35.7 and 0.841 GH score. Enrichment factors and GH scores showed that the pharmacophore was able to pick a good number of actives, which in turn explains the effective screening of active molecules from the database. Using the advanced pharmacophore-based screening procedure from the Phase module,32–34 initially 14,389 molecules were screened by choosing “must match five site points out of five sites” as a constraint. Pharmacophore screening resulted in the generation of eight molecules, and the fitness scores and alignment scores are tabulated in Table 1. The fitness-score calculation was based on how strongly the molecule fitted into the active pocket using the pharmacophore sites.
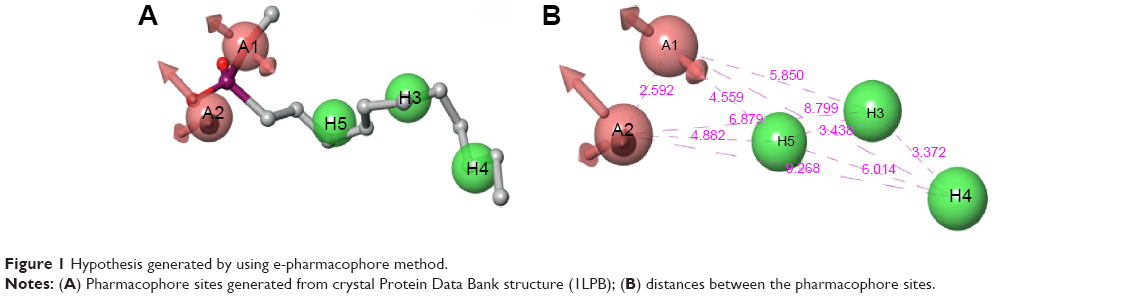 | Figure 1 Hypothesis generated by using e-pharmacophore method. |
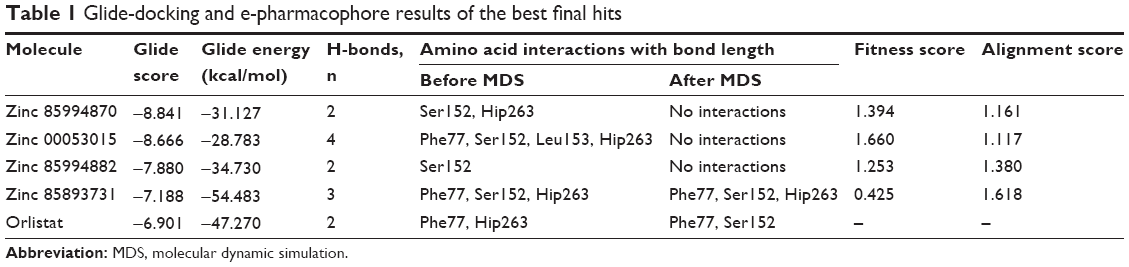 | Table 1 Glide-docking and e-pharmacophore results of the best final hits |
ADME and PAINS filters
The final eight hits were passed through the ADME filter. All the molecules except zinc 85893731 were in the acceptable range. Zinc 85893731 showed violation of Lipinski’s rule of five, and human oral absorption was on the border line. This molecule showed a score of −2 in the central nervous system, indicating its inactiveness. Using the aforementioned inferences, the eight best screened molecules were analyzed using the online PAIN filter portal to evaluate the molecules for false positives (http://cbligand.org/PAINS). All the eight hits passed successfully through the filter (Table 2), and were further subjected to XP docking for thorough analysis.
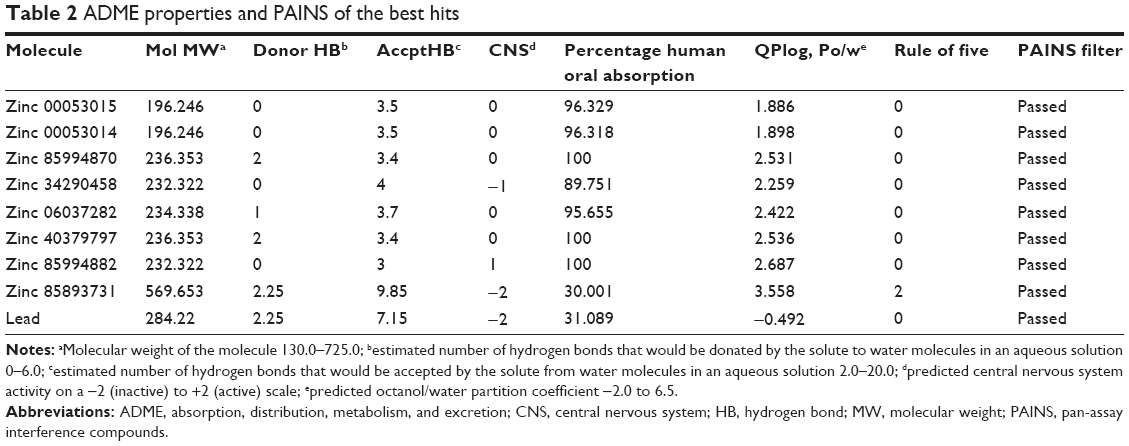 | Table 2 ADME properties and PAINS of the best hits |
Extra-precision docking
XP docking was used to critically analyze favorable interactions between the ligand and protein. The redocked MUP replicated the binding pose and orientation of the crystal ligand, and signified that it was successful in mimicking the native pose. Using the same docking protocol, the pancreatic lipase receptor was docked with the final four selected hits (Table 1). Four other hits were omitted as they have redundant scaffolds. Zinc 85994870 was continued for XP docking by excluding zinc 40379797, zinc 06037282, and zinc 34290458, as they are all the same substructures with slight modifications in the side chains. Further, zinc 85994870 has two hydroxyl groups that have a greater chance of binding with the keto group of Ser152. Both zinc 00053015 and zinc 00053014 are stereoisomers, so zinc 00053014 was expelled from the final list. The remaining two molecules – zinc 85893731 and zinc 85994882 – were taken to docking studies. Along with the final four hits, the FDA-approved drug orlistat was also docked to correlate the docking scores and interactions.
Interaction analysis of orlistat and screened natural compounds in the active site of 1LPB
The nitrogen atom of standard orlistat formed one hydrogen bond with oxygen of Phe77 in the receptor. The oxygen atom of orlistat formed another hydrogen bond with the hydroxyl group of Hip263 (histidine with hydrogens on both nitrogens and positively charged). Orlistat established two hydrogen bonds, with a G-score of −6.901. The 3-D and 2-D interaction profiles of orlistat are depicted in Figure 2A and B. The binding mode of 1LPB–zinc 85994870, depicted in Figure 3A and B, showed two hydrogen-bond interactions: one with Hip263 and the other with the Ser152 residue of the receptor. The nitrogen atom of Hip263 interacted with an oxygen atom of the zinc 85994870–ligand molecule. Ser152 maintained a hydrogen bond with the hydroxyl group of the ligand. The stability of the 1LPB–zinc 85994870 complex was maintained by two strong hydrogen bonds, with glide energy of −31.127 kcal/mol and G-score of −8.841. In the zinc 85994882–1LPB complex (Figure 4A and B), a similar type of hydrogen-bond interaction was observed with Ser152. Overall, one H-bond was observed in the 1LPB–zinc 85994882 complex, with a glide score of −7.880 and energy of −34.730 kcal/mol.
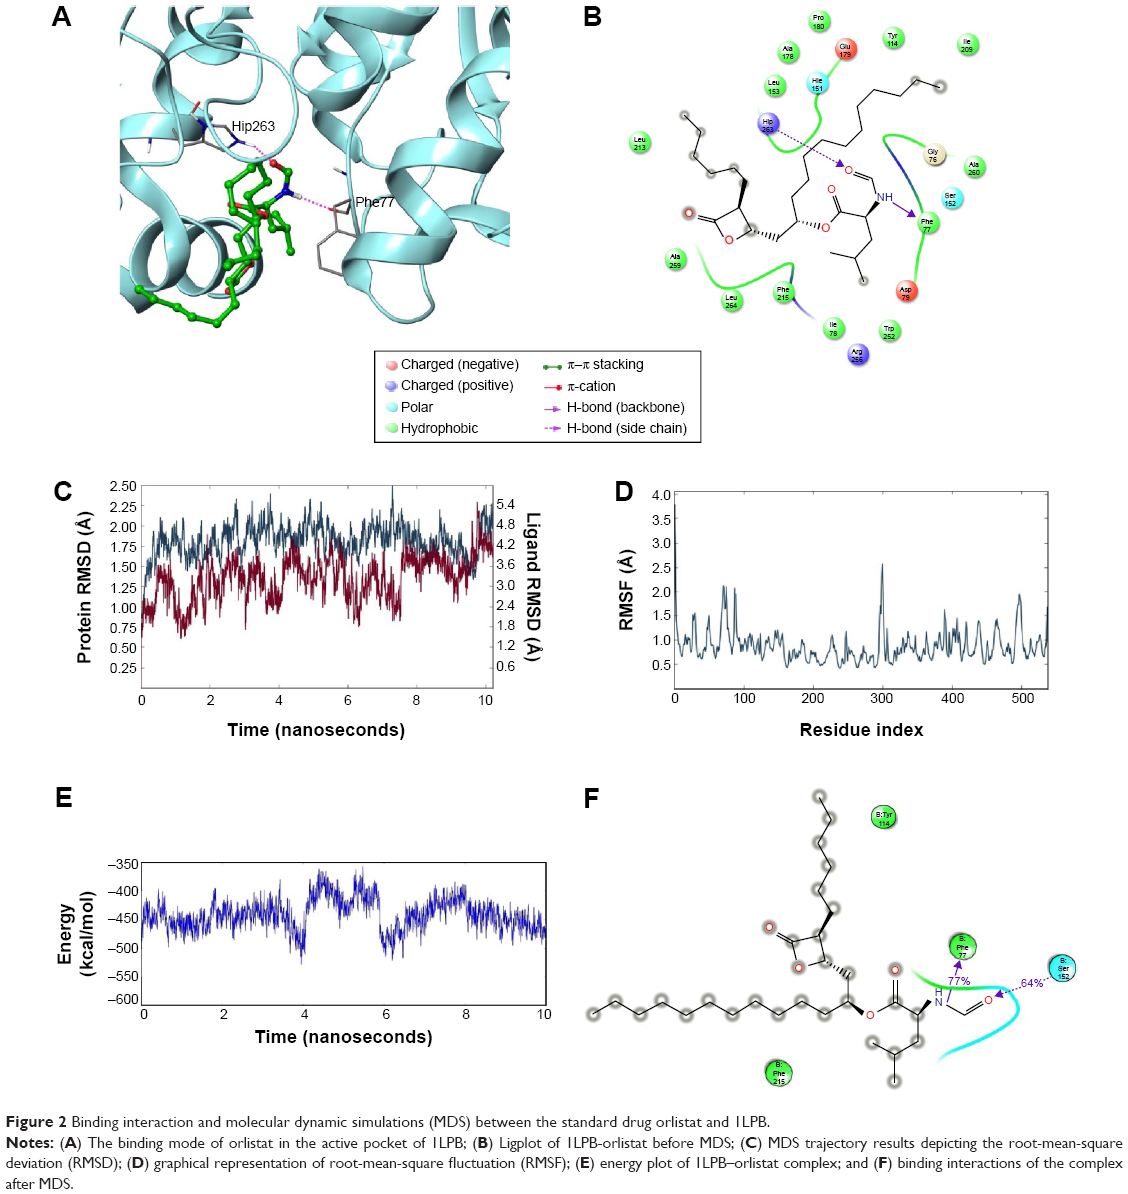 | Figure 2 Binding interaction and molecular dynamic simulations (MDS) between the standard drug orlistat and 1LPB. |
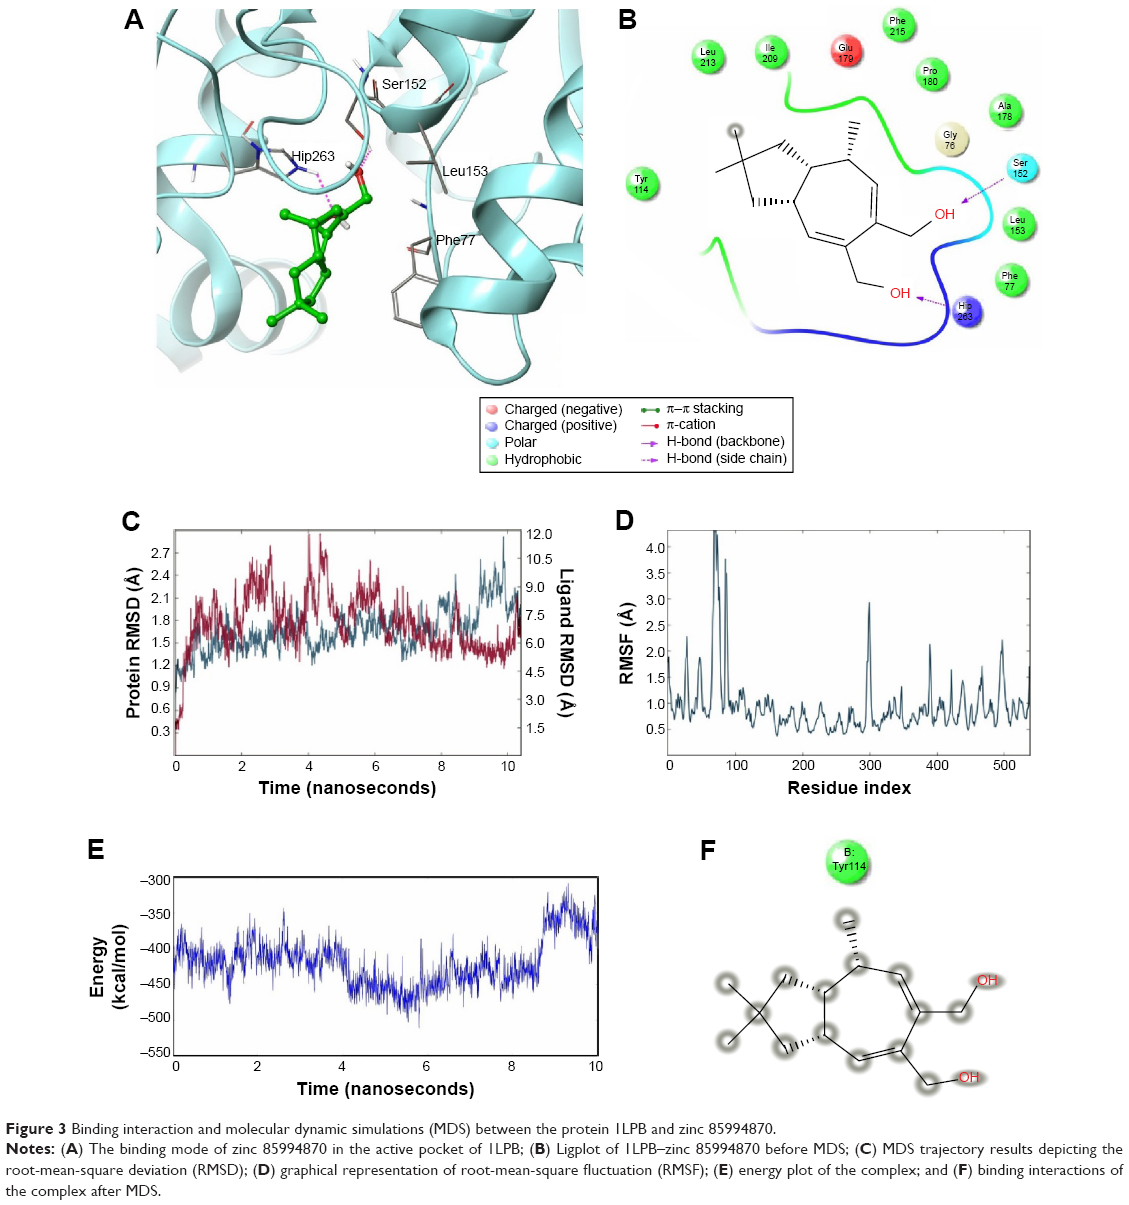 | Figure 3 Binding interaction and molecular dynamic simulations (MDS) between the protein 1LPB and zinc 85994870. |
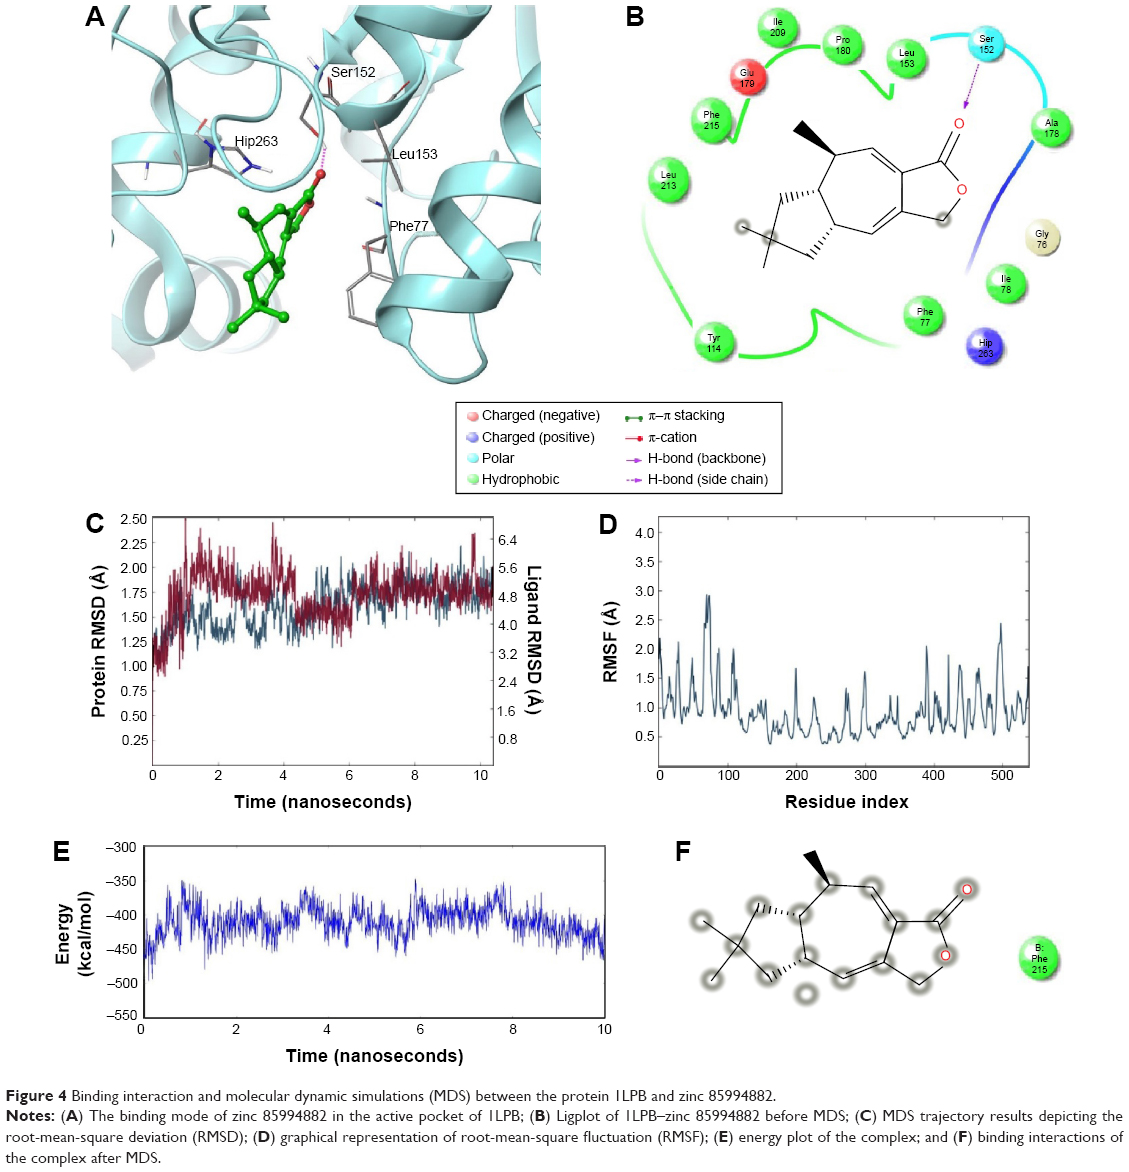 | Figure 4 Binding interaction and molecular dynamic simulations (MDS) between the protein 1LPB and zinc 85994882. |
Figure 5A and B shows the interactions between the 1LPB receptor and the zinc 00053015 complex. The binding affinity between the complexes was maintained by four hydrogen bonds with −28.783 kcal/mol energy. The nitrogen atom of Phe77 and nitrogen atom of Leu153 interacted with an oxygen atom of the ligand via the backbone H-bond. The third hydrogen bond was created between a nitrogen atom of Hip263 with an oxygen atom of the ligand, and the fourth hydrogen bond formed between the crucial Ser152 amino acid residue of the catalytic triad in the receptor with the keto group of the ligand. The overall complex was maintained with a G-score of −8.666.
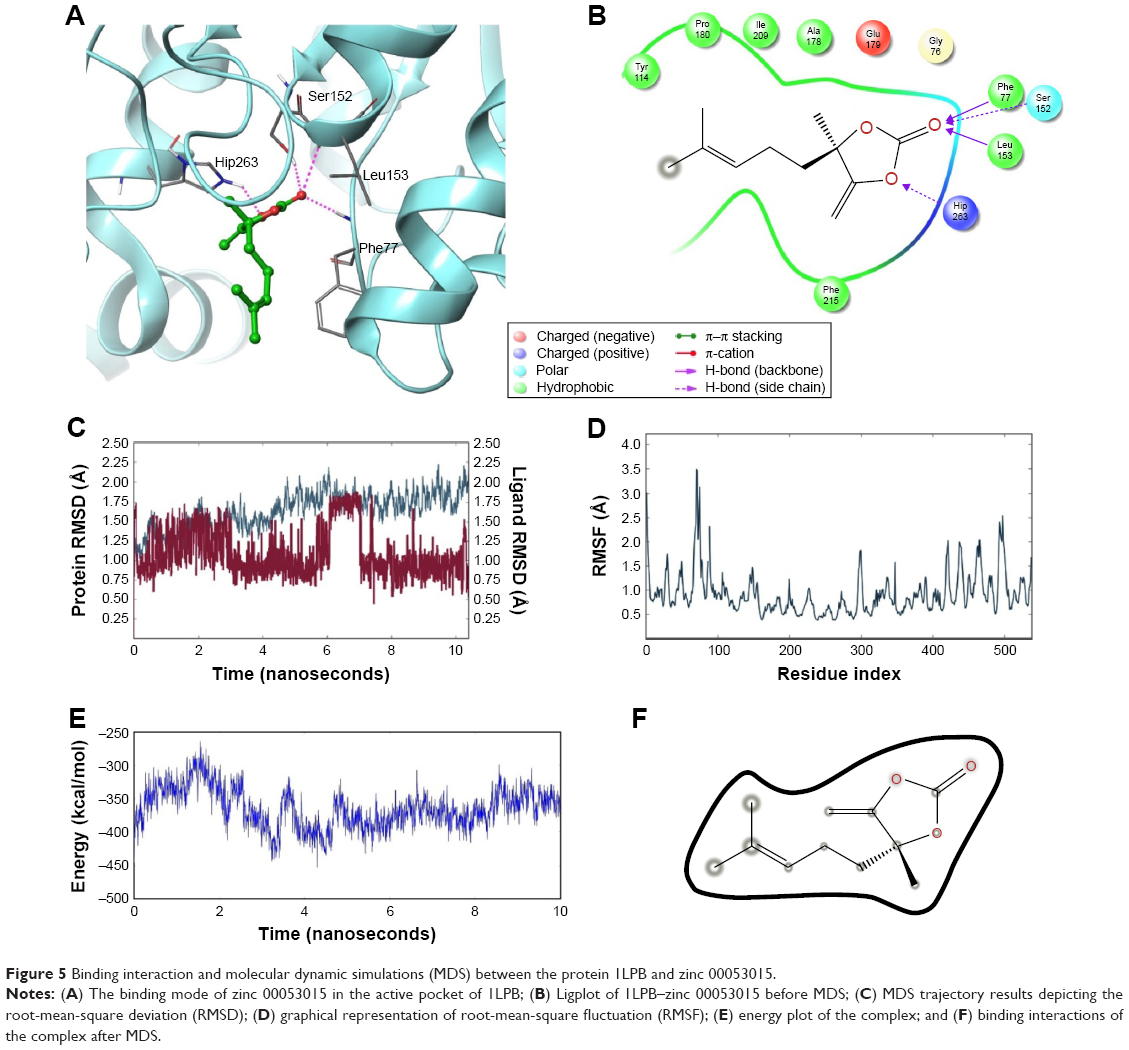 | Figure 5 Binding interaction and molecular dynamic simulations (MDS) between the protein 1LPB and zinc 00053015. |
A total of three H-bond interactions were observed in 1LPB–zinc 85893731 complexes, with a G-score of −7.188. Two side-chain hydrogen bonds were created between the oxygen atom of the ligand of the Hip263 and Ser152 residues depicted in Figure 6A and B. A backbone hydrogen bond was formed between a nitrogen atom of Phe77 residue of the receptor and the OH group of the ligand molecule, with an overall energy of −54.483 kcal/mol.
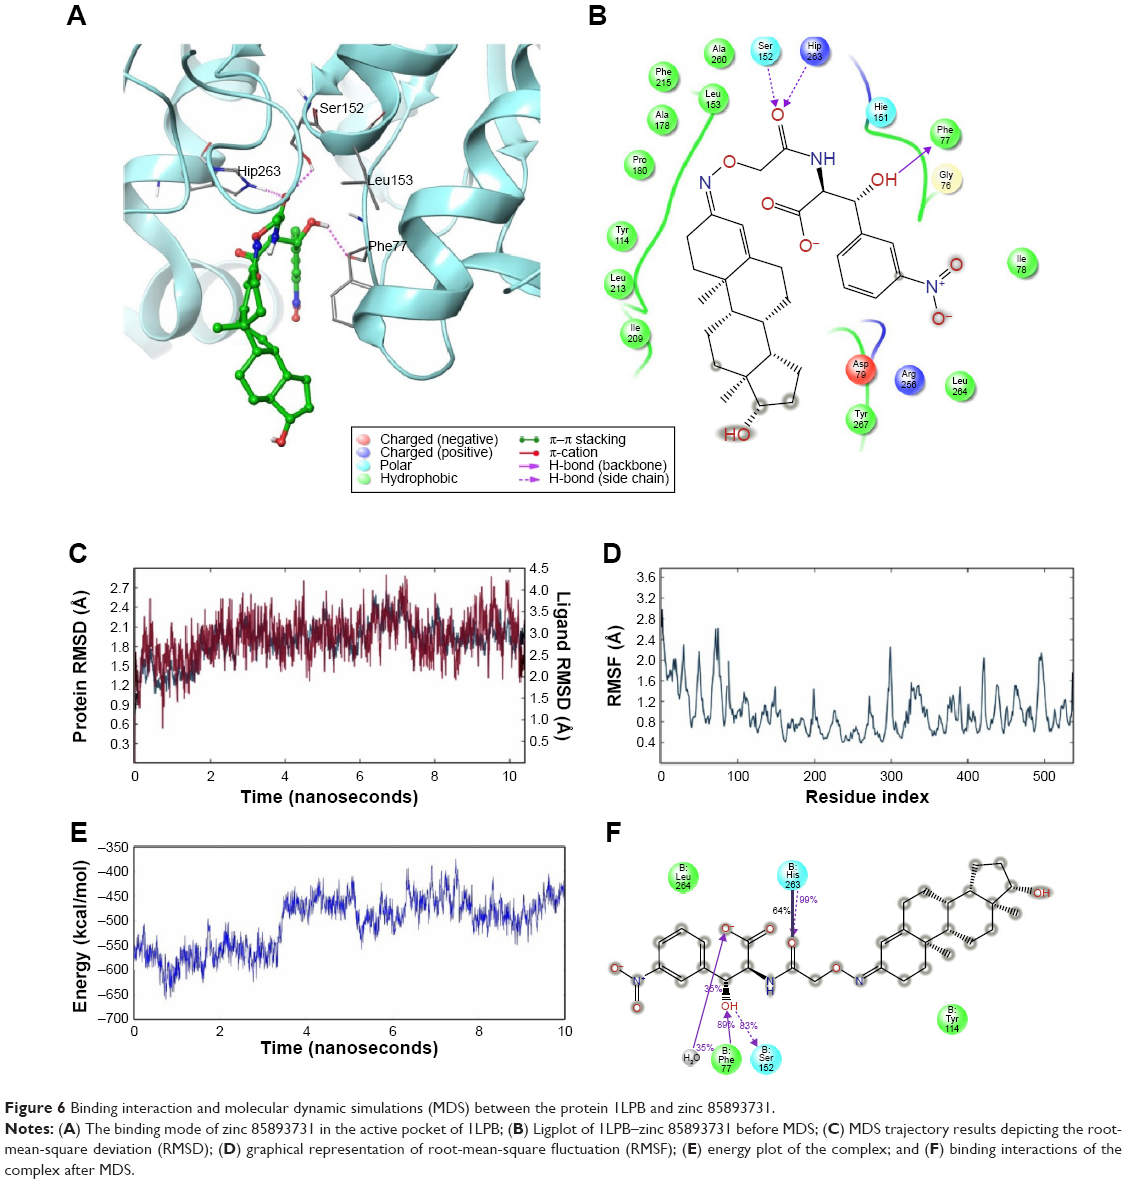 | Figure 6 Binding interaction and molecular dynamic simulations (MDS) between the protein 1LPB and zinc 85893731. |
Ser152 residue is the foremost important residue in the catalytic triad, essential for performing lipolytic activity.35 The enzymatic activity can be triggered by chemical substitutions of Ser152 residue. This occurs when the inhibitor enters the triad pocket binding of the inhibitor with the serine residue, resulting in a chemical shift between the atoms. The docking poses of the final four ligands showed molecular interactions with the critical Ser152 amino acid of the receptor. All the top molecules finalized after screening showed similar orientation in the binding pocket. Most of the hetero groups were pointed toward the uncharged amino acid Ser152, indicating their ability to interact with it. Hydrophobic groups of the molecules penetrated the hydrophobic part of the active site deeply, showing the stability of the molecules in the binding pocket. All the molecules had good fitness scores, and their poses were all well within the binding pocket. Except zinc 85893731, all others were fragment-size molecules, and they could be further explored and optimized for their ability to inhibit pancreatic lipase. The G-scores along with the H-bond length are tabulated in the Table 1.
Molecular dynamic simulations
MDSs provide insights into stable molecular interactions between docked protein–ligand complexes under specific physiological circumstances. A comparative MDS study for 10 ns was conducted for the 1LPB–orlistat docked complex and 1LPB with four docked natural ligand complexes individually. The trajectories of 1LPB with four natural compounds and orlistat complex-binding modes in the MDS study are presented in Table 1. RMSD and RMSF plots were used to investigate the binding affinity between the receptor active site and ligand.
Simulation analysis of 1LPB–orlistat complex
Glide-based docking showed two H-bond interactions between receptor active site residues Phe77 and Hip263 with the standard drug orlistat. At the end of the simulations, binding affinity between the receptor and orlistat showed 64% of H-bond interaction with Ser152, and this interaction was not indicated in the docking results because XP docking was a rigid receptor docking, due to which Ser152 had no flexibility to move toward the functional groups of orlistat ligand molecules to participate in the interaction. However, in MDS, Ser152 was flexible enough to produce interactions. The amino acid residue of receptor Phe77 exhibited 77% H-bond interaction with orlistat. Another H-bond interaction with Hip263 showed 30% between 6 and 10 ns partially. Orlistat exhibited hydrogen-bond interactions with Ser152 and Phe77 residues throughout the 10 ns simulation, with small naps. The energy of the complex was initially stable up to 3.5 ns, followed by fluctuations up to 8 ns. From 8 ns, the overall energy of the complex became quite stable at −450 kcal/mol. The RMSD of orlistat in the binding pocket during the 10 ns simulation showed deviations between 1.2 and 4.8 Å. The 1LPB protein altered its RMSD from 1.25 Å in the starting frame to a maximum of 2.5 Å RMSD. Higher fluctuations were observed between 6 and 8 ns, followed by a stable RMSD up to the final 10 ns. The RMSF fluctuations were maintained below 3.0 Å, indicating a constant binding of receptor amino acid residues with orlistat throughout the simulation time. The ligand maintained a strong hydrogen-bond network with the protein, especially with Ser152 throughout the simulation. The RMSD, RMSF, energy, and molecular interactions after MDS are shown in Figure 2C–F.
Simulation analysis of 1LPB with natural compounds
The 1LPB–zinc 85994870 docked complex was analyzed using a trajectory file obtained from the 10 ns simulation. Initially, the RMSD value remained approximately 1.5 Å up to 8 ns, and from 8 to 10 ns the deviations were increased drastically to a maximum of 3.0 Å in the protein. The ligand RMSD value also showed a greater deviation, starting with 0.3 Å to a maximum of 12 Å. The hydrogen-bond interactions observed in the docking vanished after the MDS. This was due to heavy deviations in the protein and inconsistency in the ligand inside the pocket resulting in breakage of the hydrogen-bond network with the protein. The distance between the ligand and Ser152 was 1.73 Å before simulations, and after MDS the distance was increased to 15.35 Å, making the ligand moving away from the pocket. The RMSF plot of the protein reported high fluctuations above 4.0 Å recorded in the residue 70–90 region. A change in energies during the entire simulation was observed, and fluctuations were between −500 and −300 kcal/mol. The RMSD, RMSF, energy, and interactions after MDS are shown in Figure 3C–F.
The docked 1LPB–zinc 85994882 complex was refined and analyzed using the trajectory data obtained from 10 ns dynamic simulations. The RMSD of the protein was found to be unstable up to 6 ns, ranging from 1.25 to 1.75 Å, and from 6 to 10 ns the RMSD of the protein was stable at 1.75 Å. The ligand RMSD initially indicated 3.2 Å, followed by an increase up to 6.4 Å at 2 ns. Maximum RMSD of 6.5 Å was seen between 1.5 and 4 ns, followed by a decrease to 4.0 Å, and ligand RMSD was found to be stable between 4.5 and 6 ns. From 6 ns, ligand became stable, with an RMSD approximately 4.8 Å. The RMSF of the protein plotted was between 0.5 and 3.0 Å. The maximum RMSF was seen between residues 70 and 90. The energy of the molecule fluctuated between −450 and −350 kcal/mol, and changes in the energy graph were observed throughout the simulation. Even though there was stability in protein and ligand RMSD at the end of the 10 ns time period, the molecule tended to move away from the binding pocket. This was due to higher deviations of the protein in the initial stages, leading to movement of the ligand molecule away from the binding pocket. The distance between the receptor’s important amino acid Ser152 and the ligand was calculated: 1.85 Å before MDS and 8.47 Å after MDS. The RMSD, RMSF, energy, and interactions after MDS are shown in Figure 4C–F.
The 1LPB–zinc 0053015 complex was able to form hydrogen bonding with the Ser152, Phe77, and Hip256 amino acids of the receptor during docking studies. These interactions disappeared during dynamic simulations due to the conformational change in the protein, resulting in a weaker hydrogen-bonding framework between the binding pocket amino acids and the ligand. The deviations in protein RMSD were maintained between 1.25 and 2.0 Å during the simulation run. In the initial 6 ns time interval, high numbers of deviations were recorded, with a peak reaching to 2.25 Å, and from there the protein RMSD became stable approximately 2.0 Å and continued throughout the end of the 10 ns simulation. Ligand RMSD was recorded between 0.75 and 1.75 Å. Between 6 and 7 ns, there was a maximum raise in the RMSD. After that interval, a constant RMSD was recorded approximately 1.00 Å. The RMSF plot of the protein indicates high fluctuations especially between residues 70 and 90 inclining to 3.5 Å, whereas the remaining amino acid residues recorded low fluctuations below 2.5 Å. The overall energy of the complex was unstable up to the 8 ns time interval and later stabilized throughout the 10 ns simulations, maintaining approximately −350 kcal/mol. Initially, a hydrogen bond with a 2.0 Å distance was observed between the ligand and Ser152 residue, which moved away from the residue with the simulations and finally exhibited 10.41 Å by the end of MDS. With these observed deviations and energy instability in the early 2 ns, the ligand molecule moved away from the binding pocket by breaking all the hydrogen bonds. The RMSD, RMSF, energy, and interactions after MDS are shown in Figure 5C–F.
In the docked molecular complex of 1LPB–zinc 85893731, the ligand molecule interacted with the Phe77, Hip263, and Ser152 residues of the receptor via the hydrogen bond. This complex continued the same type of interaction with all the three amino acids throughout the simulation. The binding affinity of the protein–ligand complex was strengthened by these H-bond contacts. The ligand molecule showed an 83% hydrogen bond with Ser152, which is an important amino acid of the catalytic triad in performing lipolysis activity. The other two residues showed 99% (Hip263) and 89% (Phe77) hydrogen bonding with the ligand. RMSD deviations in the 1LPB protein were noticed between 1 Å at the starting point and 2.7 Å at the 6 ns time interval. A consistent RMSD approximately 2.1 Å was maintained throughout the simulation interval. Maximum numbers of deviations were recorded between 6 and 8 ns. The overall deviations in the protein throughout simulations were stable, and remained below 3.0 Å. Whereas the ligand showed the same type of deviations in the initial 2 ns, a small increase at approximately 7.5 ns was noticed and overall deviations were recorded between 3 and 4 Å. RMSF fluctuations were seen between 0.8 and 2.8 Å. Both the ligand and protein showed consistent RMSD from 2.5 ns to the last simulation frame. On average, fluctuations were low, indicating the strong binding affinities between the protein and ligand. The distance between the ligand and the Ser152 molecule showed very small difference in before and after MDS: 2.04 and 2.05 Å, respectively. The RMSD, RMSF, energy, and interactions after MDS are shown in Figure 6C–F.
Based on these observations, huge deviations were noted in the RMSD of the protein–ligand docked complex, leading to the instability in the hydrogen-bond network between complexes except in 1LPB–zinc 85893731. The presence of extra hydrogen bonding and salt-bridge formation in 1LPB–zinc 85893731 and low structural alterations made the complex more stable throughout the dynamics, which was lacking in other complexes. The protein fluctuations, especially between residues 70 and 90 other than the 1LPB–zinc 85893731 complex, were high, particularly in the colipase part. Interestingly, zinc 85893731 showed a greater percentage of interaction with Ser152 than orlistat, which was a sign of better activity. From the MDS analysis, it was clear that 1LPB–zinc 85893731 was the only molecule found to produce better results when compared to the other molecules. Therefore, zinc 85893731 was identified as the lead molecule among the screened molecules.
Lead identification and optimization
In the docking methodology, the final four hits showed H-bond interactions with Ser152 of the catalytic triad of the receptor. However, when they were subjected to MDS, their H-bond network with Ser152 disappeared, due to the conformational changes in both the protein and ligand. Changes in the confirmations of the molecules were due to the low fitness in the binding pocket, and even the hydroxyl group of Ser152 residue changed its orientation. The only molecule that was stable throughout the simulation was zinc 85893731, showing all the best features, like a hydrogen bond with Ser152, stable hydrogen-bond network throughout the MDS, and moderate fitness in the binding pocket. In spite of these good features, there are some other features like molecular weight that can degrade the quality of the lead molecule in the later stages of drug-discovery pipeline. The main feature that should be considered is its applicability to Lipinski’s rule of five. It has a molecular weight of 569.65 D, and this is due to the presence of bulky groups and higher number of rotatable bonds, which may decrease its activity. Considering all these facts, the molecule needed to be optimized further to enhance its activity. The optimization of the molecules involved the reduction of bulky groups that have no involvement in the interaction network.
Implications
The zinc 85893731 molecule was cleaved into two parts: an active part and an inactive part. Hydrogen was added to the active part and further minimized with an OPLS-2005 force field. After minimization, the molecular weight was checked and was 284.22 D, which was half of the lead molecule, and this satisfied the Lipinski’s rule of five. The active part was subjected to the same docking and simulation protocols implanted on the lead molecule. The same orientation was retained after XP docking with the same number of H-bonds similar to the lead molecule depicted in Figure 7A and B with a slight increase in G-score (−7.4), but the Ser152 H-bond was shifted to another atom (OH) of the same molecule after MDS. The distance between the ligand and the residue was 2.19 Å, and after a shift in the H-bond produced a small reduction in the distance, measuring 2.11 Å. Interestingly, after the MDS, a hydrogen-bond network was seen with a slight increase in the percentage of interactions, and this was mainly due to the removal of the bulky group that makes the molecule lighter and free from external forces. The RMSD, RMSF, energies plot, and interactions after MDS showed stability in the simulation studies represented in Figure 7C and F. At the same time, the fitting of the molecule was best in the binding pocket compared to previous accommodation (Figure 8). This complex was continued for 50 ns MDS, and consistency in the H-bond interaction between the important amino acid and the ligand was observed. Strikingly, 98% of the interaction with Ser152 residue was produced by the end of the 50 ns run time. This result suggested that the H-bond network in the complex became very strong with increased simulation time. The RMSD, RMSF, protein–ligand contact profiles, and the ligand-torsion profile are appended in the Supplementary material.
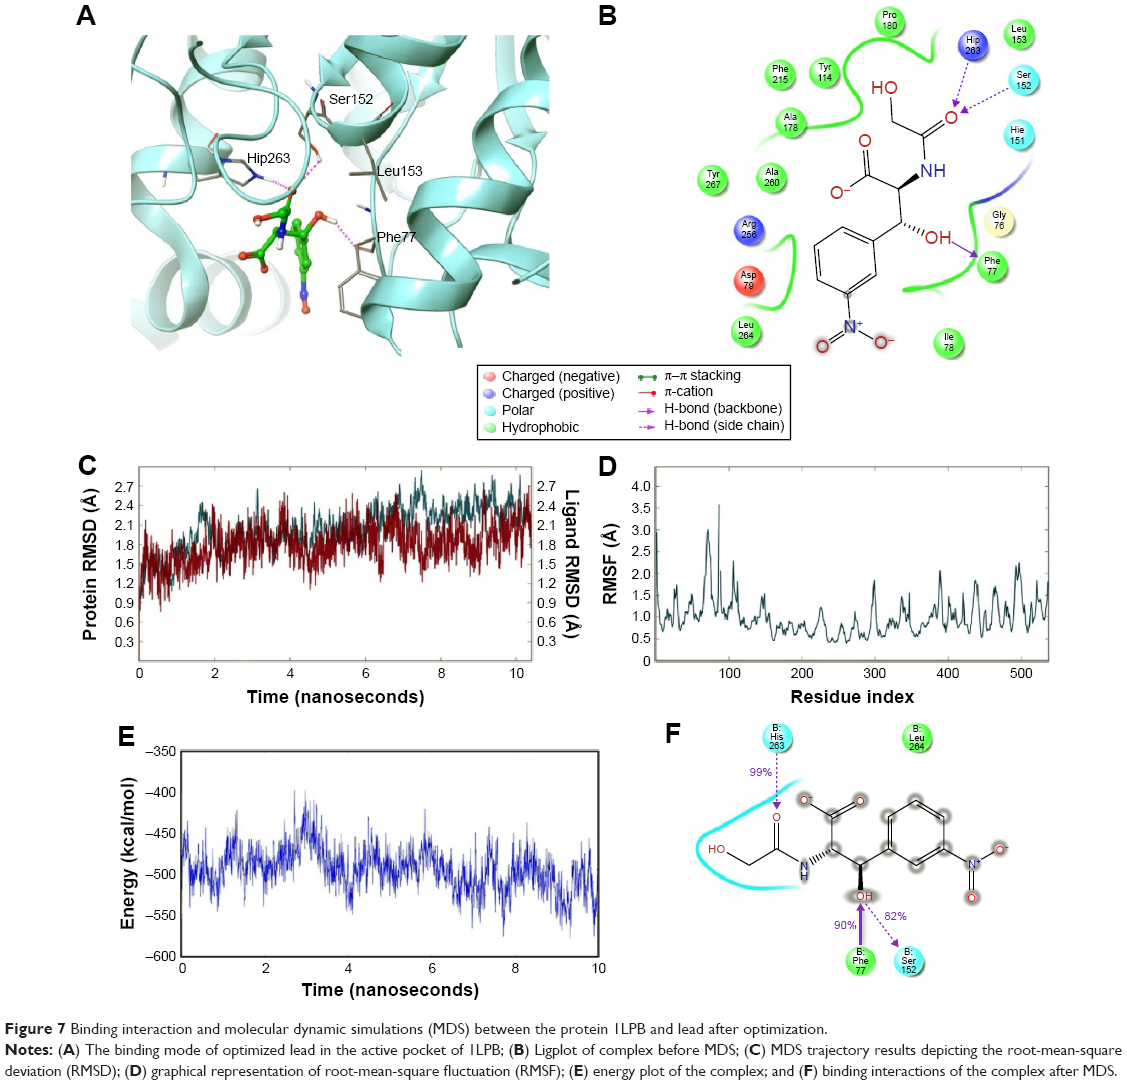 | Figure 7 Binding interaction and molecular dynamic simulations (MDS) between the protein 1LPB and lead after optimization. |
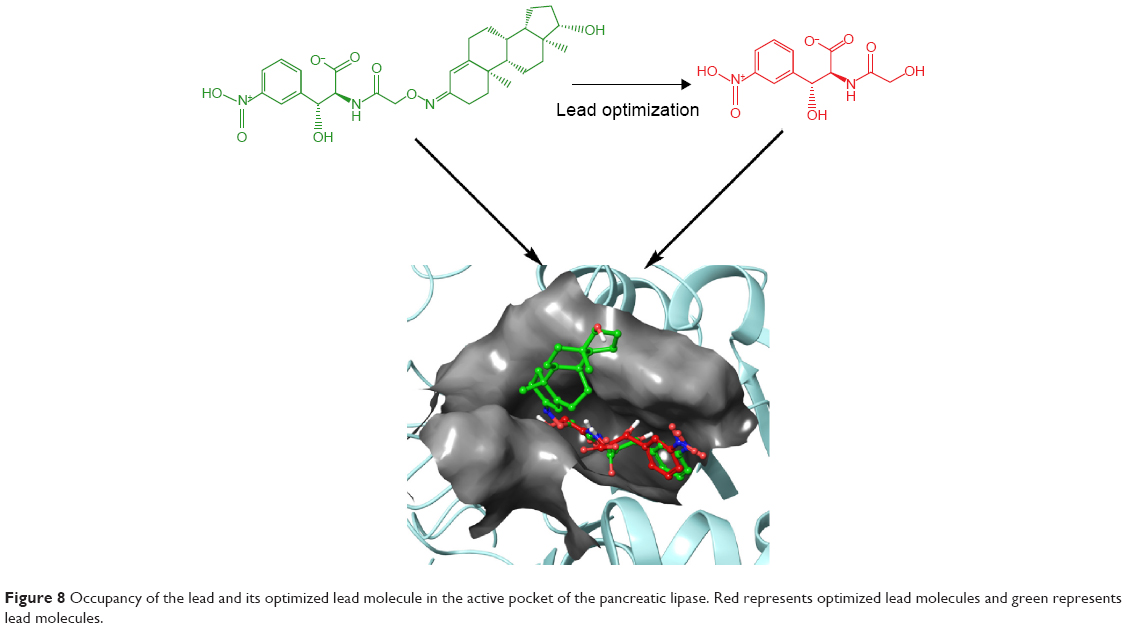 | Figure 8 Occupancy of the lead and its optimized lead molecule in the active pocket of the pancreatic lipase. Red represents optimized lead molecules and green represents lead molecules. |
Conclusion
Current drugs approved for treating obesity do not give satisfactory results, and on prolonged usage result in severe side effects. In view of the drastic increase in the obese population day-to-day, there is a great need to discover new drugs with lesser side effects. Using the structural information of pancreatic lipase with MUP, HTVS combined with e-pharmacophore screening was implemented on the natural ligand-molecule Zinc database. This was followed by XP docking and MDS to identify the stability of the screened ligand molecules in the binding pocket of the 1LPB receptor. The hits retrieved at the end of screening displayed four varied scaffolds. Based on the docking results, the four hits bound to the important catalytic triad residue Ser152. Lead optimization produced much better results, indicating improvement in pharmacokinetic characters of the lead molecule. This approach has delivered an innovative path leading to the identification of a potent inhibitor against the target receptor pancreatic lipase computationally.
Acknowledgments
The authors would like to thank the Department of Biotechnology, K L University, for their support and facilities provided in performing this study. Special thanks to Pardhasaradhi Mathi and V Sandeep for their valuable suggestions.
Disclosure
The authors report no conflicts of interest in this work.
References
Kopelman PG. Obesity as a medical problem. Nature. 2000; 404(6778):635–643. | ||
Jebb S. Obesity: causes and consequences. Womens Health Med. 2004;1(1):38–41. | ||
Finer N. Medical consequences of obesity. Medicine. 2006;34(12):510–514. | ||
World Health Organization. 10 Facts on obesity. 2010. Available from: http://www.who.int/features/factfiles/obesity/en. Accessed June 24, 2015. | ||
Shi Y, Burn P. Lipid metabolic enzymes: emerging drug targets for the treatment of obesity. Nat Rev Drug Discov. 2004;3(8):695–710. | ||
Mukherjee M. Human digestive and metabolic lipases – a brief review. J Mol Catal B Enzym. 2003;22(5):369–376. | ||
Thomson A, De Pover A, Keelan M, Jarocka-Cyrta E, Clandinin M. Inhibition of lipid absorption as an approach to the treatment of obesity. Methods Enzymol. 1997;286:3–44. | ||
Van Tilbeurgh H, Sarda L, Verger R, Cambillau C. Structure of the pancreatic lipase-procolipase complex. Nature. 1992;359(6391):159–162. | ||
Bourne Y, Martinez C, Kerfelec B, Lombardo D, Chapus C, Cambillau C. Horse pancreatic lipase. The crystal structure refined at 2.3 A resolution. J Mol Biol. 1994;238(5):709–732. | ||
Birari RB, Bhutani KK. Pancreatic lipase inhibitors from natural sources: unexplored potential. Drug Discov Today. 2007;12(19–20):879–889. | ||
Martis E, Badve R, Radhakrishnan R. High-throughput screening: the hits and leads of drug discovery – an overview. J Appl Pharm Sci. 2011;1(1):2–10. | ||
Armstrong JW. A review of high-throughput screening approaches for drug discovery. Am Biotechnol Lab. 1999;17(5):26–28. | ||
Fernandes TG, Diogo MM, Clark DS, Dordick JS, Cabral JM. High-throughput cellular microarray platforms: applications in drug discovery, toxicology and stem cell research. Trends Biotechnol. 2009;27(6):342–349. | ||
Fara DC OT, Prossnitz ER, Bologa CG, Edwards BS, Sklar LA. Integration of virtual and physical screening. Drug Discov Today Technol. 2006;3(4):337–385. | ||
Hann MM, Oprea TI. Pursuing the leadlikeness concept in pharmaceutical research. Curr Opin Chem Biol. 2004;8(3):255–263. | ||
Clark RL, Johnston BF, Mackay SP, Breslin CJ, Robertson MN, Harvey AL. The Drug Discovery Portal: a resource to enhance drug discovery from academia. Drug Discov Today. 2010;15(15–16): 679–683. | ||
Egloff MP, Marguet F, Buono G, Verger R, Cambillau C, van Tilbeurgh H. The 2.46 A resolution structure of the pancreatic lipase-colipase complex inhibited by a C11 alkyl phosphonate. Biochemistry. 1995;34(9):2751–2762. | ||
Sastry GM, Adzhigirey M, Day T, Annabhimoju R, Sherman W. Protein and ligand preparation: parameters, protocols, and influence on virtual screening enrichments. J Comput Aided Mol Des. 2013;27(3): 221–234. | ||
Halgren TA, Murphy RB, Friesner RA, et al. Glide: a new approach for rapid, accurate docking and scoring. 2. Enrichment factors in database screening. J Med Chem. 2004;47(7):1750–1759. | ||
Irwin JJ, Shoichet BK. ZINC – a free database of commercially available compounds for virtual screening. J Chem Inf Model. 2005; 45(1):177–182. | ||
Shivakumar D, Williams J, Wu Y, Damm W, Shelley J, Sherman W. Prediction of absolute solvation free energies using molecular dynamics free energy perturbation and the OPLS force field. J Chem Theory Comput. 2010;6(5):1509–1519. | ||
Jorgensen WL, Maxwell DS, Tirado-Rives J. Development and testing of the OPLS all-atom force field on conformational energetics and properties of organic liquids. J Am Chem Soc. 1996;118(45):11225–11236. | ||
Jorgensen WL, Tirado-Rives J. The OPLS [optimized potentials for liquid simulations] potential functions for proteins, energy minimizations for crystals of cyclic peptides and crambin. J Am Chem Soc. 1988;110(6):1657–1666. | ||
Salam NK, Nuti R, Sherman W. Novel method for generating structure-based pharmacophores using energetic analysis. J Chem Inf Model. 2009;49(10):2356–2368. | ||
Negi B, Raj KK, Siddiqui SM, Ramachandran D, Azam A, Rawat DS. In Vitro Antiamoebic Activity Evaluation and Docking Studies of Metronidazole–Triazole Hybrids. Chem Med Chem. 2014;9(11):2439–2444. | ||
QikProp version 3.8 [software]. New York: Schrödinger LLC; 2011. | ||
Baell JB, Holloway GA. New substructure filters for removal of pan assay interference compounds (PAINS) from screening libraries and for their exclusion in bioassays. J Med Chem. 2010;53(7):2719–2740. | ||
Glide version 6.1 [software]. New York: Schrödinger LLC; 2013. | ||
Friesner RA, Murphy RB, Repasky MP, et al. Extra precision glide: docking and scoring incorporating a model of hydrophobic enclosure for protein-ligand complexes. J Med Chem. 2006;49(21):6177–6196. | ||
Jorgensen WL, Maxwell DS, Tirado-Rives J. Development and Testing of the OPLS All-Atom Force Field on Conformational Energetics and Properties of Organic Liquids. J Am Chem Soc. 1996;118(45): 11225–11236. | ||
Caporuscio F, Rastelli G, Imbriano C, Del Rio A. Structure-based design of potent aromatase inhibitors by high-throughput docking. J Med Chem. 2011;54(12):4006–4017. | ||
Phase version 3.7 [software]. New York: Schrödinger LLC; 2013. | ||
Dixon SL, Smondyrev AM, Knoll EH, Rao SN, Shaw DE, Friesner RA. PHASE: a new engine for pharmacophore perception, 3D QSAR model development, and 3D database screening: 1. Methodology and preliminary results. J Comput Aided Mol Des. 2006;20(10–11):647–671. | ||
Dixon SL, Smondyrev AM, Rao SN. PHASE: a novel approach to pharmacophore modeling and 3D database searching. Chem Biol Drug Des. 2006;67(5):370–372. | ||
Winkler FK, D’Arcy A, Hunziker W. Structure of human pancreatic lipase. Nature. 1990;343(6260):771–774. |
Supplementary materials
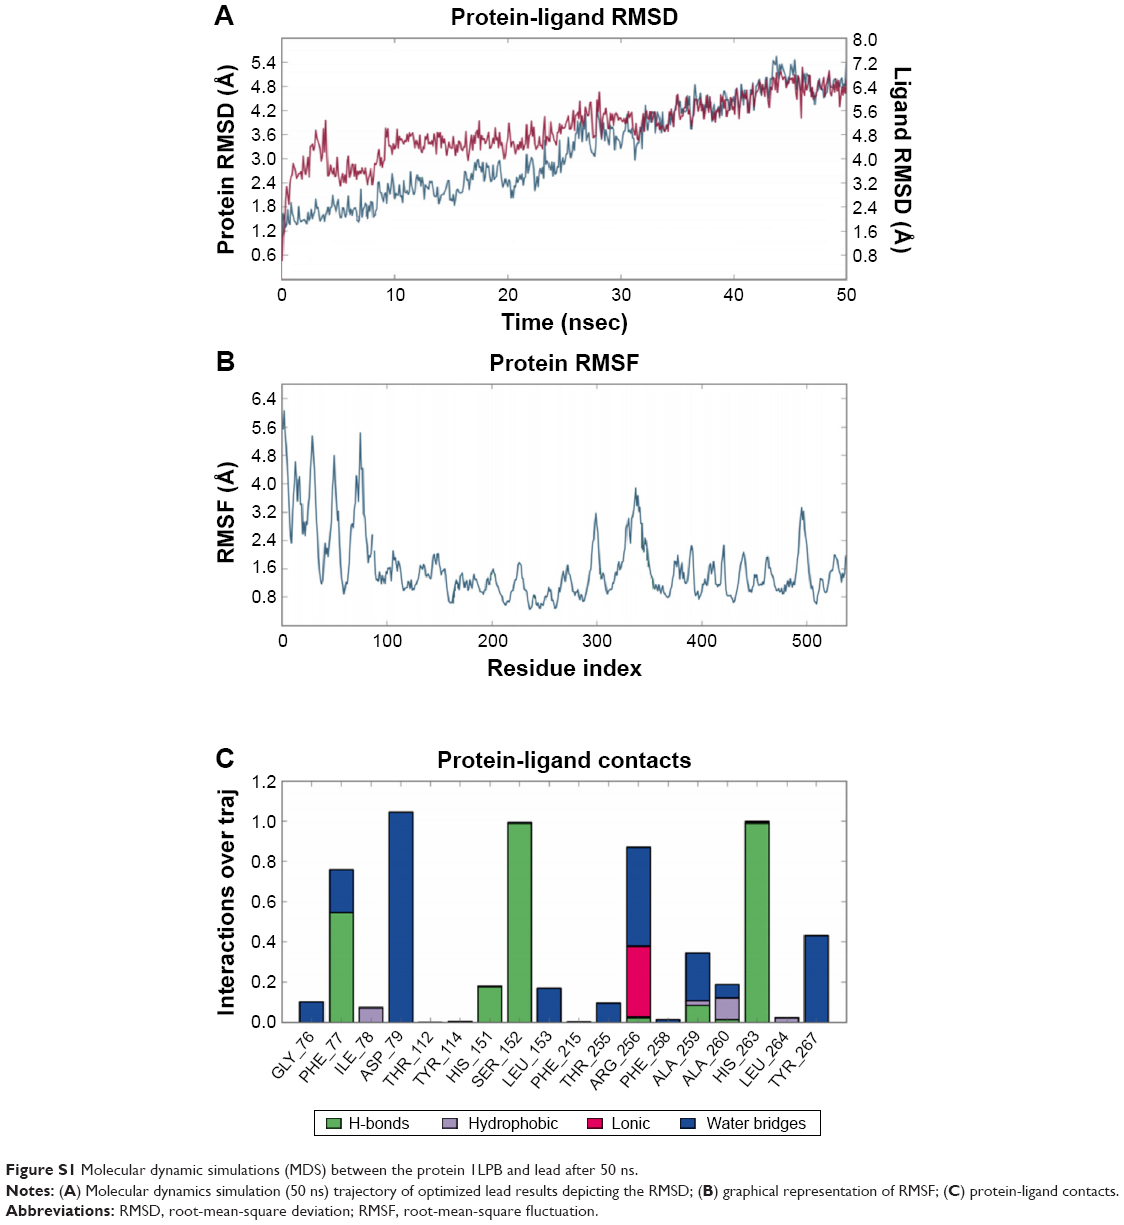 | Figure S1 Molecular dynamic simulations (MDS) between the protein 1LPB and lead after 50 ns. |
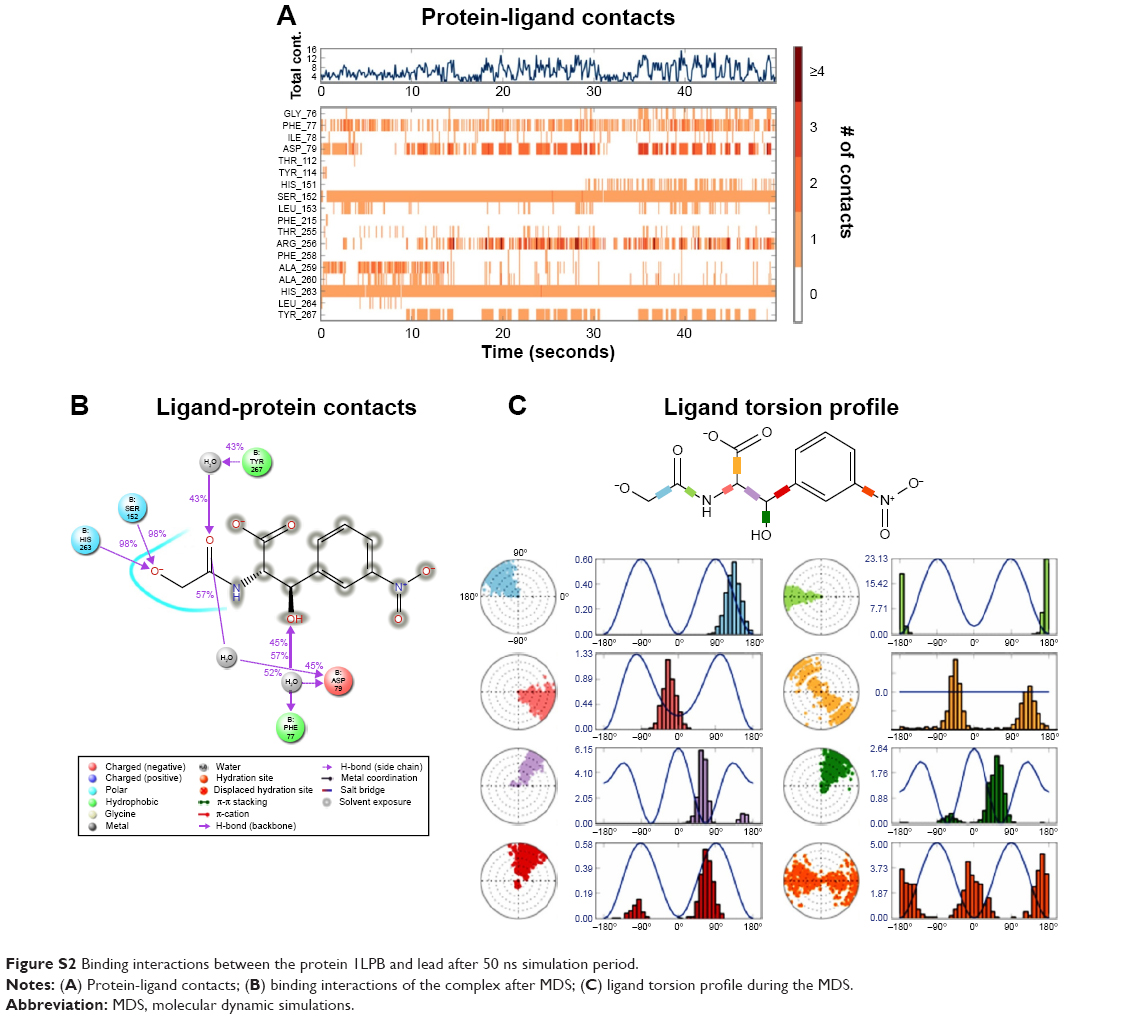 | Figure S2 Binding interactions between the protein 1LPB and lead after 50 ns simulation period. |
 © 2015 The Author(s). This work is published and licensed by Dove Medical Press Limited. The
full terms of this license are available at https://www.dovepress.com/terms
and incorporate the Creative Commons Attribution
- Non Commercial (unported, 3.0) License.
By accessing the work you hereby accept the Terms. Non-commercial uses of the work are permitted
without any further permission from Dove Medical Press Limited, provided the work is properly
attributed. For permission for commercial use of this work, please see paragraphs 4.2 and 5 of our Terms.
© 2015 The Author(s). This work is published and licensed by Dove Medical Press Limited. The
full terms of this license are available at https://www.dovepress.com/terms
and incorporate the Creative Commons Attribution
- Non Commercial (unported, 3.0) License.
By accessing the work you hereby accept the Terms. Non-commercial uses of the work are permitted
without any further permission from Dove Medical Press Limited, provided the work is properly
attributed. For permission for commercial use of this work, please see paragraphs 4.2 and 5 of our Terms.