Back to Journals » Cancer Management and Research » Volume 10
High EIF2B5 mRNA expression and its prognostic significance in liver cancer: a study based on the TCGA and GEO database
Authors Jiao Y ![]() , Fu Z
, Fu Z ![]() , Li Y, Meng L, Liu Y
, Li Y, Meng L, Liu Y ![]()
Received 27 August 2018
Accepted for publication 23 October 2018
Published 20 November 2018 Volume 2018:10 Pages 6003—6014
DOI https://doi.org/10.2147/CMAR.S185459
Checked for plagiarism Yes
Review by Single anonymous peer review
Peer reviewer comments 2
Editor who approved publication: Dr Antonella D'Anneo
Yan Jiao,1 Zhuo Fu,2 Yanqing Li,3 Lingyu Meng,1 Yahui Liu1
1Department of Hepatobiliary and Pancreatic Surgery, The First Hospital of Jilin University, Changchun, Jilin 130021, People’s Republic of China; 2Department of Hand and Foot Surgery, The First Hospital of Jilin University, Changchun, Jilin 130021, People’s Republic of China; 3Department of Pathophysiology, College of Basic Medical Sciences, Jilin University, Changchun, Jilin 130021, People’s Republic of China
Purpose: Liver cancer is a high mortality disease with no curable treatments. Posttranscriptional modifications play essential roles in the occurrence and the progression of liver cancer. EIF2B5 is a subunit of EIF2B that regulates the initiation and the rate of translation and participates in several diseases including tumors. This study aims to elucidate the prognostic significance of EIF2B5 in liver cancer.
Materials and methods: We used The Cancer Genome Atlas database to analyze the expression of EIF2B5 in liver cancer. Then we used chi-squared and Fisher exact tests to test the correlation between clinical characteristics and EIF2B5 expression. Finally, we assessed the role of EIF2B5 in prognosis by Kaplan–Meier curves and Cox analysis. Gene set enrichment analysis was performed by using The Cancer Genome Atlas data set.
Results: The results showed that EIF2B5 was upregulated in liver cancer, and the expression was related to histologic grade, clinical stage, and vital status. Moreover, Kaplan–Meier curves and Cox analysis implicated that highly expressed EIF2B5 correlated with poor prognosis, and EIF2B5 was an independent risk factor for liver cancer. Gene set enrichment analysis showed that ATR and BRCA pathway, cell cycle pathway, DNA repair, myc signaling pathway, and E2F targets are differentially enriched in EIF2B5 high-expression phenotype.
Conclusion: Our results suggest that EIF2B5 participated in cancer progression and could become a biomarker for the prognosis of patients with liver cancer.
Keywords: liver cancer, EIF2B5, prognosis, diagnosis
Introduction
Cancer is a high mortality disease and gives rise to an enormous burden all over the world. Liver cancer, as the second leading cause of cancer-related death, most frequently occurs in East and South-East Asia and Northern and Western Africa.1 Despite the rapid development of medical technology, there are still no curable strategies for liver cancer patients. Therefore, identifying specific markers that evaluate the progression of liver cancer has great clinical significance.
Posttranscriptional modifications play important roles in the initiation and the progression of tumors. EIF2B is a multimeric G-protein complex that comprises five subunits, termed α to ε, and were coded by genes EIF2B1 to EIF2B5.2 EIF2B plays a vital role in translation initiation and regulation.3 The first disease of mutation in EIF2B was described in Vanishing White Matter syndrome (VWM), also called childhood ataxia with central nervous system hypomyelination.4–6 Recently, EIF2B5 has been identified as a biomarker of novel stage in colorectal cancer progression;7 however, whether EIF2B5 could also be a specific marker in liver cancer remains to be elucidated.
In the present study, we have evaluated the expression of EIF2B5 in liver cancer, analyzed the relationship between EIF2B5 expression and clinical features, and explored the potential prognostic significance of EIF2B5 in patients with liver cancer. Gene set enrichment analysis (GSEA) was performed to gain further insight into the biological pathways involved in liver cancer pathogenesis related to the EIF2B5 regulatory mechanism.
Materials and methods
Data mining and collection
The data of liver cancer patients and RNA-seq expression results were downloaded with RTCGA Toolbox package in R (version 3.5.1).8,9 The gene microarray with survival data (GSE54236, GSE76427) was downloaded from the GEO database (https://www.ncbi.nlm.nih.gov/geo/).
Statistical analyses
SPSS software 19.0 (IBM Corporation, Armonk, NY, USA) was used for data analyzing. Boxplots were used for discrete variables to measure the expression differences, and chi-squared and Fisher exact tests were used to examine the correlation between EIF2B5 expression and clinical data. Receiver-operating characteristic curve (ROC) was drawn by pROC package to evaluate the capability of diagnosis and divide patients into high and low EIF2B5 expression groups by the optimal cutoff value of OS determined by the Youden index.10 Kaplan–Meier curves were used to compare the differences in the overall survival and relapse-free survival by using survival package in R.11,12 Univariate Cox analysis was used to select the related variables. Then, the Multivariate Cox analysis was applied for the influence of EIF2B5 expression on the overall survival and relapse-free survival of patients.
GSEA
GSEA is a computational method that determines whether an a priori defined set of genes shows statistically significant, concordant differences between two biological states.13,14 In this study, GSEA was performed by using the GSEA software 3.0 from the Broad Institute. The gene expression data were RNAseq data from TCGA-LIHC. The gene set of “c2.cp.biocarta.v6.2.symbols.gmt” and “h.all.v6.2.symbols.gmt”, which summarizes and represents specific, well-defined biological states or processes, was downloaded from the Molecular Signatures Database (http://software.broadinstitute.org/gsea/msigdb/index.jsp). The normalized enrichment score (NES) was acquired by analyzing with permutations for 1,000 times. A gene set is considered to be significantly enriched when a normal P-value is <0.05 and false discovery rate (FDR) is <0.25.
Results
Patients’ characteristics
Both gene expression and clinical data of patients with liver cancer were downloaded from The Cancer Genome Atlas (TCGA) database. The total number of patients was 373. The detailed clinical characteristics, including TNM stage, survival status, and residual tumor status, are shown in Table 1.
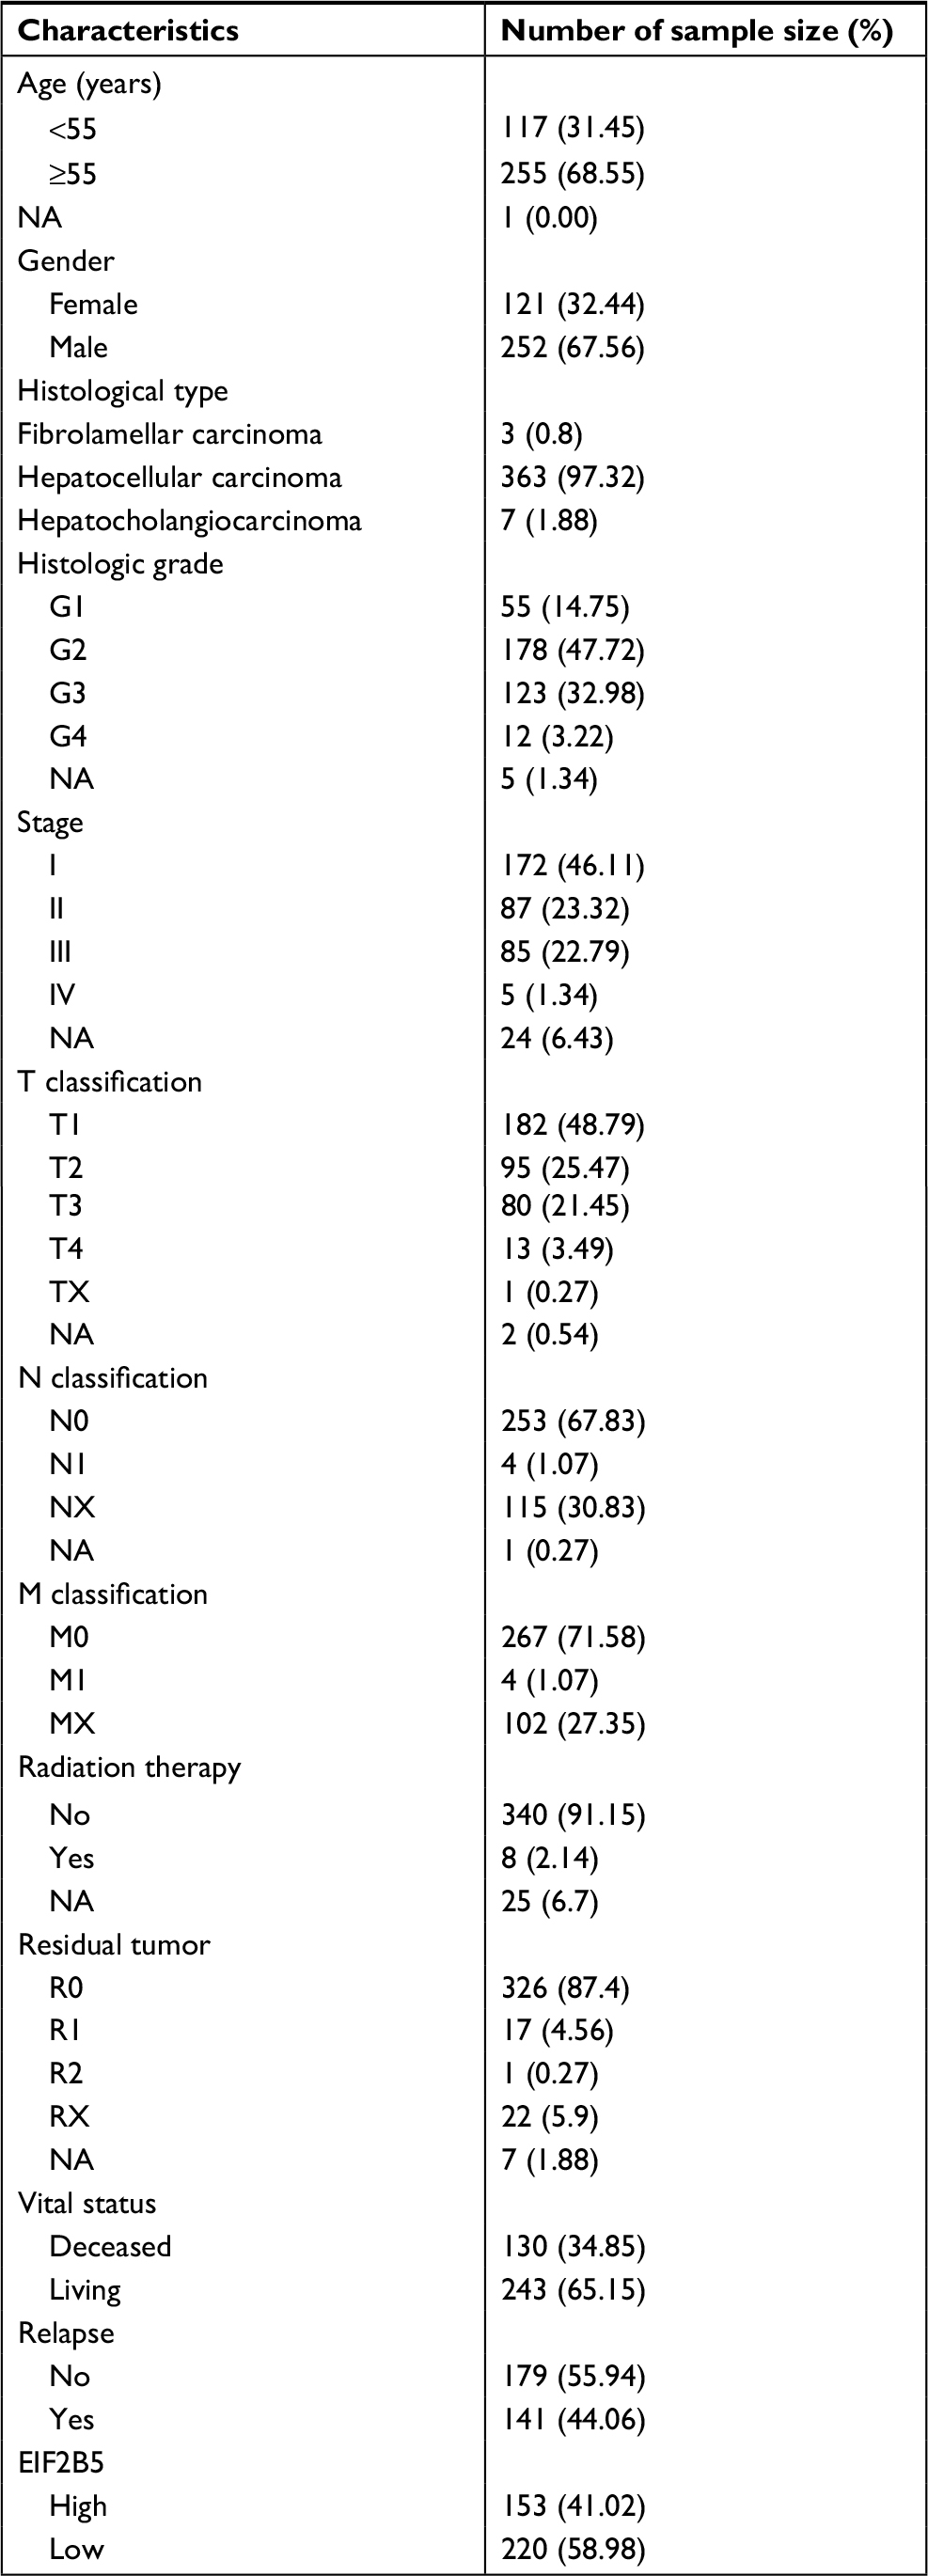 | Table 1 Clinical characteristics of the included patients Abbreviation: NA, not available. |
High EIF2B5 mRNA expression in liver cancer
The expression analysis of EIF2B family in TCGA provides a unique insight into EIF2B5 in hepatocellular carcinoma (HCC; Figure S1). Using boxplots, we measured the differences in EIF2B5 expression in liver cancer patients and normal people. As shown in Figure 1A, we found that the expression of EIF2B5 in patients was higher (P=1.7e–06). Moreover, there were also different EIF2B5 expressions in the groups by histologic grade (P=0.018), stage (P=0.019), and vital status (P=0.0024; Figure 1B–D). Of note, EIF2B5 expression of hepatitis/fatty change/cirrhosis is lower than that in normal and HCC (Figure 1E–G).
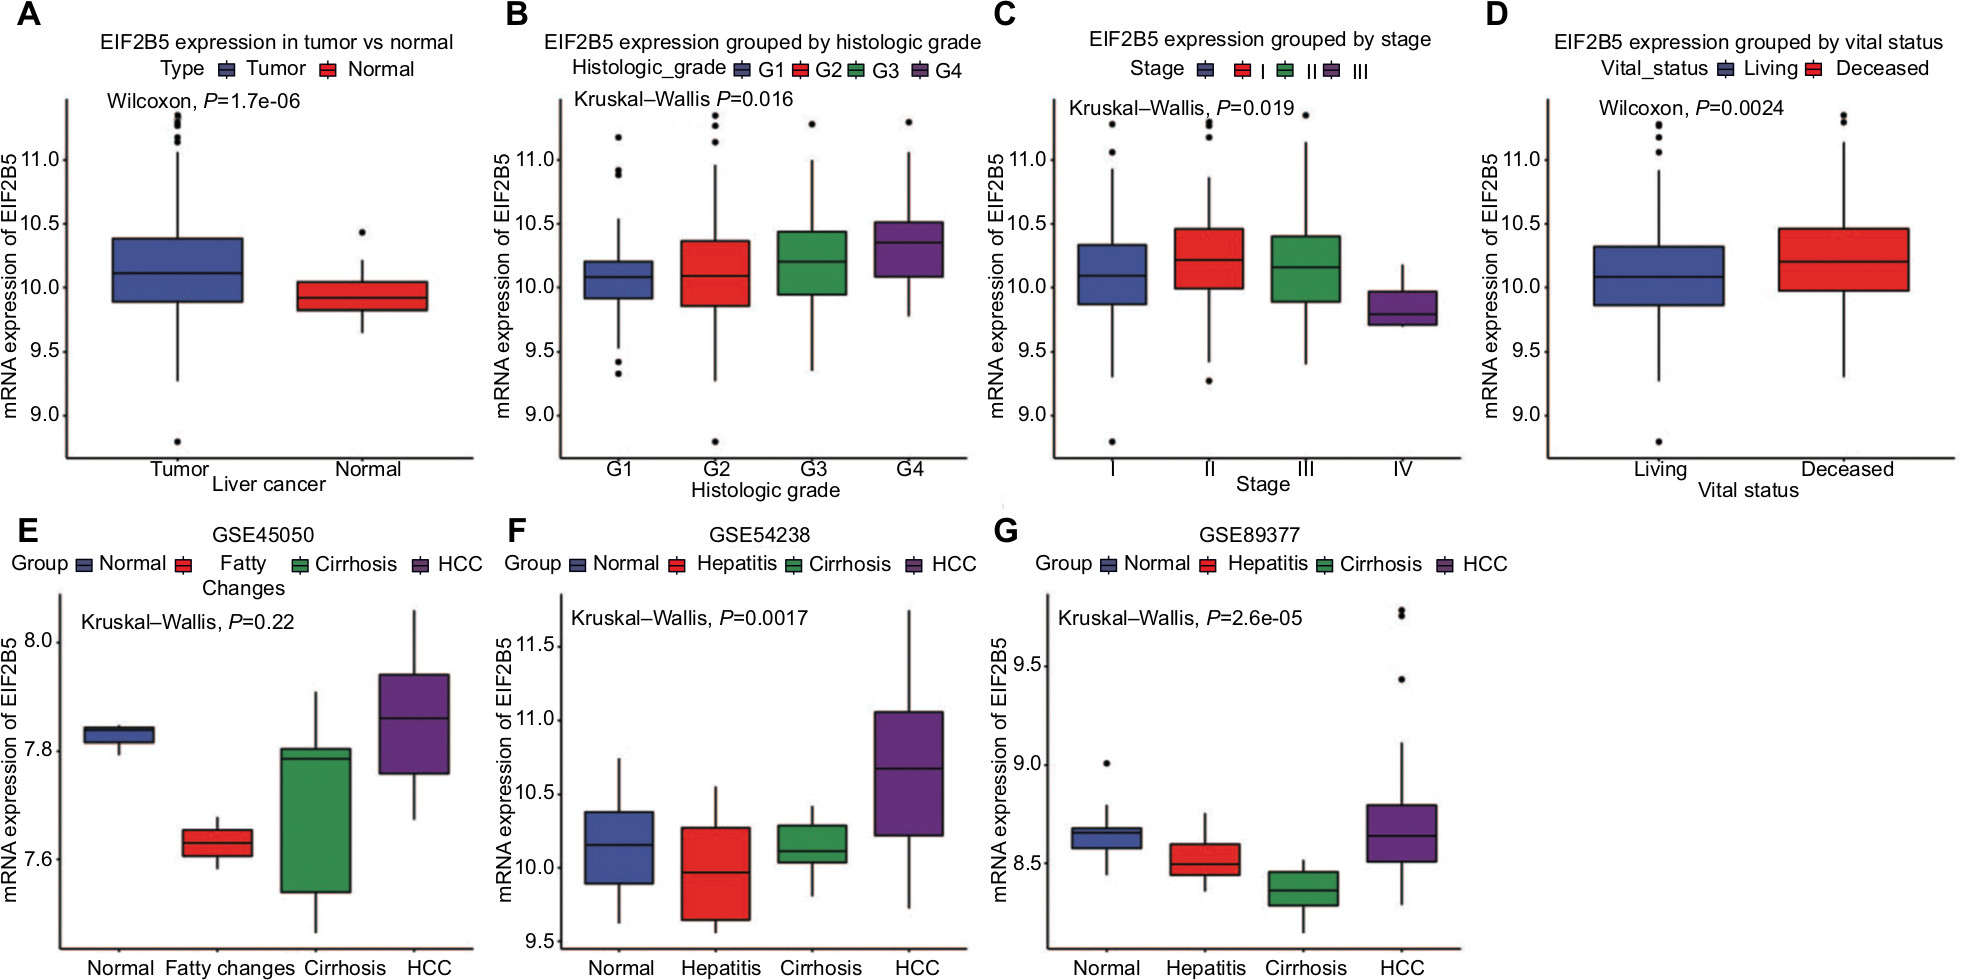 | Figure 1 The different EIF2B5 expressions in the boxplot. Notes: The expression of EIF2B5 is grouped by type (A), histologic grade (B), stage (C), and vital status (D). The EIF2B5 expression of HCC is compared with that in normal, hepatitis/fatty changes, and cirrhosis based on microarray GSE45050 (E), GSE54238 (F), and GSE89377 (G). Abbreviation: HCC, hepatocellular carcinoma. |
The diagnostic capability of EIF2B5
As shown in Figure 2A, the ROC of EIF2B was executed, and the area under the curve (AUC) was 0.708, which represented the moderate diagnostic ability. The subgroup analysis of different stages also showed modest diagnostic capability (AUC: 0.685 for stage I, 0.765 for stage II, 0.725 for stage III, 0.644 for stage IV; Figure 2B–E). Besides, Figure S2 shows that the optimal cutoff value of EIF2B5 was 10.196 for the following study.
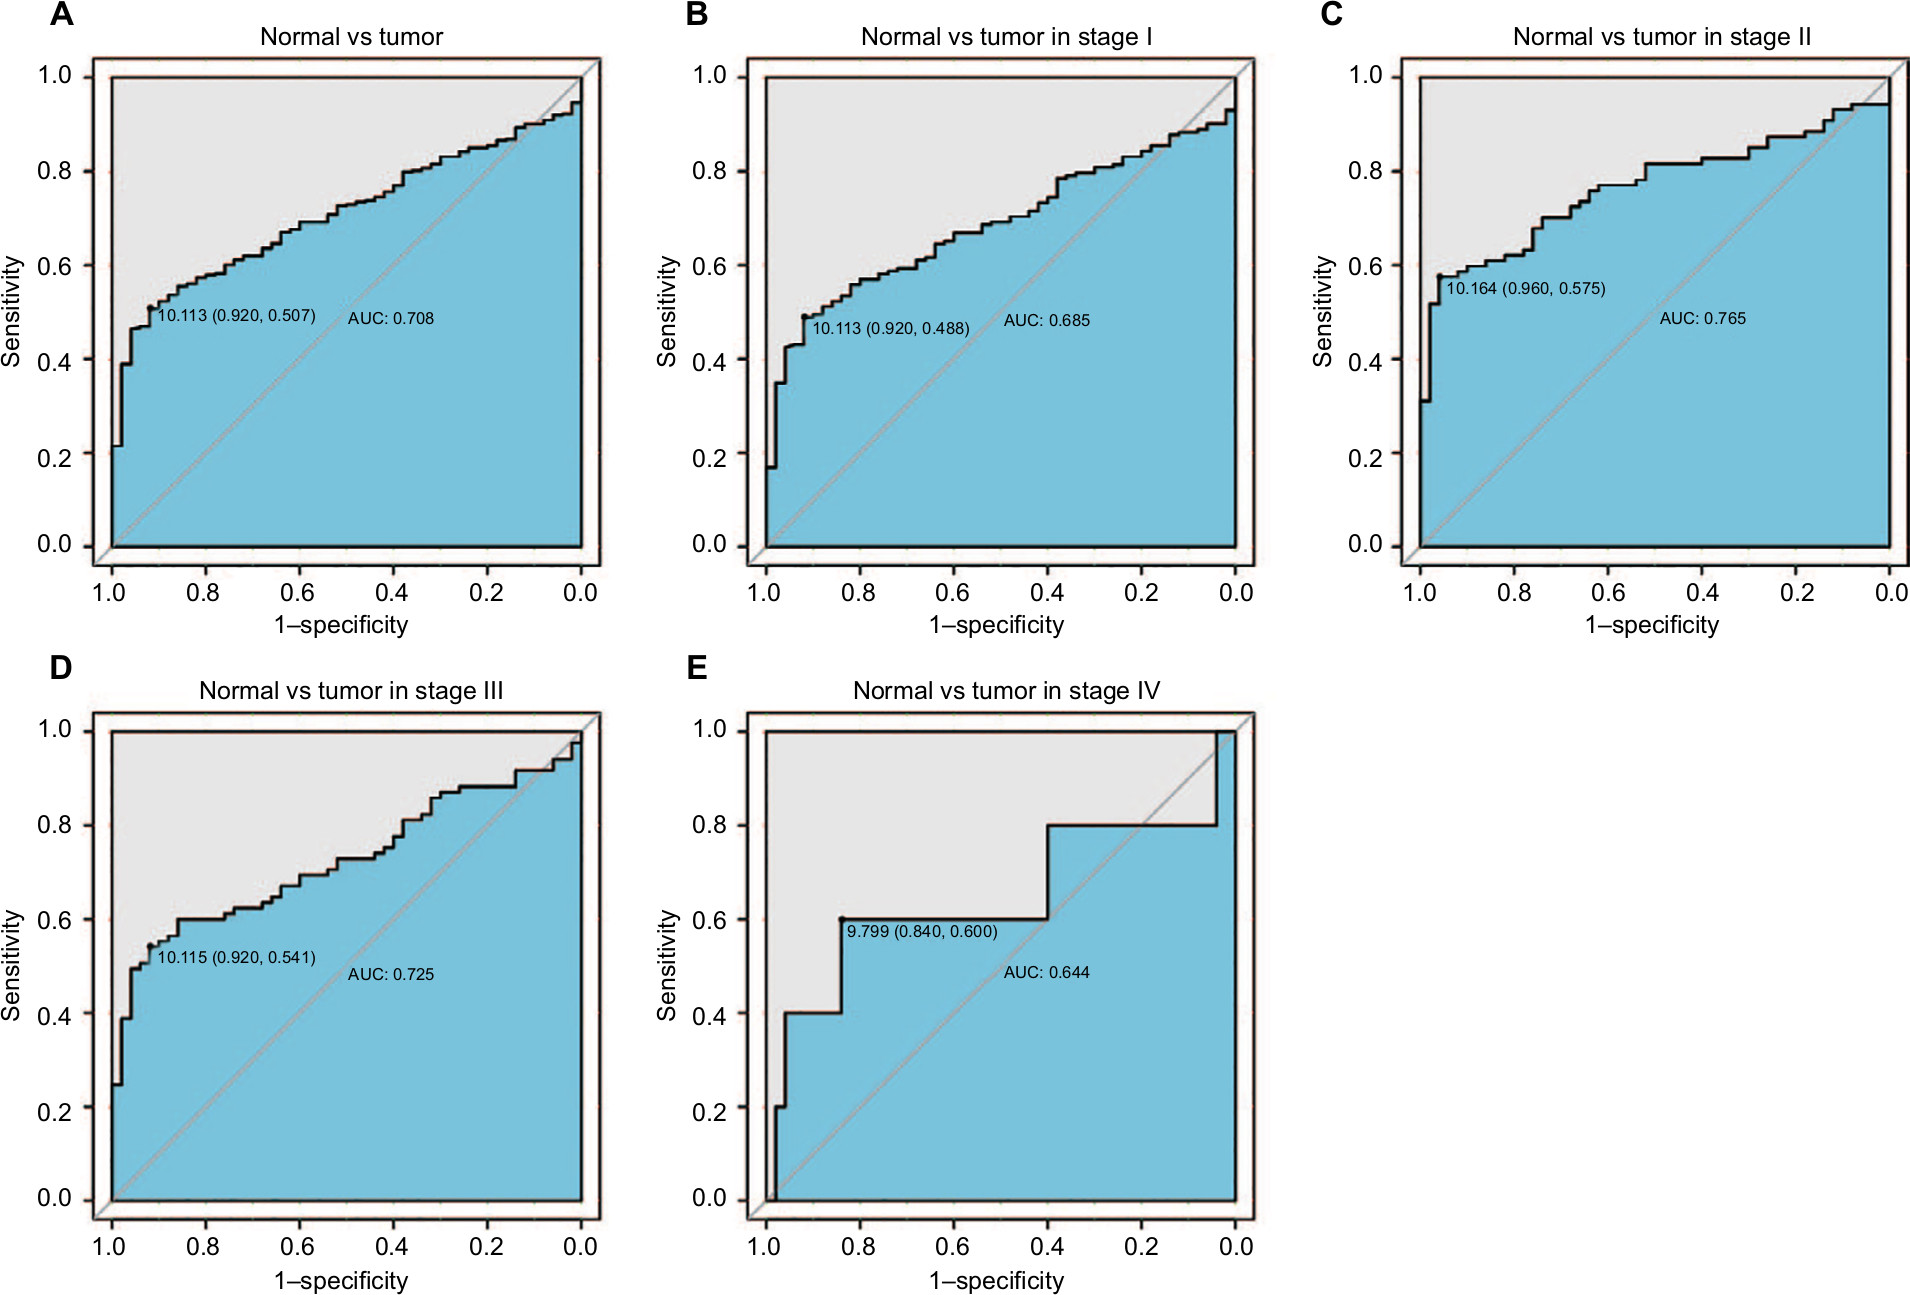 | Figure 2 The ROC curve of EIF2B5 in LIHC cohort. Notes: (A) Nontumor sample and tumor sample. (B) Nontumor sample and tumor sample of stage I. (C) Nontumor sample and tumor sample of stage II. (D) Nontumor sample and tumor sample of stage III. (E) Nontumor sample and tumor sample of stage IV. Abbreviations: AUC, area under the curve; LIHC, liver hepatocellular carcinoma; ROC, receiver-operating characteristic curve. |
The relationship between clinical features and EIF2B5 expression in liver cancer
The relationship between the clinical features and the expression of EIF2B5 was analyzed and is summarized in Table 2. The expression of EIF2B5 was highly associated with the histologic grade (P=0.003), stage (P=0.041), and vital status (P=0.0017).
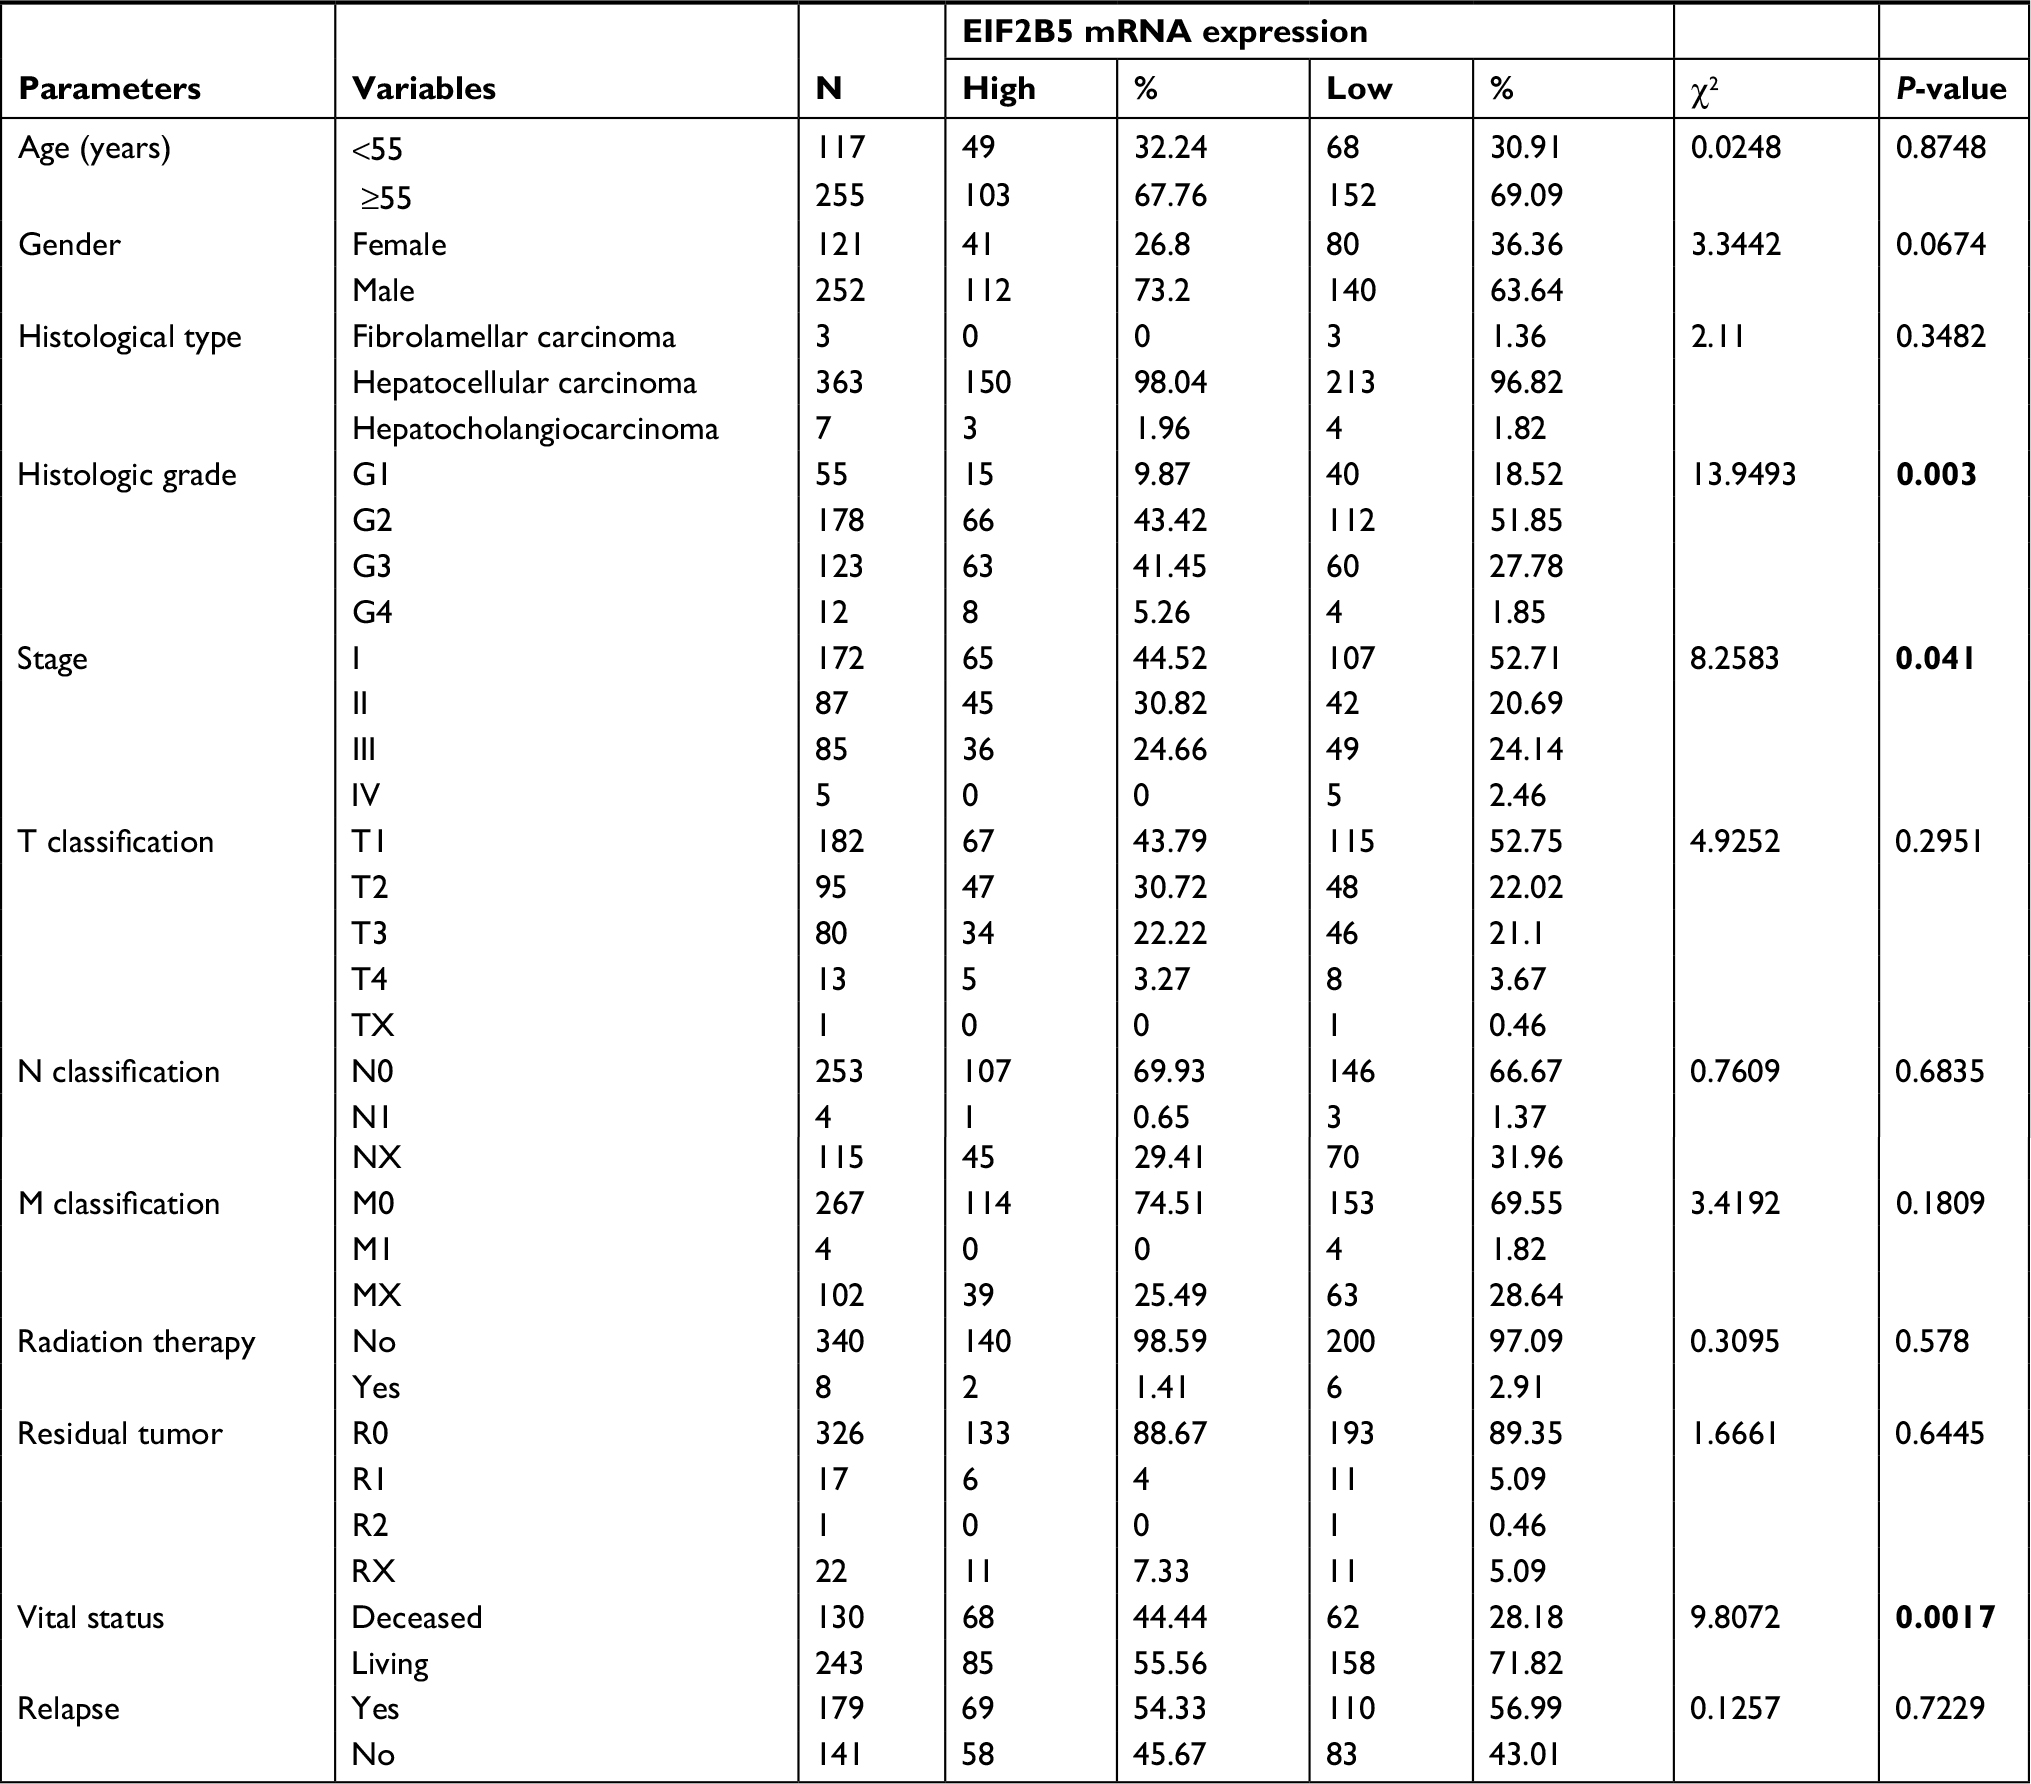 | Table 2 Correlation between the clinicopathologic variables and EIF2B5 mRNA expression in liver cancer Notes: Bold values indicate statistically significant, P<0.05. |
Expression of EIF2B5 is associated with the overall survival
To evaluate the prognostic effect of EIF2B5 in liver cancer patients, we used Kaplan–Meier survival curve with the log-rank test to estimate the relationship among the expression of EIF2B5, the overall survival (Figure 3), and relapse-free survival (Figure 4). In our results, patients with high EIF2B5 expression had a poor overall survival (P=0.00029; Figure 3A). Subgroup analysis indicated that high EIF2B5 group had a poor overall survival in patients who were in histologic grade G1/G2 (P=0.0022; Figure 3B), stage I/II (P=0.0026; Figure 3D), or stage III/IV (P=0.0027; Figure 3E). Univariate analysis selected the critical variables including EIF2B5 expression, residual tumor, clinical stage, and T classification. Multivariate analysis with the Cox proportional hazards model indicated that the expression of EIF2B5 (HR=1.76, P=0.001), residual tumor (HR=1.4, P=0.007), and T classification (HR=1.75, P=0.000) were independent prognostic factors for patients with liver cancer (Table 3). Validation of survival analysis by GSE54236 is shown in Figure 3F.
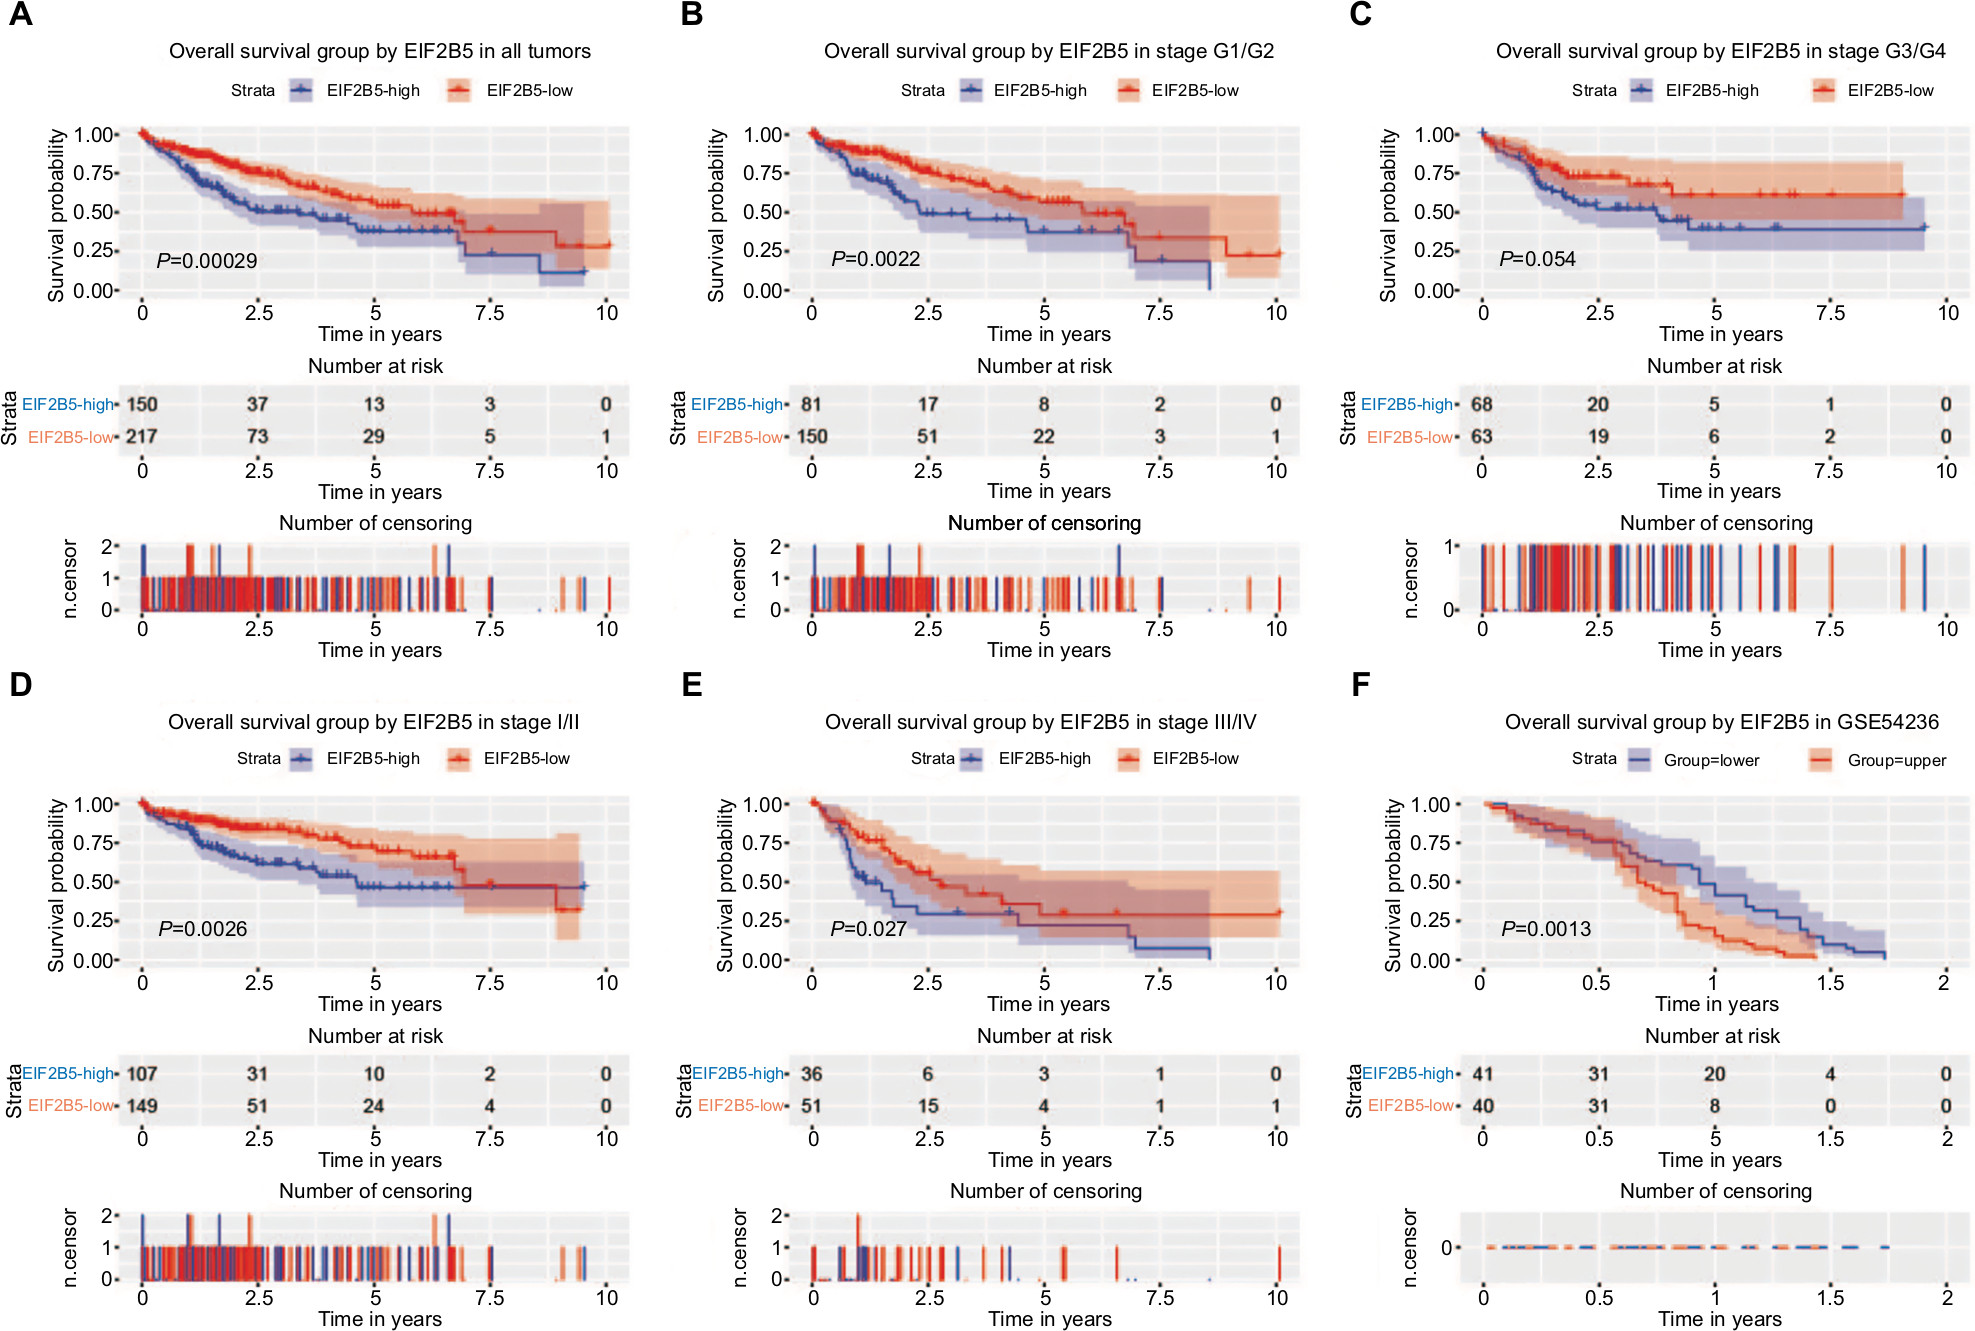 | Figure 3 Survival analysis of EIF2B5 expression in terms of overall survival. Notes: Kaplan–Meier curves produced survival analysis (A) and subgroup analysis of histological grade (G1/G2 and G3/G4) (B and C) and clinical stage (I/II and III/IV) (D and E). Validation group of survival analysis in GSE54236 (F). |
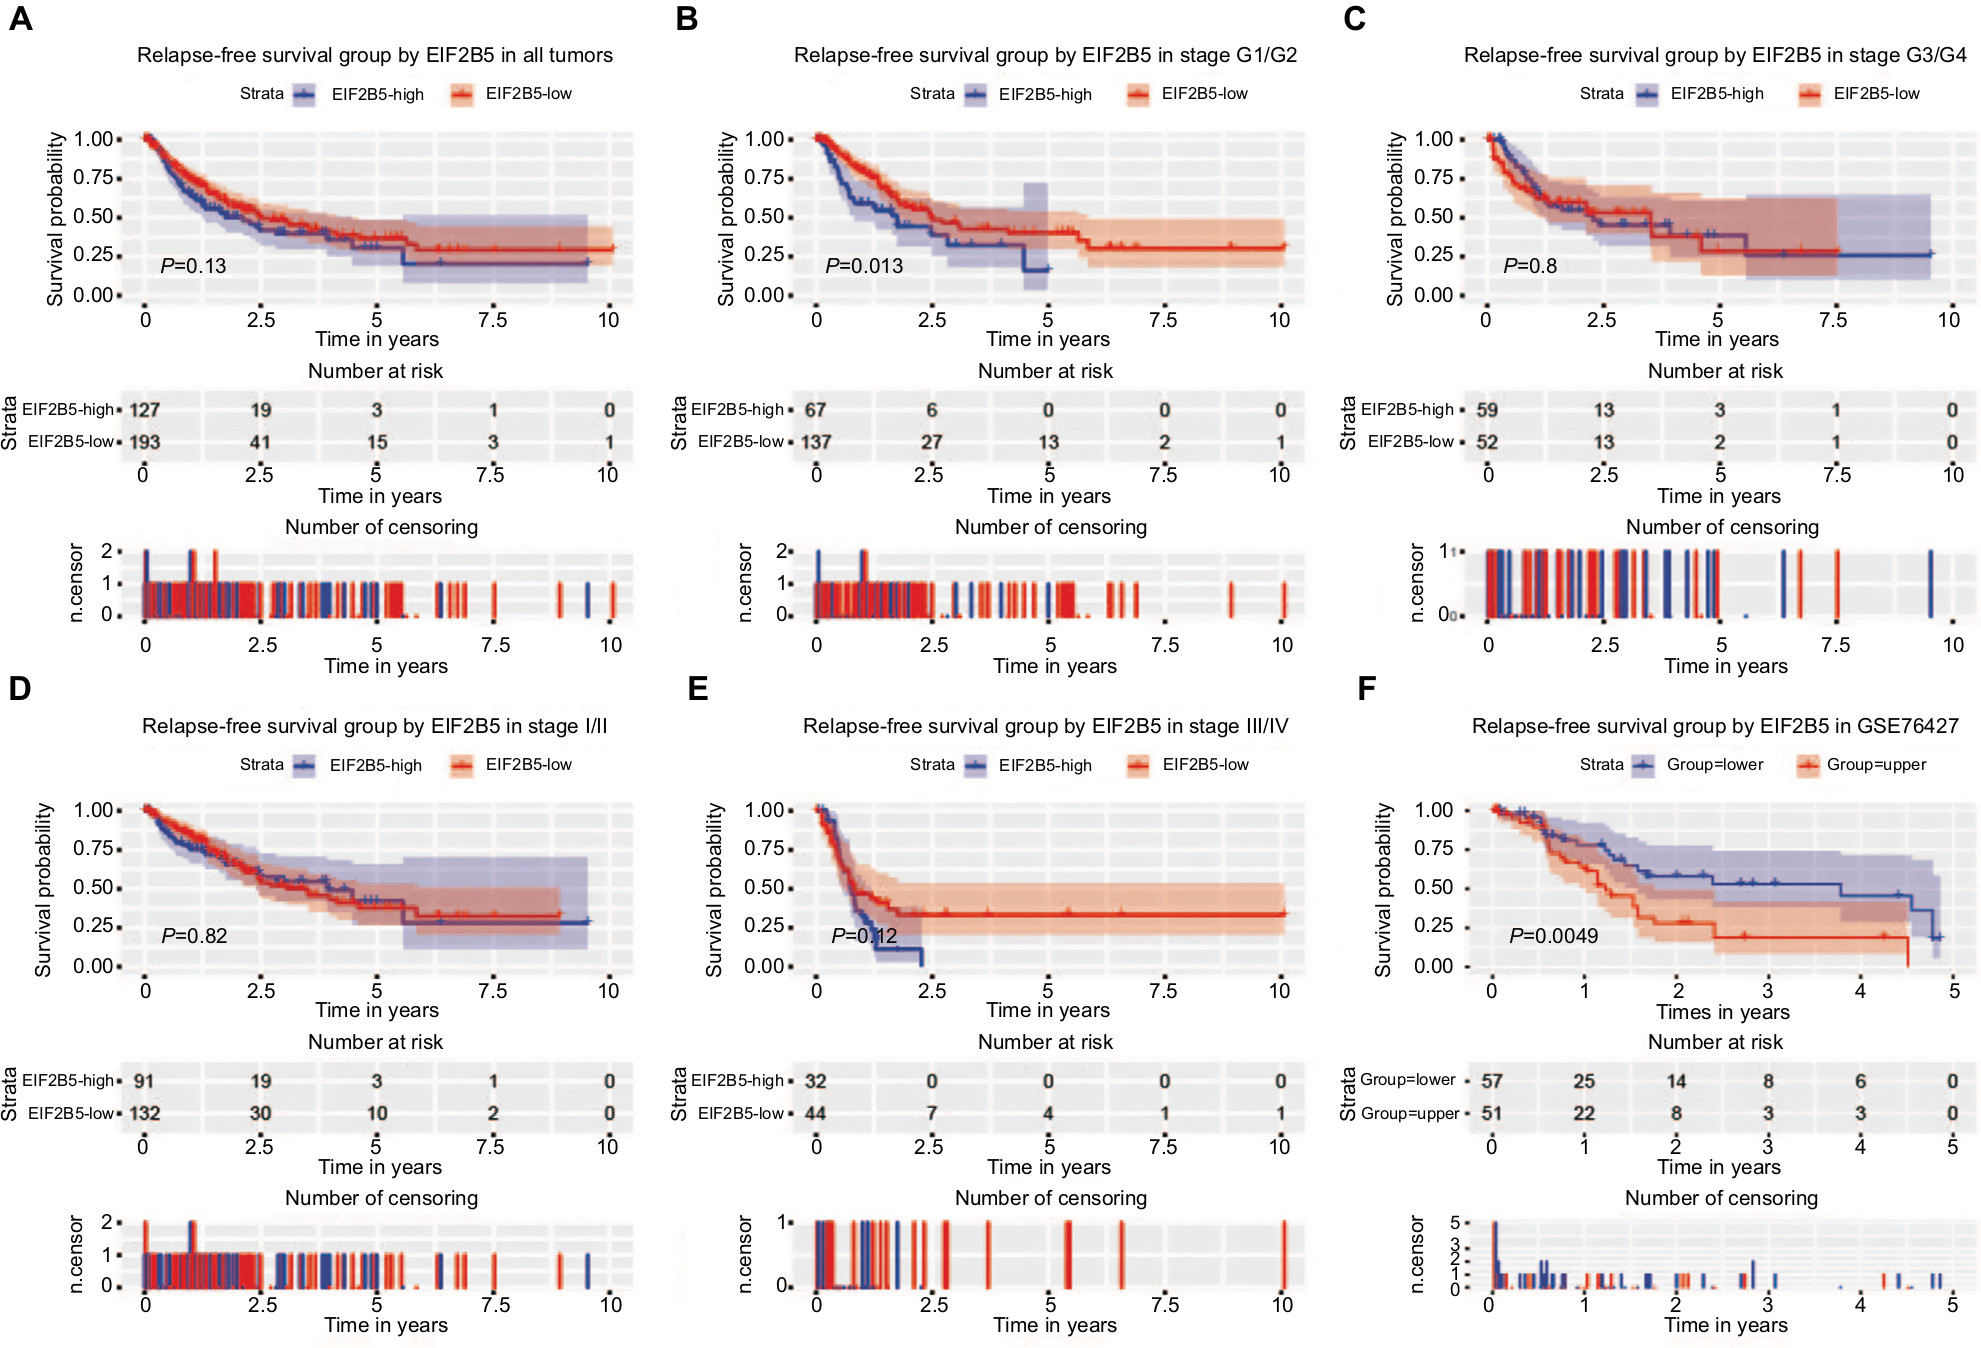 | Figure 4 Survival analysis of EIF2B5 expression in terms of relapse-free survival. Notes: Kaplan–Meier curves produced survival analysis (A) and subgroup analysis of histological grade (G1/G2 and G3/G4; B and C) and clinical stage (I/II and III/IV; D and E). Validation group of survival analysis in GSE76427 (F). |
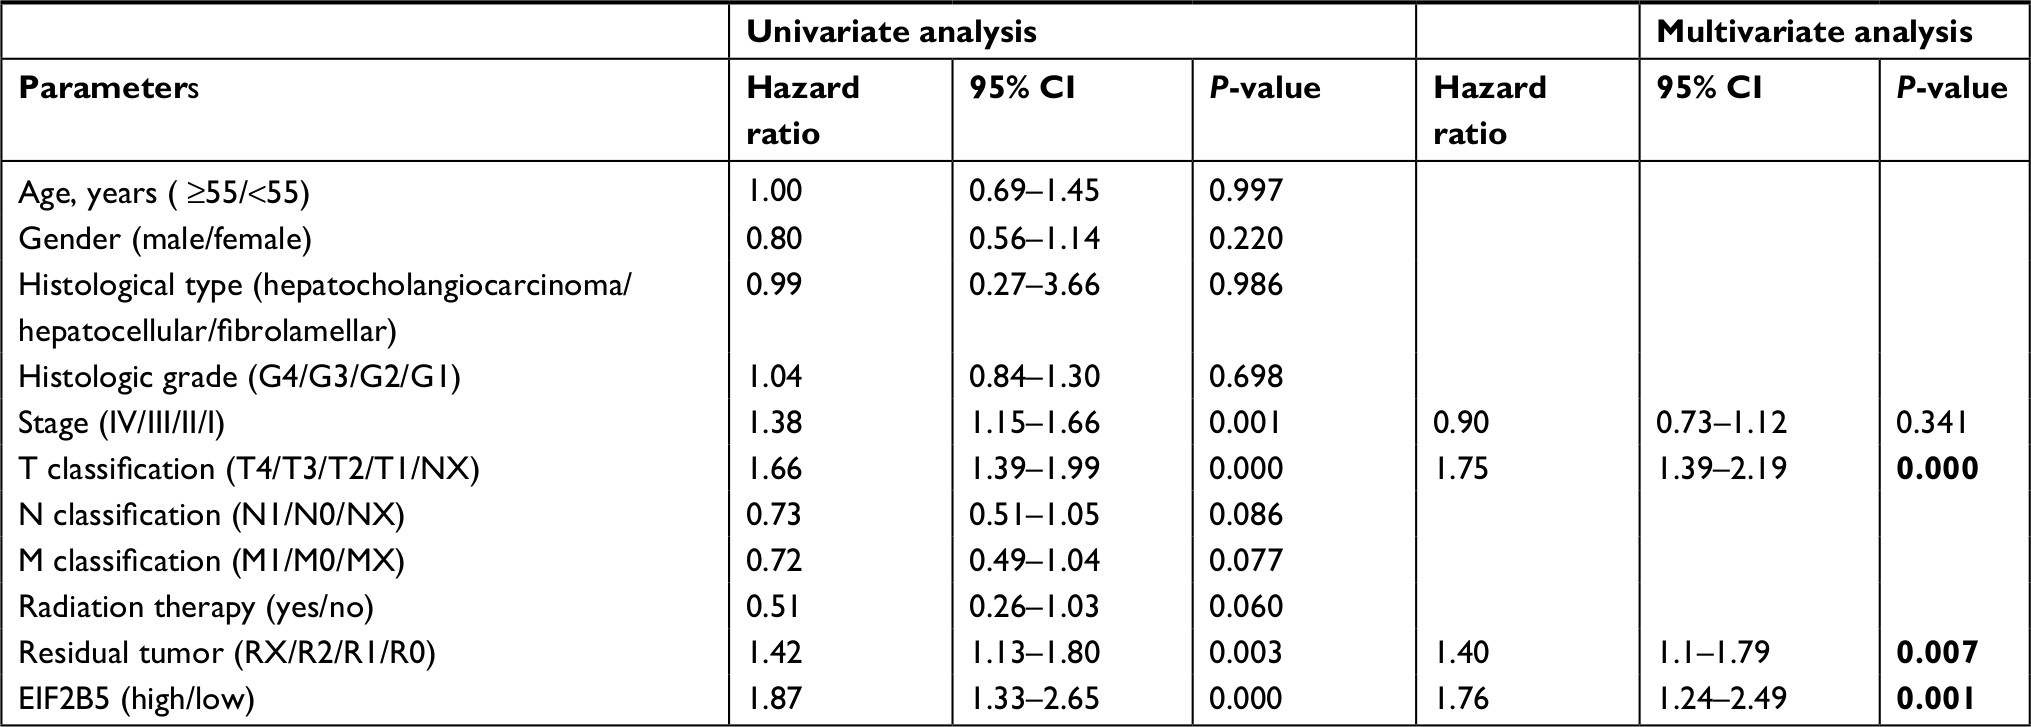 | Table 3 Univariate and multivariate analyses of overall survival in patients with liver cancer Notes: Bold values indicate statistically significant, P<0.05. |
Although high EIF2B5 did not show significant prognostic value for relapse-free survival (P=0.13; Figure 4A), subgroup analysis indicated that it had a significant prognostic potential for relapse-free survival in patients who were in histologic grade G1/G2 (Figure 4B). Univariate Cox analysis and multivariate Cox analysis indicated that EIF2B5 was an independent prognostic factor for patients who were in histologic grade G1/G2 (Table 4). Validation of survival analysis by GSE76427 is shown in Figure 4F.
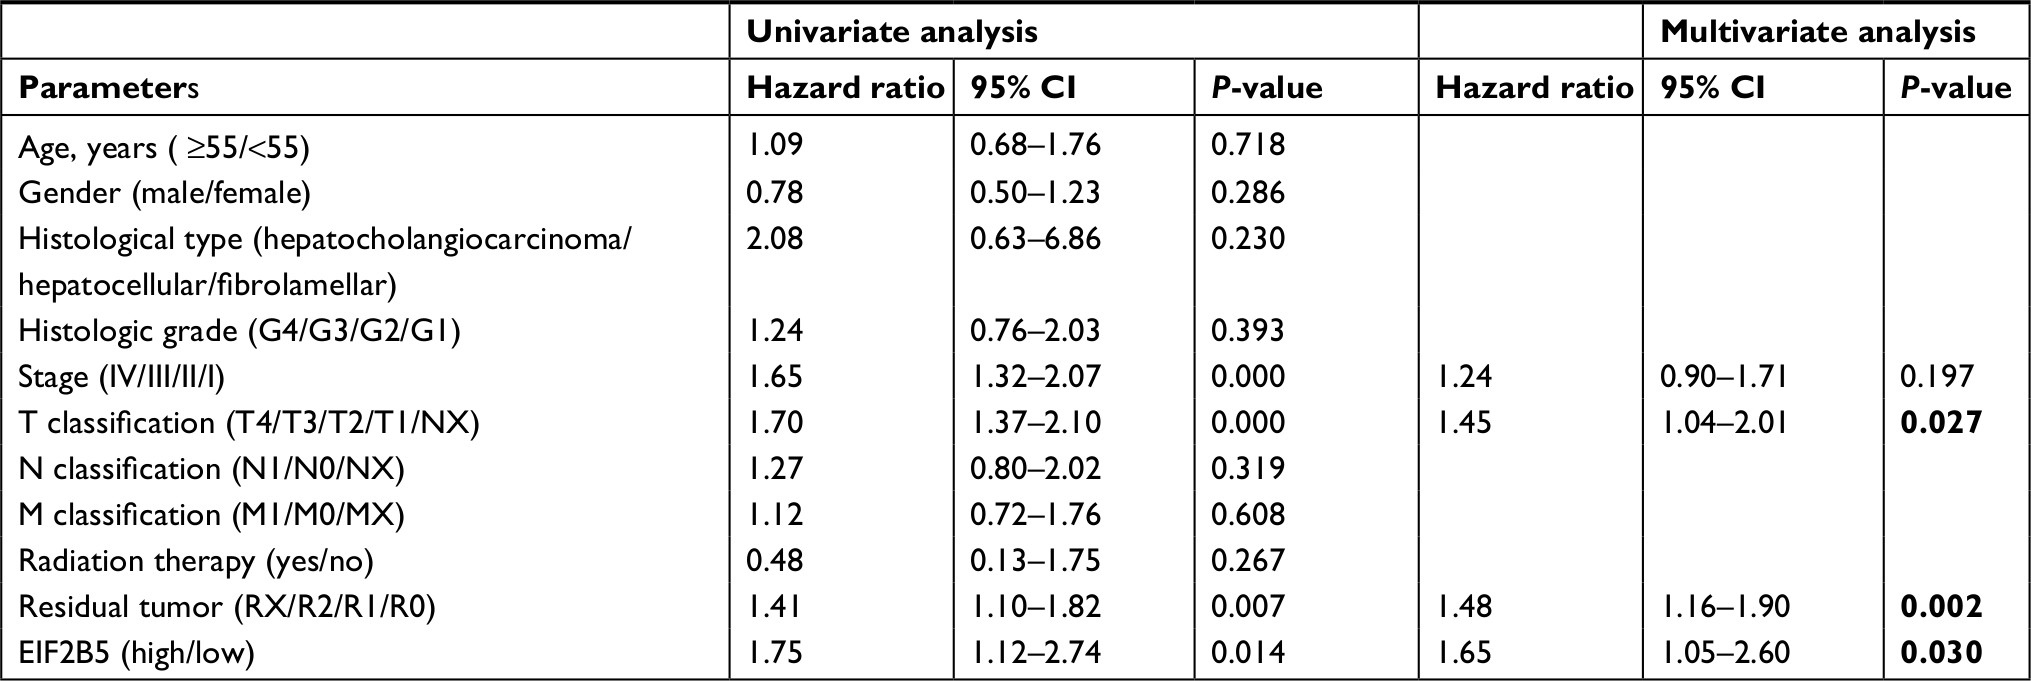 | Table 4 Univariate and multivariate analyses of relapse-free survival in patients with G1/G2 liver cancer Notes: Bold values indicate statistically significant, P<0.05. |
To further explore the subgroup survival under T classification and residual tumor, we made survival analysis in different T classifications (T1, T2, T3, and T4) and residual tumors (R0 and R1/R2/RX; Figures 5 and 6). Significant survival differences were found in T2 for overall survival (Figure 5B) and T3 for relapse-free survival. As for residual tumor, significant survival differences were found in R0 for both overall survival (Figure 5E) and relapse free-survival (Figure 6E).
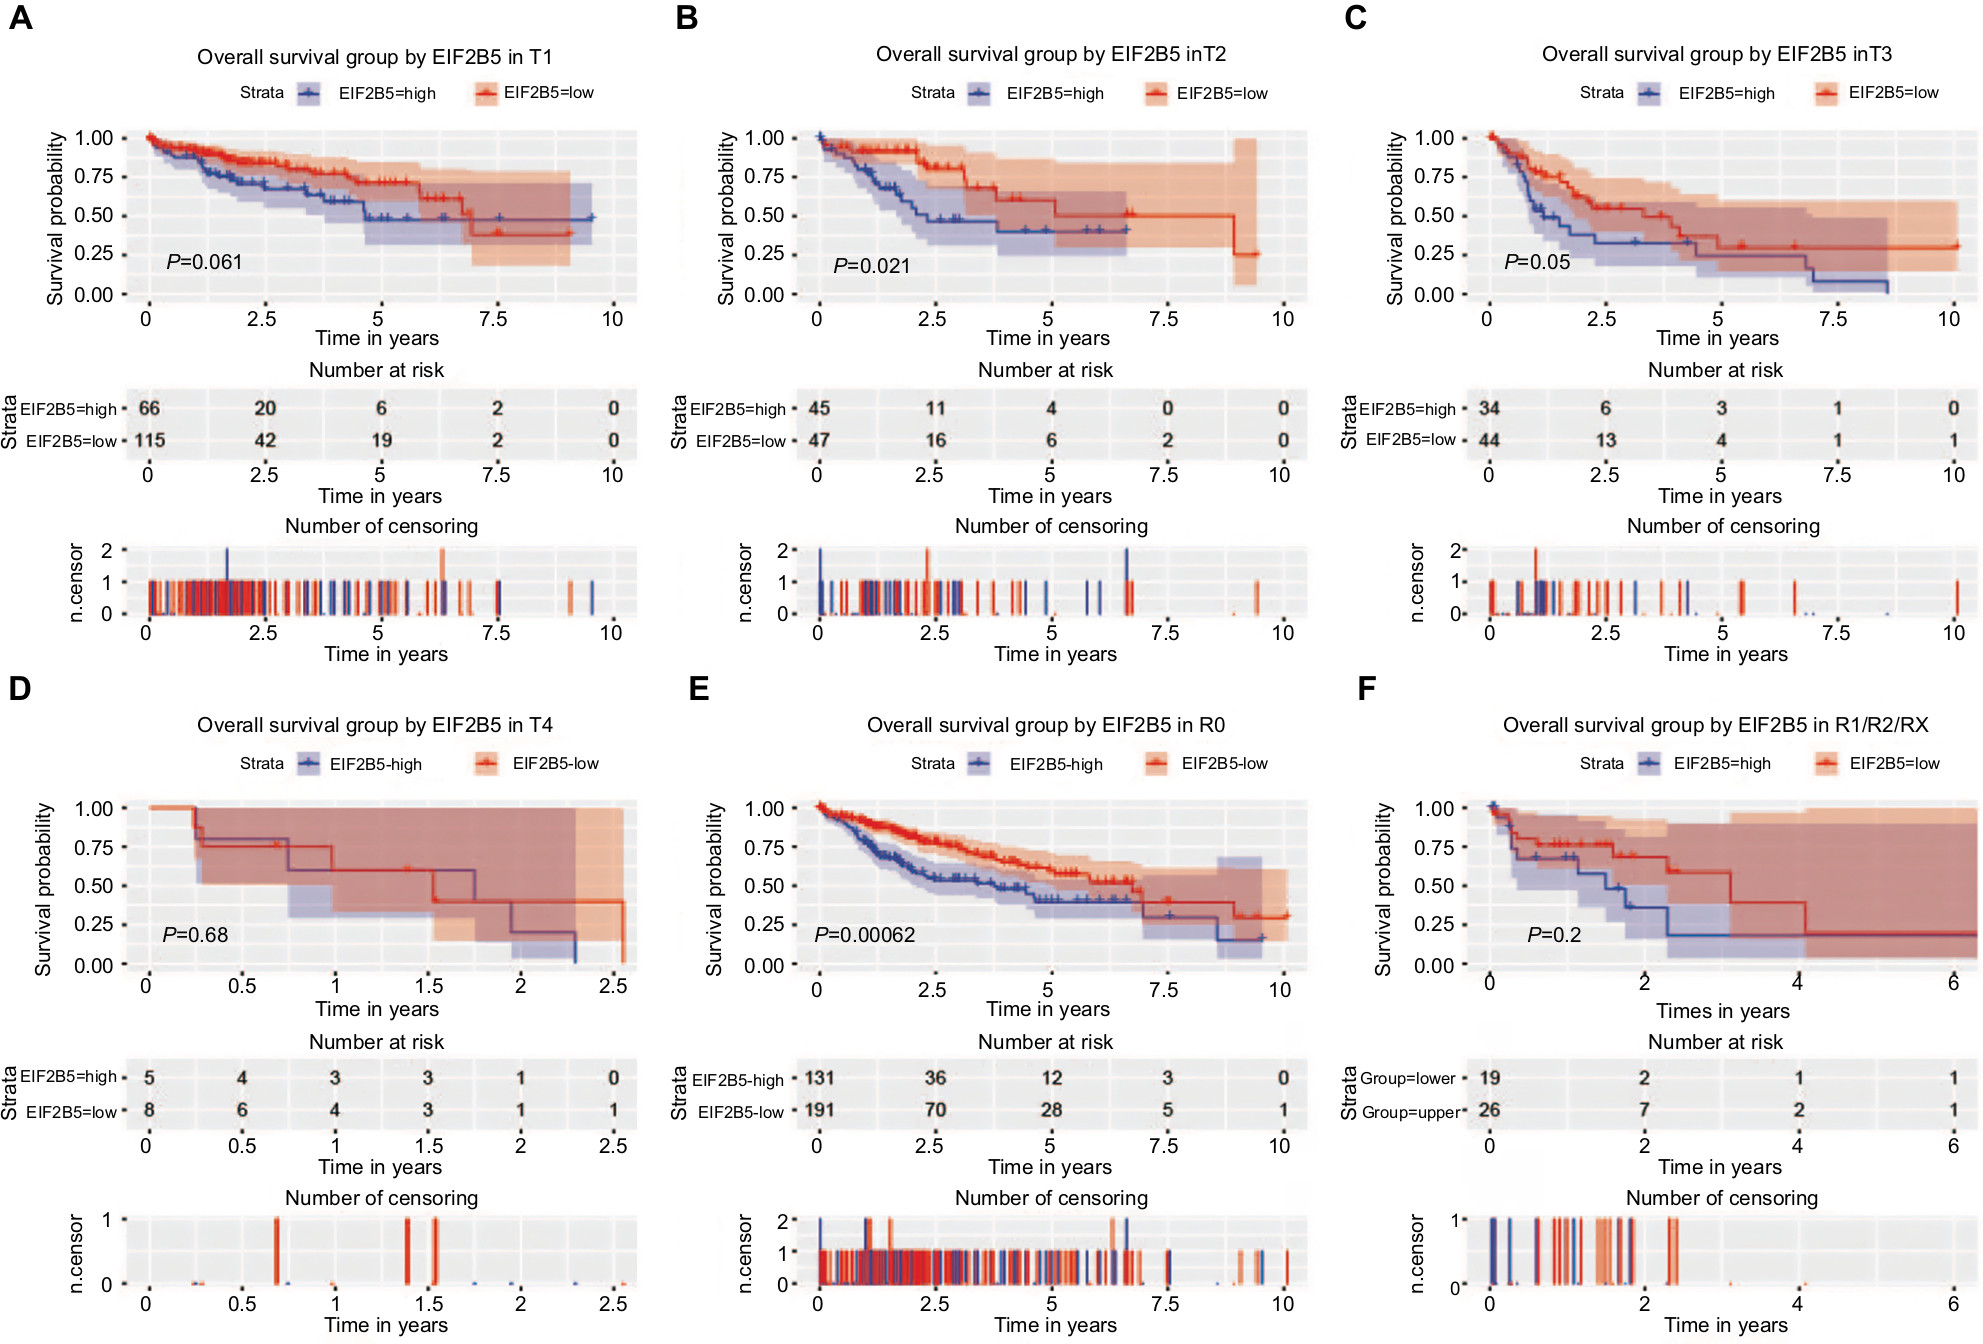 | Figure 5 Survival analysis of EIF2B5 expression in terms of overall survival. Notes: Kaplan–Meier curves produced survival analysis and subgroup analysis of T classification (T1, T2, T3, and T4; A–D) and residual (R0 and R1/R2/RX; and E, F). |
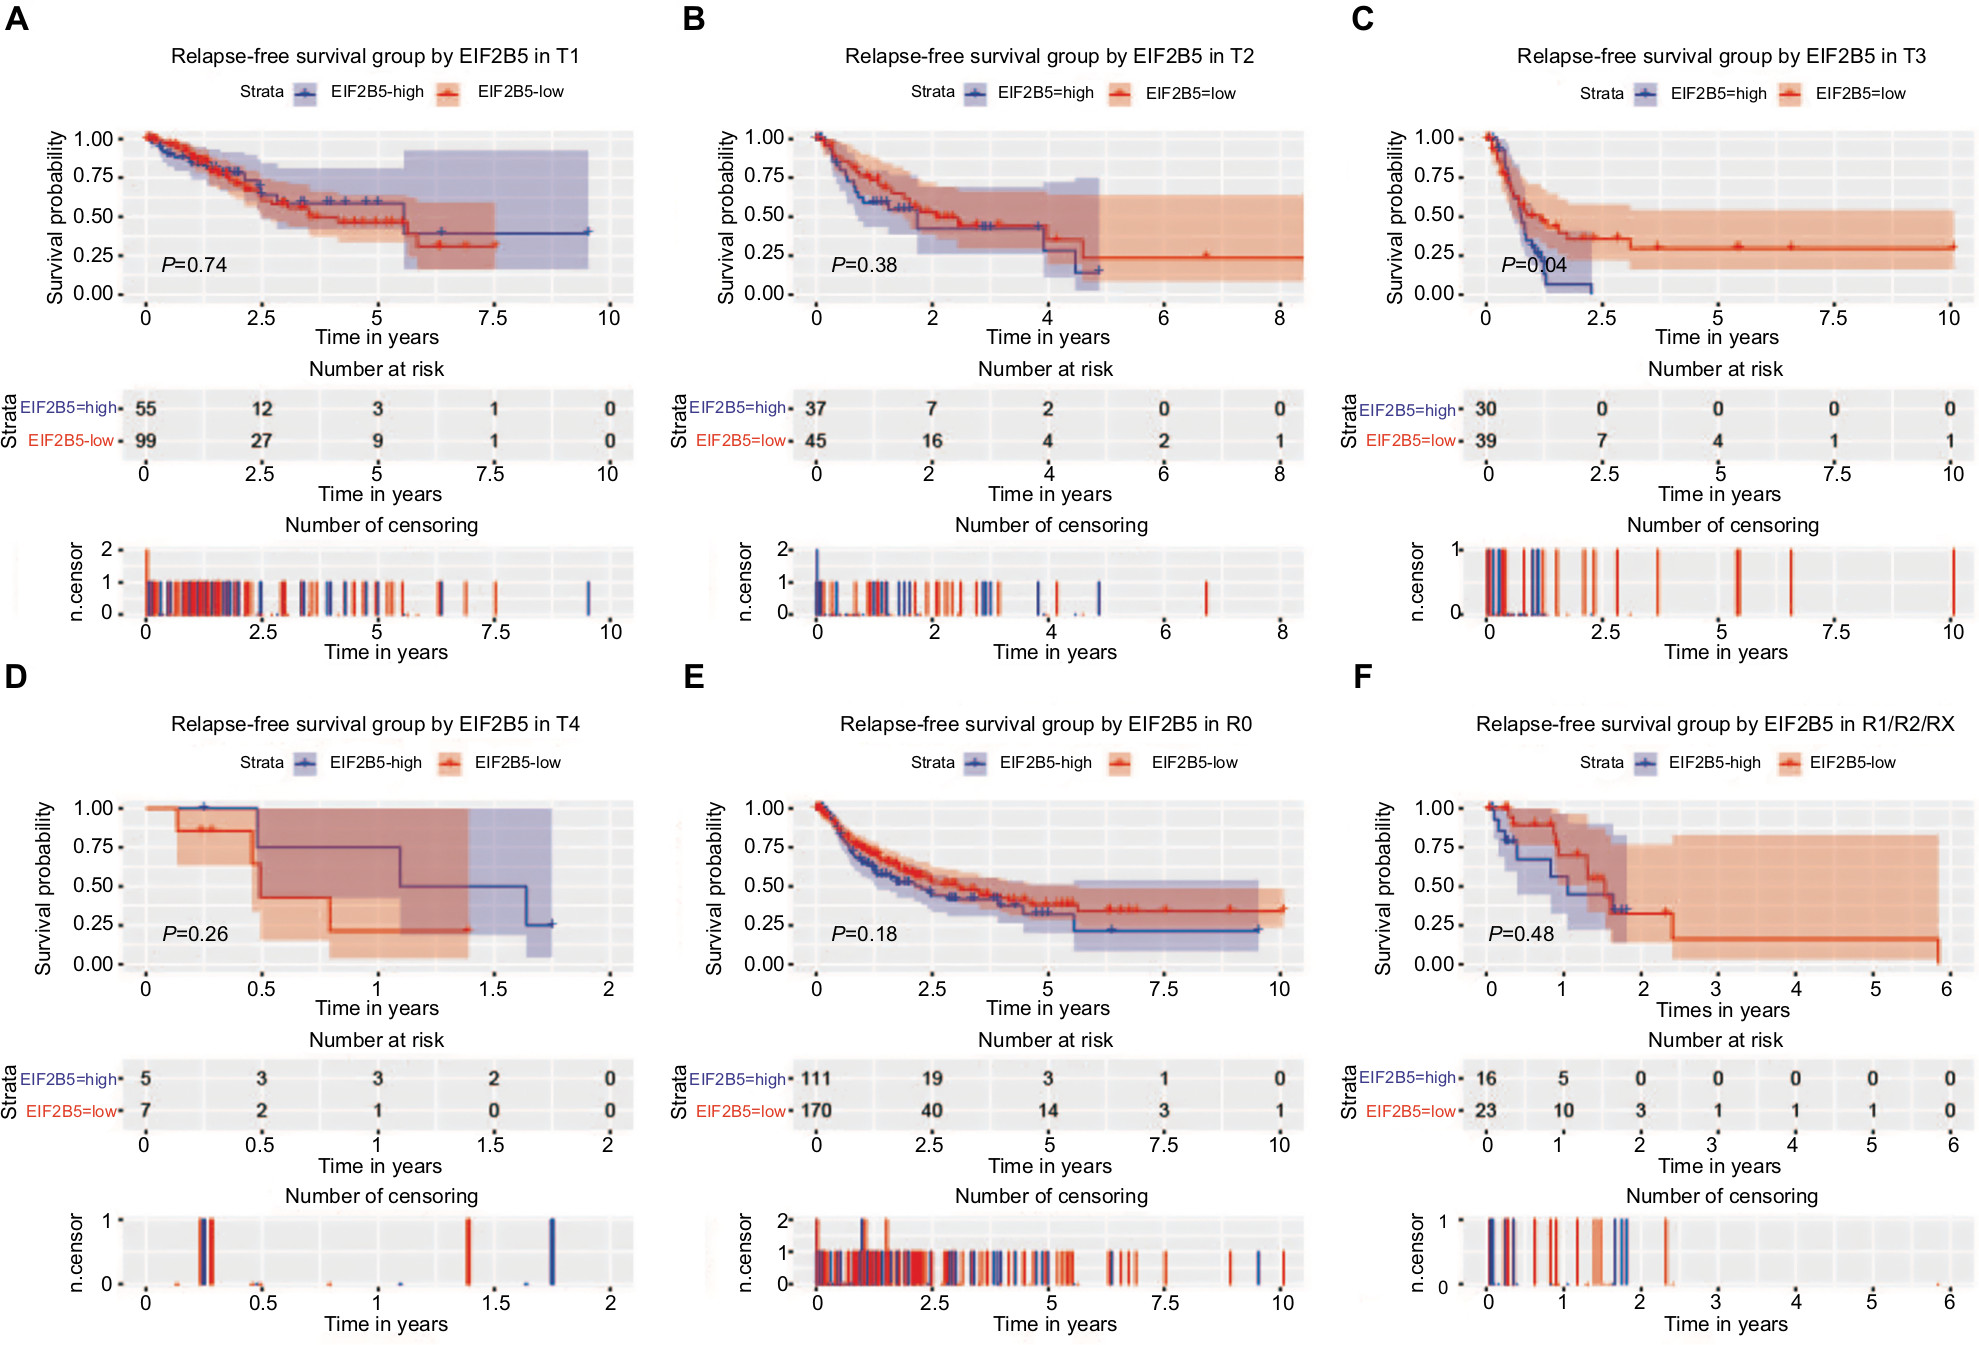 | Figure 6 Survival analysis of EIF2B5 expression in terms of relapse-free survival. Notes: Kaplan–Meier curves produced survival analysis and subgroup analysis of T classification (T1, T2, T3, and T4; A–D) and residual (R0 and R1/R2/RX; E and F). |
GSEA identifies an EIF2B5-related signaling pathway
To identify signaling pathways activated in liver cancer, we conducted the GSEA between low and high EIF2B5 expression data sets. GSEA reveals significant differences (FDR <0.25, NOM P-value<0.05) in the enrichment of MSigDB Collection (c2.cp.biocarta.v6.2.symbols.gmt and h.all.v6.2.symbols.gmt), and the details are shown in Table 5. We selected the most significantly enriched signaling pathways based on their NES (Figure 7; Table 5).Figure 7 shows that ATR and BRCA pathway, cell cycle pathway, DNA repair, myc signaling pathway, and E2F targets are differentially enriched in EIF2B5 high-expression phenotype.
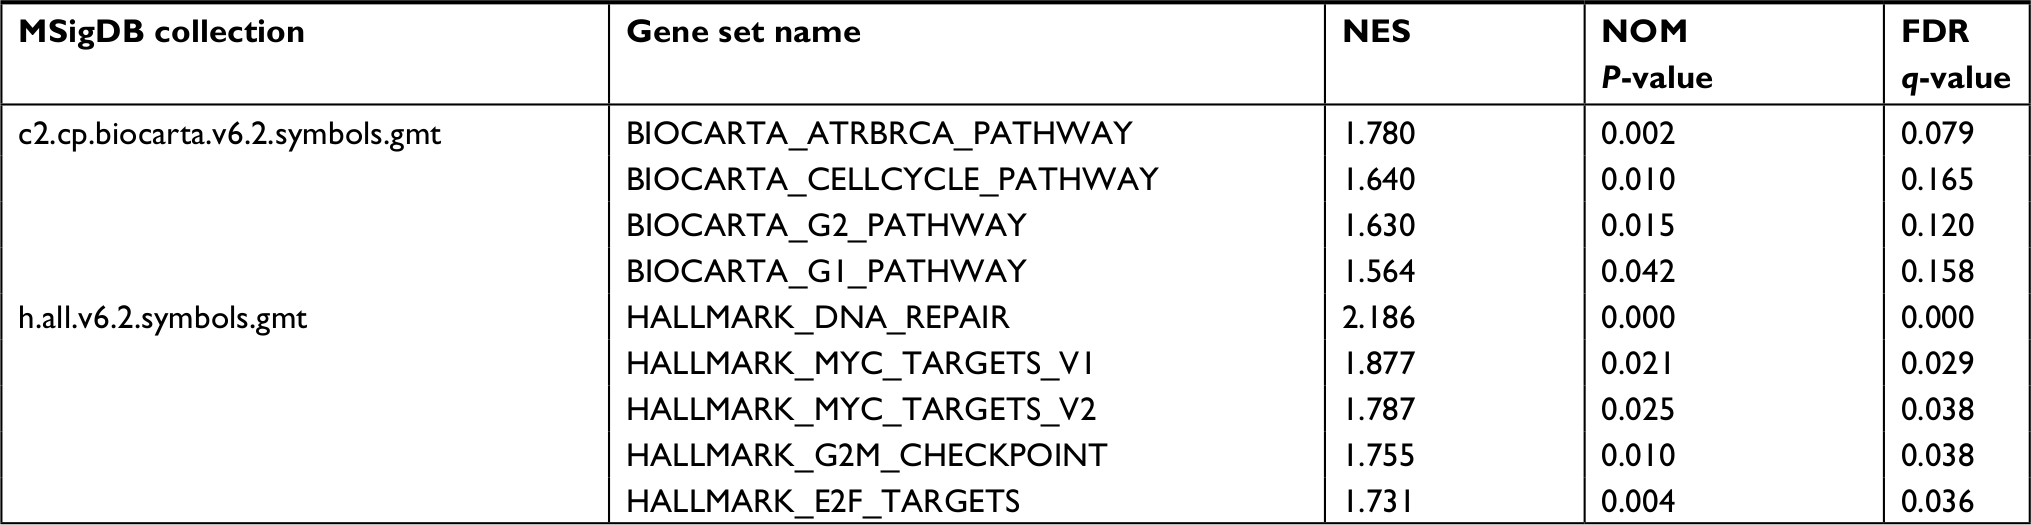 | Table 5 Gene sets enriched in phenotype high Notes: Gene sets with NOM P-value <0.05 and FDR q-value <0.25 are considered as significant. Abbreviations: FDR, false discovery rate; NES, normalized enrichment score; NOM, nominal. |
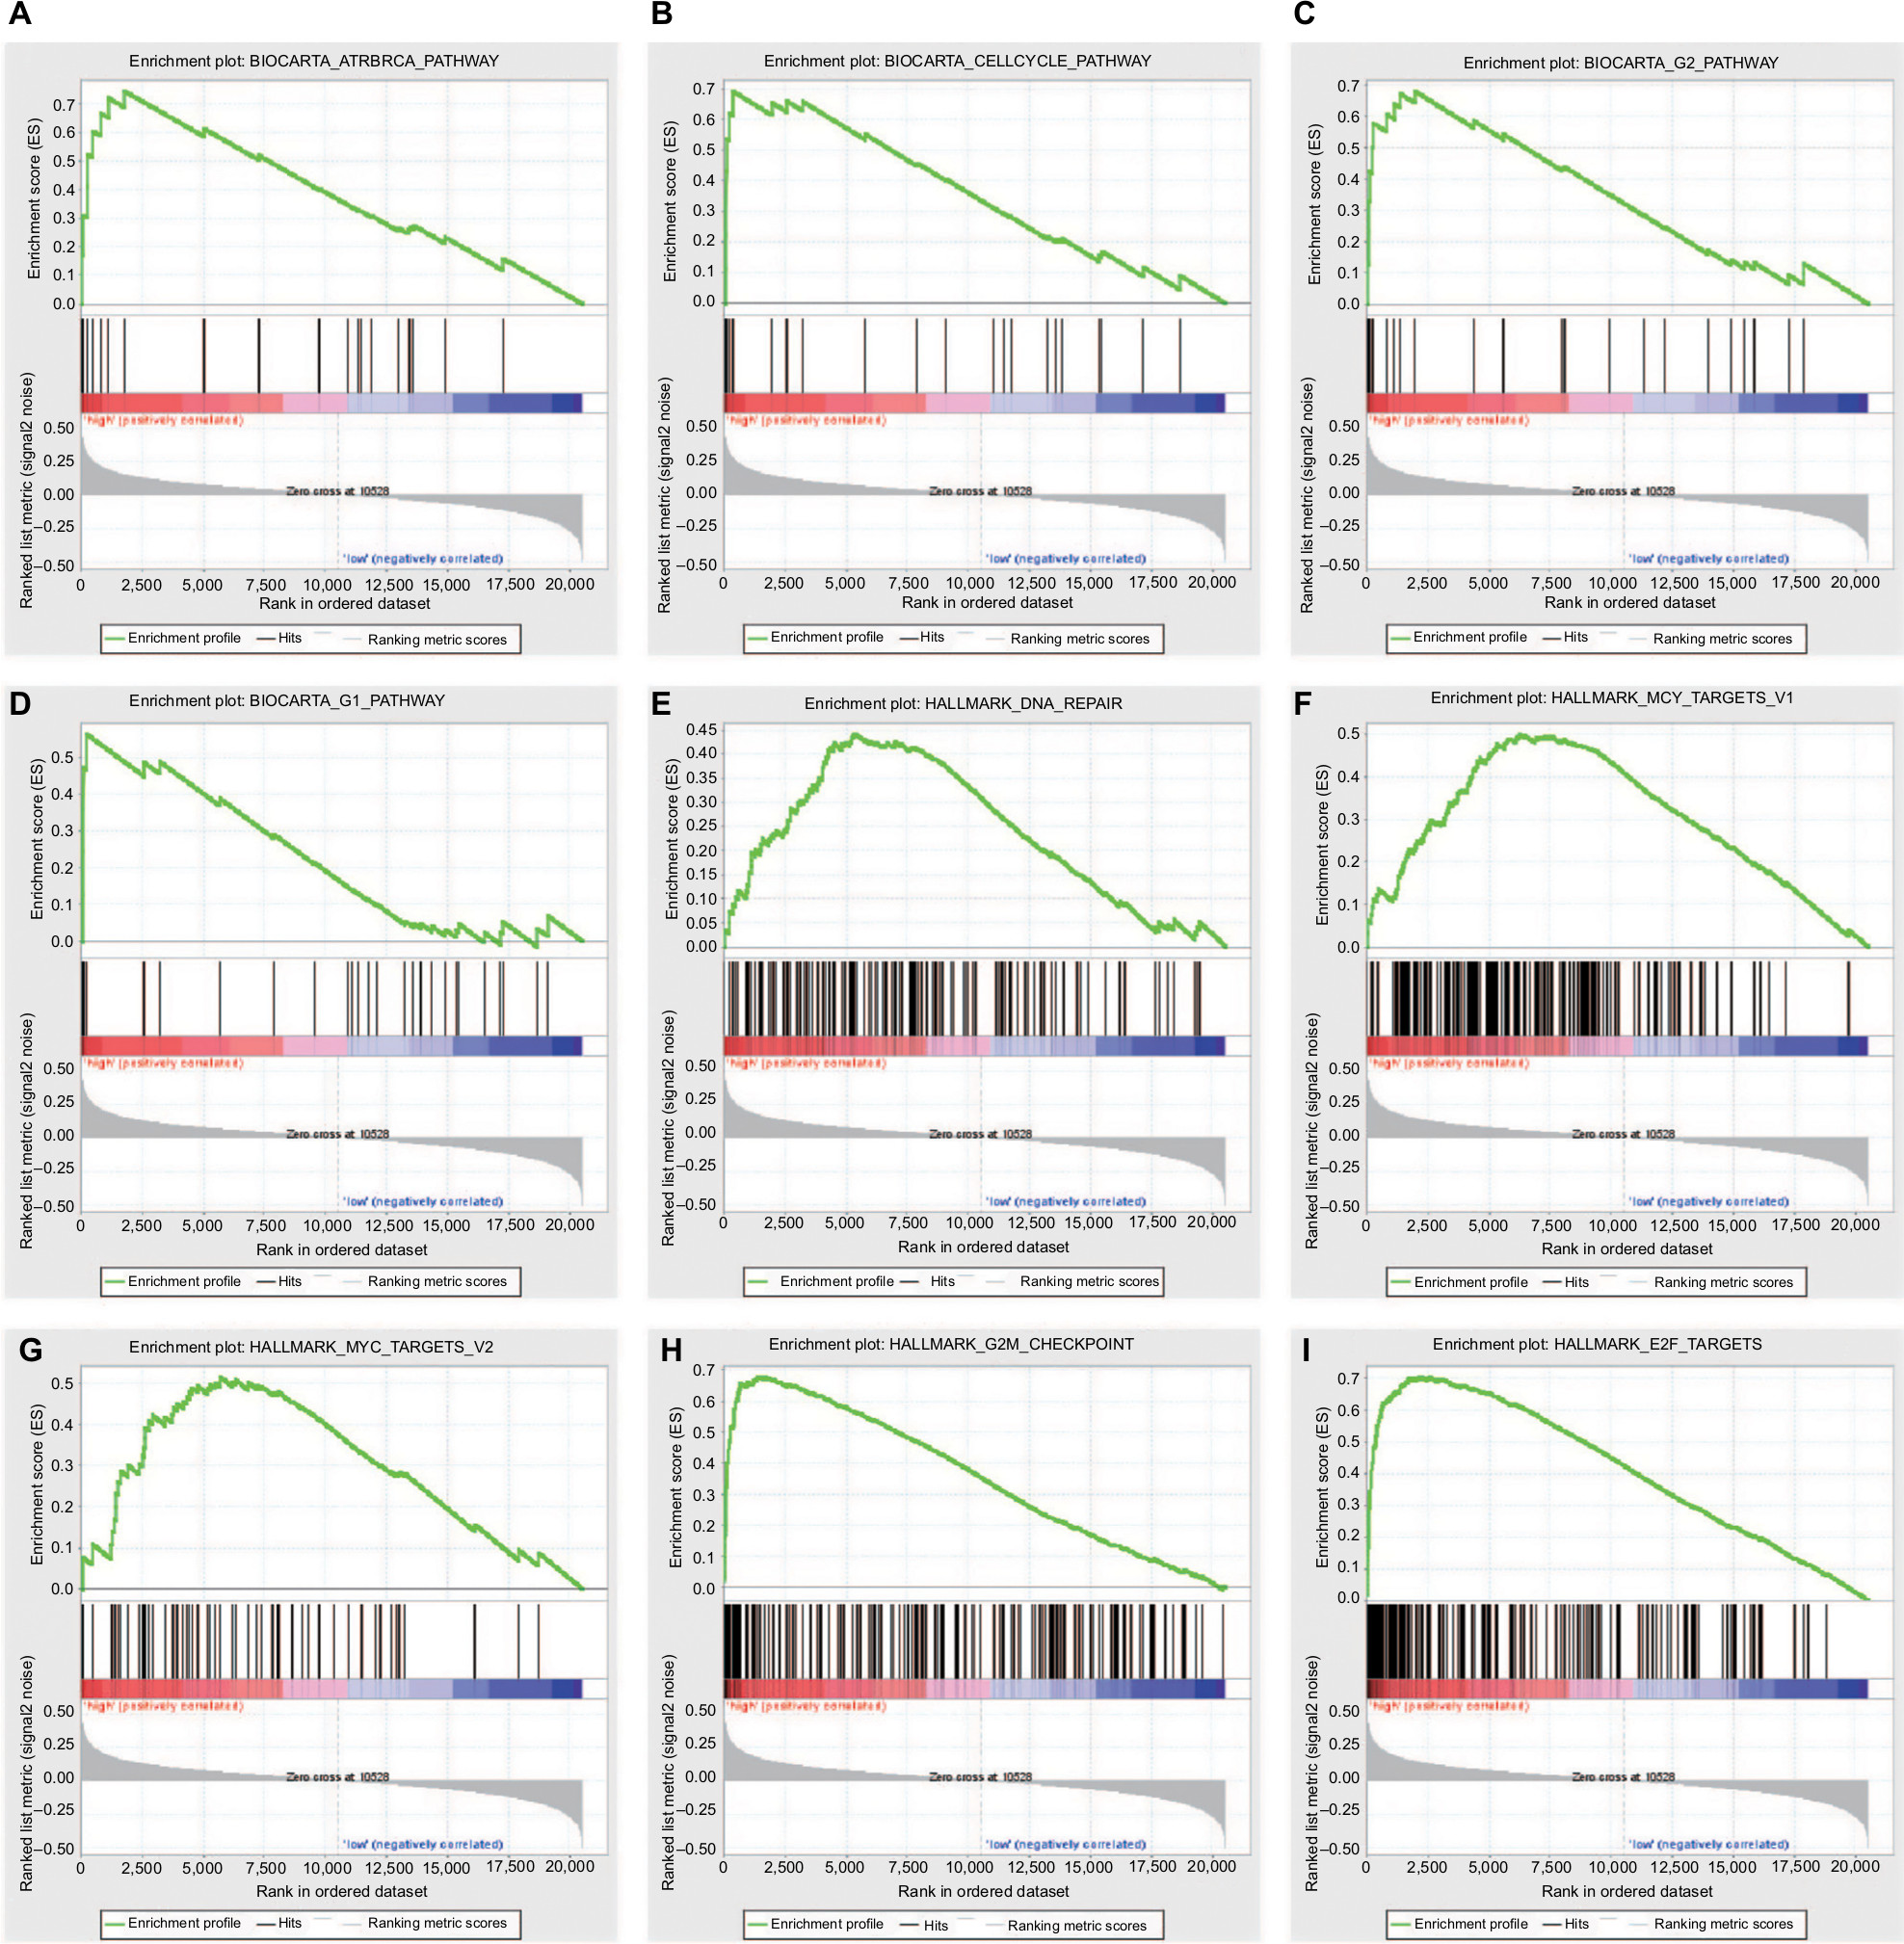 | Figure 7 Enrichment plots from GSEA. Notes: GSEA results showing ATR and BRCA pathway (A), cell cycle pathway (B), G1 and G2 pathways (C and D), DNA repair (E) and myc signaling pathway (F and G), G2M checkpoint (H), and E2F targets (I) are differentially enriched in EIF2B5-related liver cancer. Abbreviation: GSEA, Gene Set Enrichment Analysis. |
Discussion
This study demonstrated the important role of EIF2B5 in liver cancer and found that EIF2B5 could become a biomarker for the prognosis of patients with liver cancer. We analyzed the expression of EIF2B5 in patients with liver cancer and found that the overexpression of EIF2B5 was associated with histologic grade, clinical stage, and vital status.
In the past few years, the researches on the role of EIF2B5 have focused on VWM, which was caused by the downregulation of EIF2B.4,6 Recently, the upregulation of EIF2B5 associated with cancer has been reported, such as human pulmonary adenocarcinoma cell and breast cancer.15,16 Our study found that EIF2B5 was highly expressed in liver cancer, which coordinates with other research in tumors. Interestingly, the expression of EIF2B5 was gradually increasing from G1 to G4, which suggested that EIF2B5 might be associated with cancer progression. Besides, the expression of EIF2B5 was upregulated in stage I/II and downregulated in stage III/IV, which suggested that the role of EIF2B5 might differ in different stages in liver cancer and subgroup analysis would be urgently needed. As the expression of EIF2B5 was higher in the deceased than in the living, the link between EIF2B5 and survival needs to be explored.
The functions of EIF2B5 in the tumor occurrence and growth have also been studied. Bi et al reported that the upregulation of EIF2, which was caused by ER stress, was associated with tumor growth.17 Experiments also verified the results by silencing EIF2B5 gene expression and found that it could significantly inhibit the growth of pancreatic cell lines.18 In our study, the role of EIF2B5 in tumor initiation and proliferation might account for the clinical association between EIF2B5 expression and T classification.
EIF2B5 is strongly associated with the prognosis of cancer patients. In ovarian cancer, minor alleles at rs4912474 could improve the prognosis of patients on account of inhibiting the angiogenesis and tumor growth.19 In this study, we found that patients with high EIF2B5 expression had a poor overall survival, especially in stage I/II and histologic grade G1/G2, which might contribute to precise medicine and personalized medicine toward liver cancer. Importantly, we found that EIF2B5 was an independent prognostic factor that affected the overall survival of patients and had the potential to be a biomarker for liver cancer. Besides, there was no prognostic significance of EIF2B5 in relapse-free survival, but subgroup analysis revealed its possible appliance in G1/G2 liver cancer.
To the best of our knowledge, this study first demonstrated the important role of EIF2B5 in the prognosis of liver cancer. Our work, together with other related researches, contributed to the role of EIF2B5 in liver cancer. However, clinical trials in the future are required to verify these results and promote the application of EIF2B5 in liver cancer prognosis evaluation.
Conclusion
Our study found that the expression of EIF2B5 was significantly increased in liver cancer patients and associated with several clinical features and undesirable prognosis, so that EIF2B5 could be a useful biomarker for the prognosis of patients with liver cancer.
Disclosure
The authors report no conflicts of interest in this work.
References
Torre LA, Bray F, Siegel RL, Ferlay J, Lortet-Tieulent J, Jemal A. Global cancer statistics, 2012. CA Cancer J Clin. 2015;65(2):87–108. | ||
Wortham NC, Proud CG. eIF2B: recent structural and functional insights into a key regulator of translation. Biochem Soc Trans. 2015;43(6):1234–1240. | ||
Bugiani M, Boor I, Powers JM, Scheper GC, van der Knaap MS. Leukoencephalopathy with vanishing white matter: a review. J Neuropathol Exp Neurol. 2010;69(10):987–996. | ||
Schiffmann R, Moller JR, Trapp BD, et al. Childhood ataxia with diffuse central nervous system hypomyelination. Ann Neurol. 1994;35(3):331–340. | ||
Horzinski L, Gonthier C, Rodriguez D, Scherer C, Boespflug-Tanguy O, Fogli A. Exon deletion in the non-catalytic domain of eIF2B epsilon due to a splice site mutation leads to infantile forms of CACH/VWM with severe decrease of eIF2B GEF activity. Ann Hum Genet. 2008;72(Pt3):410–415. | ||
Sharma S, Ajij M, Singh V, Aneja S. Vanishing white matter disease with mutations in EIF2B5 gene. Indian J Pediatr. 2015;82(1):93–95. | ||
Palaniappan A, Ramar K, Ramalingam S. Computational identification of novel stage-specific biomarkers in colorectal cancer progression. PLoS One. 2016;11(5):e0156665. | ||
Team RDC. R: a language and environment for statistical computing. R Foundation for Statistical Computing, Vienna, Austria. Computing. 2012;1:12–21. | ||
Samur MK. RTCGA Toolbox: a new tool for exporting TCGA Firehose data. PLoS One. 2014;9(9):e106397. | ||
Robin X, Turck N, Hainard A, et al. pROC: an open-source package for R and S+ to analyze and compare ROC curves. BMC Bioinformatics. 2011;12:77. | ||
Therneau TM. A Package for Survival Analysis in S. 2015. | ||
Therneau TM, Grambsch PM. Modeling survival data: extending the Cox model. Technometrics. 2000;97(457):353–354. | ||
Subramanian A, Tamayo P, Mootha VK, et al. Gene set enrichment analysis: a knowledge-based approach for interpreting genome-wide expression profiles. Proc Natl Acad Sci U S A. 2005;102(43):15545–15550. | ||
Mootha VK, Lindgren CM, Eriksson KF. PGC-1alpha-responsive genes involved in oxidative phosphorylation are coordinately downregulated in human diabetes. Nat Genet. 2003;34(3):267–273. | ||
Xue D, Lu M, Gao B, Qiao X, Zhang Y. Screening for transcription factors and their regulatory small molecules involved in regulating the functions of CL1-5 cancer cells under the effects of macrophage-conditioned medium. Oncol Rep. 2014;31(3):1323–1333. | ||
Yang S, Zhang H, Guo L, Zhao Y, Chen F. Reconstructing the coding and non-coding RNA regulatory networks of miRNAs and mRNAs in breast cancer. Gene. 2014;548(1):6–13. | ||
Bi M, Naczki C, Koritzinsky M, et al. ER stress-regulated translation increases tolerance to extreme hypoxia and promotes tumor growth. EMBO J. 2005;24(19):3470–3481. | ||
Sheveleva EV, Landowski TH, Samulitis BK, Bartholomeusz G, Powis G, Dorr RT. Imexon induces an oxidative endoplasmic reticulum stress response in pancreatic cancer cells. Mol Cancer Res. 2012;10(3):392–400. | ||
Goode EL, Maurer MJ, Sellers TA, et al. Inherited determinants of ovarian cancer survival. Clin Cancer Res. 2010;16(3):995–1007. |
Supplementary materials
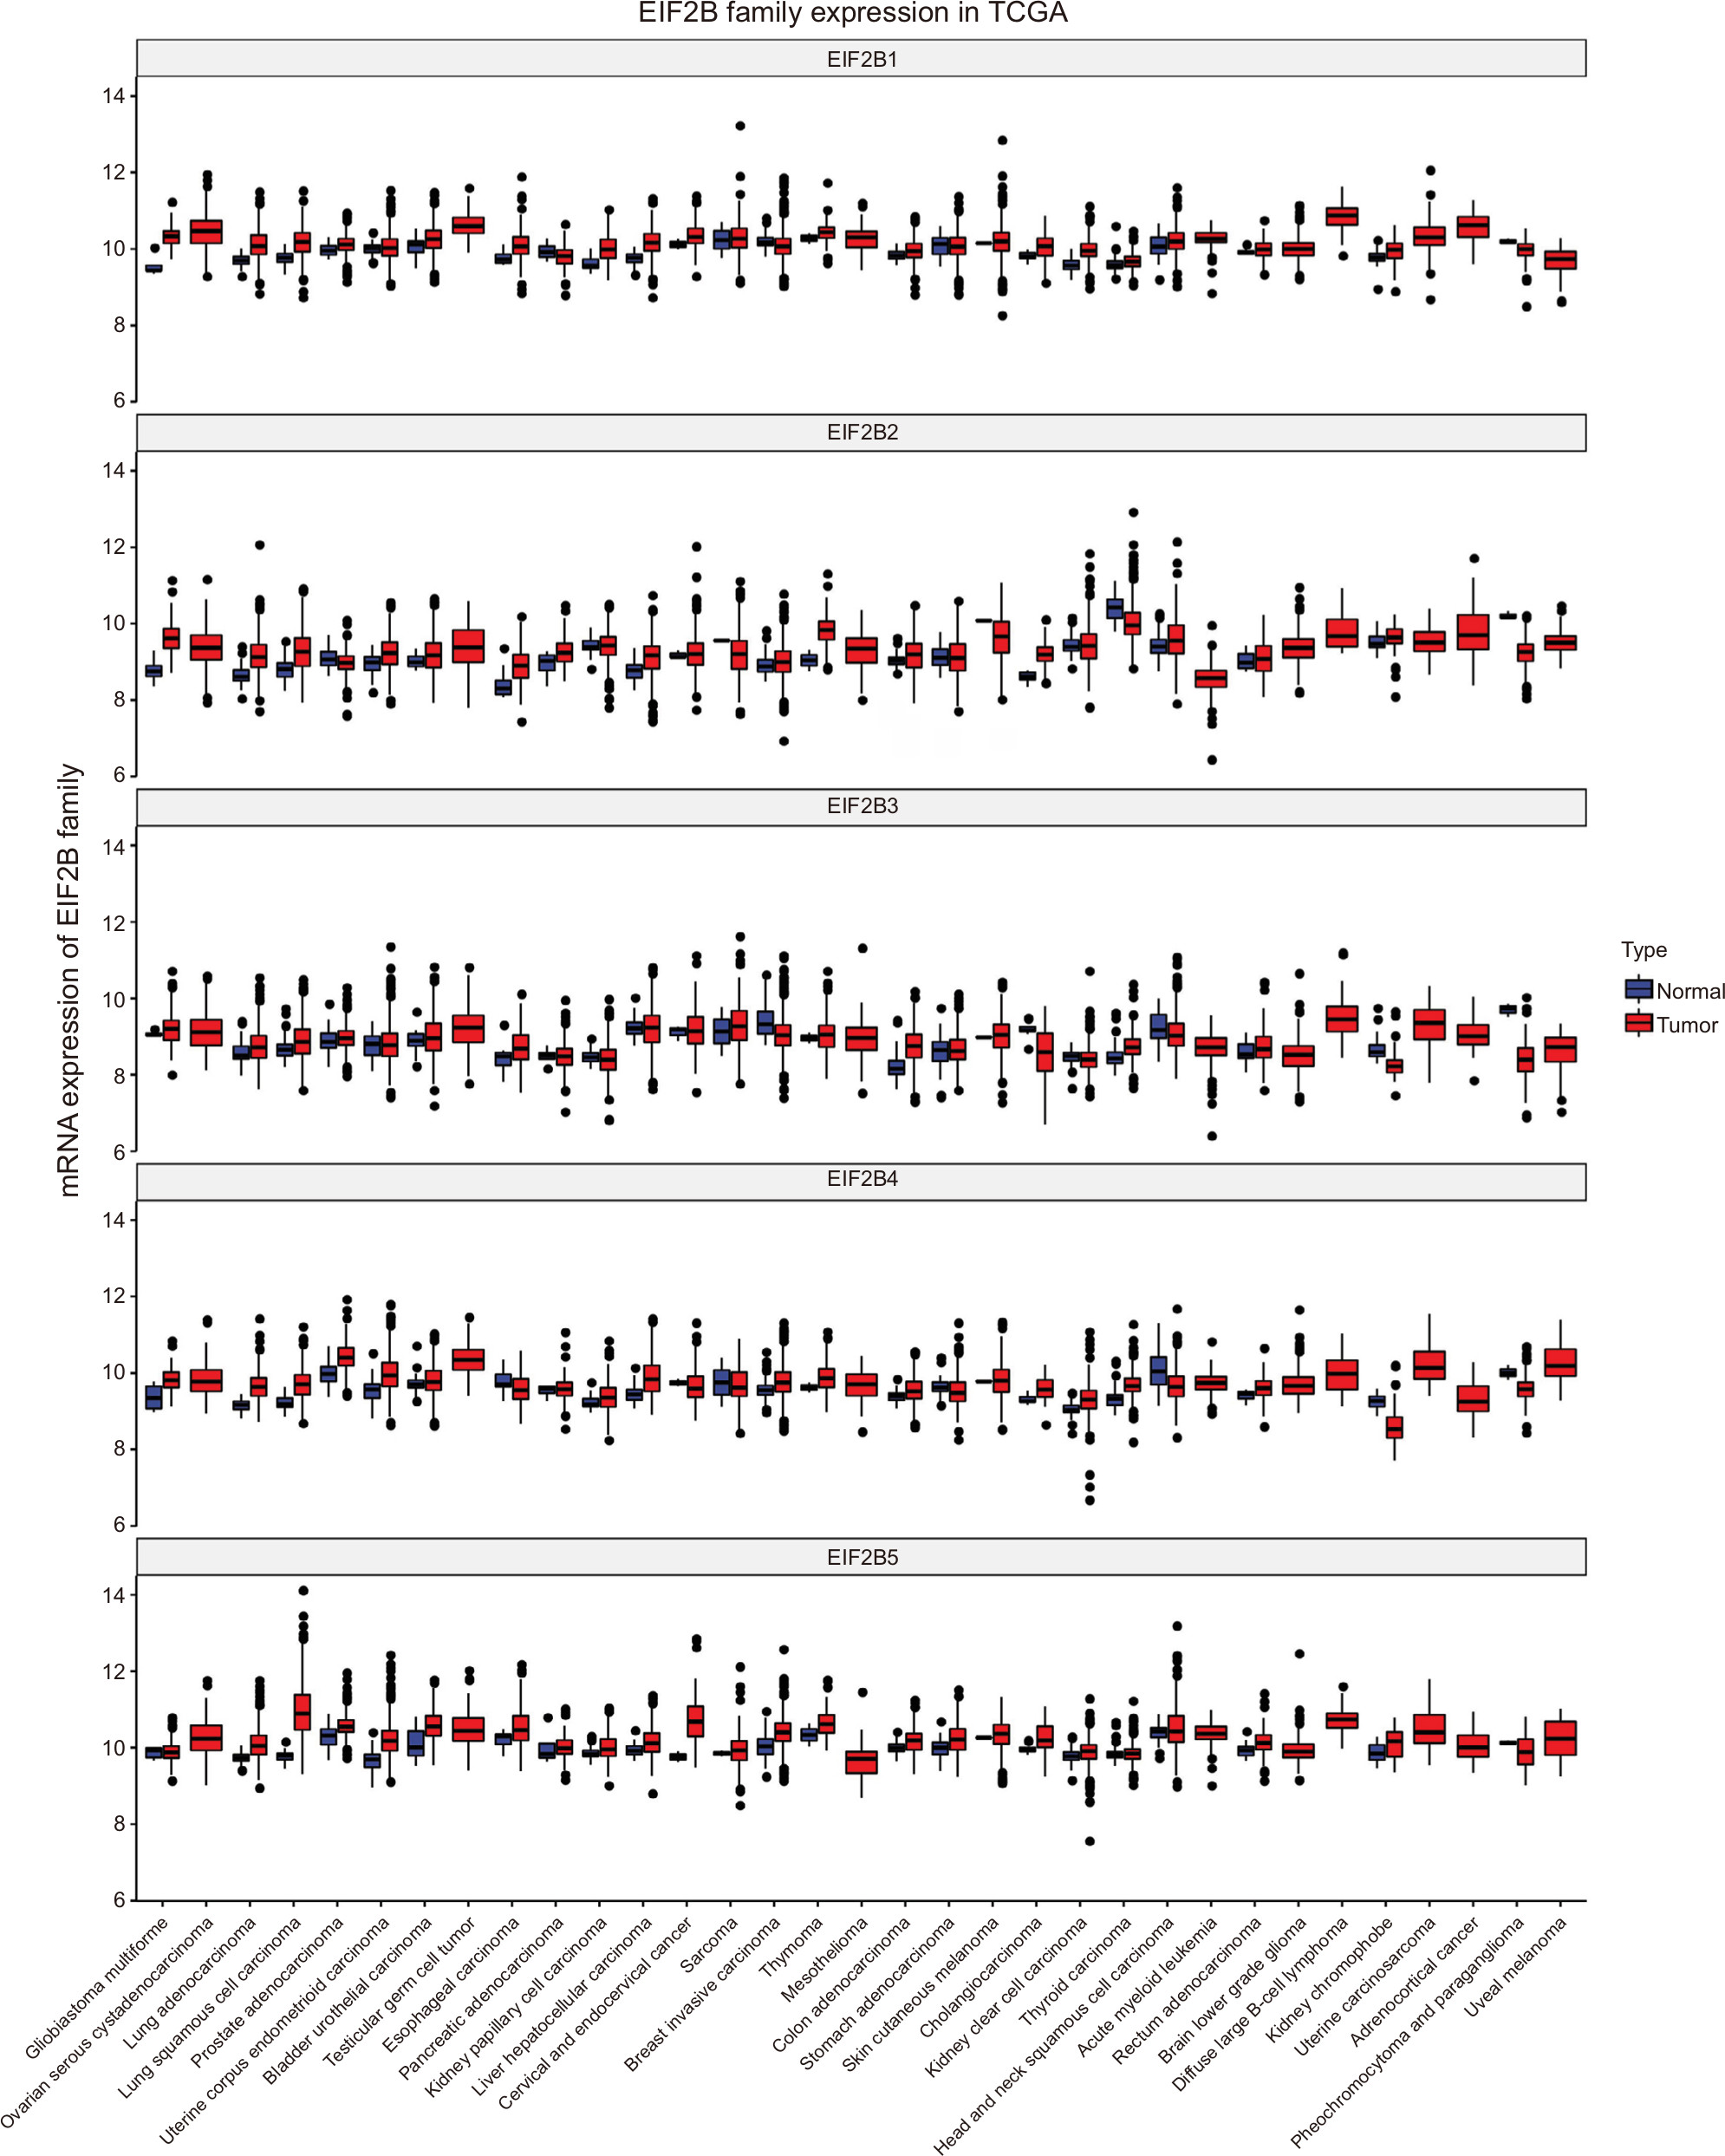 | Figure S1 Boxplot of EIF2B family’s expression in TCGA. Abbreviation: TCGA, The Cancer Genome Atlas. |
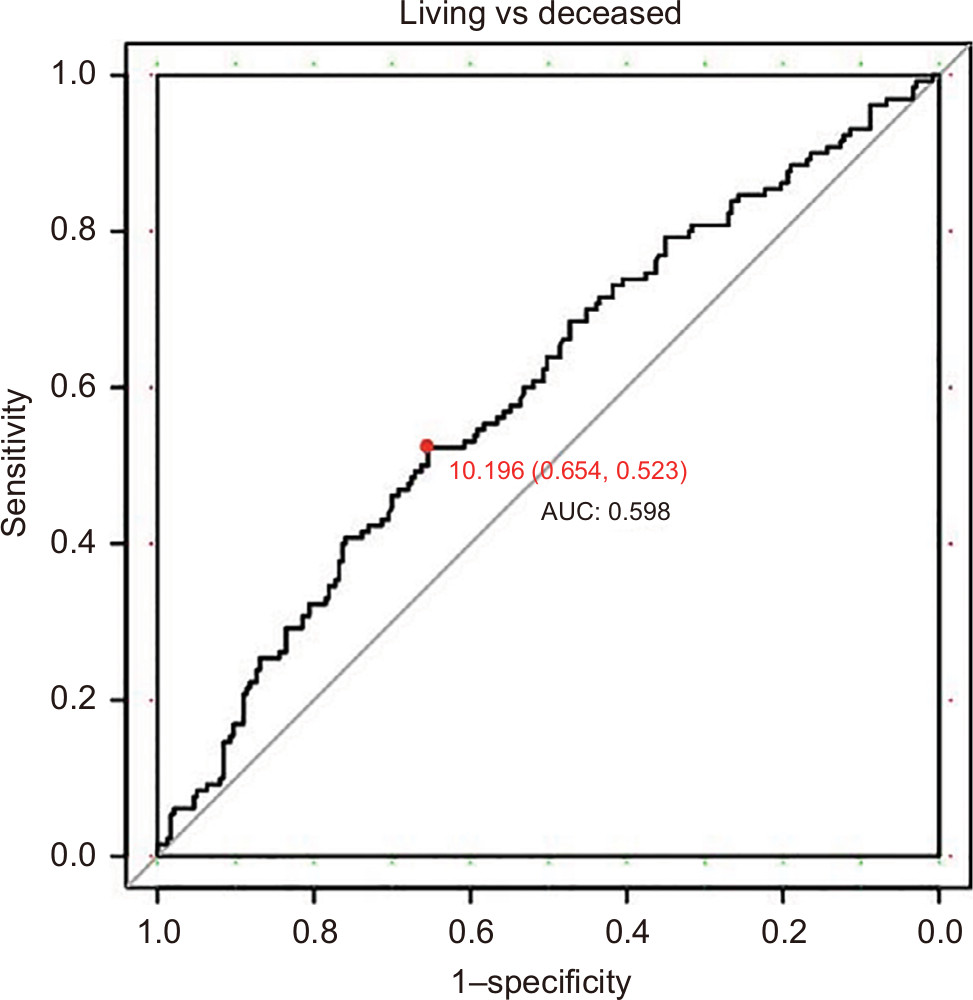 | Figure S2 ROC curve to identify the optimal cutoff value for dividing patients into high and low EIF2B5 expression groups. Abbreviations: AUC, area under the curve; ROC, receiver-operating characteristic curve. |
 © 2018 The Author(s). This work is published and licensed by Dove Medical Press Limited. The
full terms of this license are available at https://www.dovepress.com/terms
and incorporate the Creative Commons Attribution
- Non Commercial (unported, 3.0) License.
By accessing the work you hereby accept the Terms. Non-commercial uses of the work are permitted
without any further permission from Dove Medical Press Limited, provided the work is properly
attributed. For permission for commercial use of this work, please see paragraphs 4.2 and 5 of our Terms.
© 2018 The Author(s). This work is published and licensed by Dove Medical Press Limited. The
full terms of this license are available at https://www.dovepress.com/terms
and incorporate the Creative Commons Attribution
- Non Commercial (unported, 3.0) License.
By accessing the work you hereby accept the Terms. Non-commercial uses of the work are permitted
without any further permission from Dove Medical Press Limited, provided the work is properly
attributed. For permission for commercial use of this work, please see paragraphs 4.2 and 5 of our Terms.