
Back to Journals » International Journal of Nanomedicine » Volume 20
Hepatocyte-Targeted Epicatechin Nanoparticles Promote Autophagy and Enhance Mitochondrial Function in Metabolic Dysfunction-Associated Steatotic Liver Disease
Authors Han D  , Lee H, Lee S, Lee K, Lee NK, Jin TE, Lee J, Kim JS, Kim DK, Shin J, Park HW
Received 2 August 2025
Accepted for publication 4 December 2025
Published 11 December 2025 Volume 2025:20 Pages 14911—14933
DOI https://doi.org/10.2147/IJN.S557902
Checked for plagiarism Yes
Review by Single anonymous peer review
Peer reviewer comments 3
Editor who approved publication: Professor Lijie Grace Zhang
Daewon Han,1,2,* Hyeji Lee,1,* Solji Lee,1 Kyubae Lee,3 Nam-Kyung Lee,4,5 Tae-Eun Jin,6 Junguee Lee,7 Jong-Seok Kim,1,2 Do Kyung Kim,8 Jongdae Shin,1,2 Hwan-Woo Park1,2
1Department of Cell Biology, Konyang University College of Medicine, Daejeon, 35365, Republic of Korea; 2Myunggok Medical Research Institute, Konyang University College of Medicine, Daejeon, 35365, Republic of Korea; 3Department of Biomedical Materials, Konyang University, Daejeon, 35365, Republic of Korea; 4Biotherapeutics Translational Research Center, Korea Research Institute of Bioscience and Biotechnology, Daejeon, 34141, Republic of Korea; 5MabTics Co., Ltd., Daejeon, 34141, Republic of Korea; 6Korea Bioinformation Center, Korea Research Institute of Bioscience and Biotechnology, Daejeon, 34141, Republic of Korea; 7Department of Pathology, Konyang University College of Medicine, Daejeon, 35365, Republic of Korea; 8Department of Anatomy, Konyang University College of Medicine, Daejeon, 35365, Republic of Korea
*These authors contributed equally to this work
Correspondence: Hwan-Woo Park, Department of Cell Biology, Konyang University College of Medicine, Daejeon, 35365, Republic of Korea, Tel +82 42 600 8677, Email [email protected]
Introduction: Metabolic dysfunction-associated steatotic liver disease has limited treatment options, posing a serious global health challenge. Epicatechin (EC), a natural flavonoid, exhibits therapeutic potential; however, its clinical utility is hindered by its low solubility and limited bioavailability. Therefore, in this study, we developed liver-targeted EC-loaded galactosylated poly(lactic-co-glycolic acid)-polyethylene glycol nanoparticles (EC@PLGA-PEG-GAL NPs) with high therapeutic efficacy.
Methods: EC@PLGA-PEG-GAL NPs were synthesized, and their physicochemical properties, biocompatibility, and hepatocyte-targeted cellular uptake were characterized. The therapeutic efficacy of the NPs was assessed in high-fat diet (HFD)-fed mice, evaluating metabolic dysfunction and hepatic steatosis. Mechanistic studies were performed to investigate the effects on autophagic flux and mitochondrial function.
Results: The EC@PLGA-PEG-GAL NPs exhibited improved EC solubility, sustained drug release, and low cytotoxicity. In HFD-fed mice, administration of EC@PLGA-PEG-GAL NPs significantly ameliorated hepatic steatosis, reduced insulin resistance, and alleviated metabolic dysfunction, without causing toxicity. Mechanistically, these NPs restored the autophagic flux by activating the AMP-activated protein kinase pathway and inhibiting mechanistic target of rapamycin complex 1 signaling, thereby enhancing ubiquitinated protein clearance. They also alleviated mitochondrial dysfunction by enhancing the membrane potential, reducing the reactive oxygen species levels, and promoting mitochondrial biogenesis.
Conclusion: Our findings highlight EC@PLGA-PEG-GAL NPs as promising liver-targeted nanotherapeutics simultaneously modulating autophagy and mitochondrial functions in metabolic dysfunction-associated steatotic liver disease.
Keywords: epicatechin, metabolic dysfunction-associated steatotic liver disease, nanoparticle, autophagy, mitochondrial dysfunction, mechanistic target of rapamycin complex 1
Introduction
Metabolic dysfunction-associated steatotic liver disease (MASLD), formerly known as non-alcoholic fatty liver disease, is a prevalent chronic liver condition closely associated with obesity and insulin resistance.1,2 It is characterized by excessive fat accumulation in the liver (hepatic steatosis) and progresses to more severe forms of liver damage, including steatohepatitis, fibrosis, cirrhosis, and hepatocellular carcinoma.3 Despite its growing burden, effective pharmacological treatments remain limited, underscoring the need for innovative therapeutic strategies.
MASLD pathogenesis is complex, involving lipotoxicity, oxidative stress, mitochondrial dysfunction, and impaired cellular homeostasis, particularly autophagy defects.4,5 Autophagy, a fundamental cellular recycling process, eliminates the lipid droplets, aberrant protein aggregates, and defective organelles.6,7 Lipotoxicity induced by various factors, such as palmitic acid (PA), impairs the autophagic flux, leading to the accumulation of harmful protein aggregates and dysfunctional mitochondria, thereby exacerbating the liver injury in MASLD.8,9 Ubiquitin-binding receptor p62 (also known as SQSTM1) binds to the polyubiquitinated cargo, recruits it to the autophagosomal membranes, and directs it for lysosomal degradation.10 In pathological states, autophagic flux is compromised, impairing this clearance pathway, disrupting the protein turnover, and causing the intracellular accumulation of p62 and ubiquitinated proteins.11,12 Furthermore, mitochondrial dysfunction has been consistently implicated in MASLD, where excessive ROS generation and loss of membrane potential exacerbate hepatic injury.13,14 Currently, pharmacological treatments for MASLD are limited, emphasizing the need for novel therapeutic strategies, such as targeted nanoparticle (NP) drug delivery methods, for MASLD.
Epicatechin (EC), a natural flavonoid in various plants including cocoa and green tea, has been investigated in multiple experimental models of hepatic injury, where it attenuates oxidative stress and improves hepatic enzyme profiles. However, clinical translation remains limited due to poor oral bioavailability, rapid metabolism, inconsistent target exposure, and the small, exploratory nature of existing human studies with heterogeneous outcomes.15–18 NP-based drug delivery systems offer promising solutions to overcome these limitations.19 Poly(lactide-co-glycolic acid) (PLGA), a US Food and Drug Administration-approved polymer, can be formulated into NPs to encapsulate hydrophobic drugs, improve their solubility, and facilitate their sustained release.20,21 Hepatocytes can be specifically targeted by functionalizing the surface of NPs to enhance the therapeutic effects against liver diseases. Galactosamine (GAL), a ligand for the asialoglycoprotein receptor (ASGPR), which is abundantly expressed on the surface of hepatocytes, can be conjugated to NPs to facilitate liver-specific uptake and improve the therapeutic outcomes.22,23
In this study, we developed EC-loaded galactosylated PLGA-poly (ethylene glycol) (PEG) NPs (EC@PLGA-PEG-GAL NPs) to specifically target hepatocytes and assess their therapeutic efficacy using cellular and murine MASLD models. First, we investigated the physicochemical properties, biocompatibility, hepatocyte-specific uptake capacity, therapeutic effects on metabolic parameters, and liver pathology of EC@PLGA-PEG-GAL NPs. We further explored the molecular mechanisms underlying EC@PLGA-PEG-GAL NP-induced restoration of the autophagic flux and mitochondrial functions. Our findings provide valuable insights for the development of nanomedicine-based strategies for MASLD treatment via targeted drug delivery and modulation of cellular pathways.
Materials and Methods
Materials
PLGA (50:50; IV 0.2 dL/g; acid-terminated) was obtained from Polysciences (IL, USA). NH2-PEG-COOH, N,N′-dicyclohexylcarbodiimide (DCC), N-hydroxysuccinimide (NHS), ethylenediamine, poly(vinyl alcohol) (PVA; 90% hydrolyzed with an Mw of 9000–10,000), bafilomycin A1, compound C, fatty acid-free bovine serum albumin (BSA), and PA were supplied by Sigma-Aldrich (St Louis, MO, USA). Ethyl acetate was purchased from Junsei Chemical Co., Ltd. (Tokyo, Japan). EC, D-(+)-GAL hydrochloride, fluorescein 5-isothiocyanate (FITC, isomer I), and indocyanine green-carboxylic acid (ICG-COOH) were purchased from Tokyo Chemical Industry (Tokyo, Japan). Antibodies against p62, phospho-AMP-activated protein kinase (p-AMPK), AMPK, p-p70S6K, and p70S6K were obtained from Cell Signaling Technology (Beverly, MA, USA). β-actin and α-tubulin antibodies were provided from DSHB (Iowa City, IA, USA). Anti-glyceraldehyde-3-phosphate dehydrogenase (GAPDH) antibody was obtained from Aviva Systems Biology (San Diego, CA, USA).
Preparation of EC@PLGA-PEG-GAL NPs
PLGA-PEG copolymer was synthesized by conjugating COOH-PEG-NH2 to carboxylic acid-terminated PLGA via DCC/NHS coupling reaction. Briefly, PLGA (1 g) was dissolved in 10 mL of anhydrous dimethylformamide (Sigma-Aldrich), followed by the addition of NHS (23.0 mg; 0.2 mmol) and DCC (41.25 mg; 0.2 mmol). The reaction mixture was stirred at 800 rpm for 24 h at room temperature in the dark under argon atmosphere. To NHS-activated PLGA was then precipitated using cold diethyl ether (Sigma-Aldrich) and collected via centrifugation, and lyophilized to obtain the dried PLGA-PEG copolymer. In the fabrication process, only PLGA-PEG was used as the polymeric matrix to ensure uniform particle formation and controlled physicochemical properties.
Next, GAL (18 mg; 0.1 mmol) was conjugated to NHS-activated PLGA-PEG (1.6 g; 0.1 mmol). Both compounds were dissolved in 10 mL of anhydrous dimethylformamide in a glass vial and stirred at 800 rpm for 24 h in the dark under an argon atmosphere. The reaction mixture was purified via precipitation with diethyl ether and centrifugation under refrigerated conditions. The final product, PLGA-PEG-GAL, was collected and lyophilized to obtained a dry powder.
EC@PLGA-PEG-GAL NPs were prepared using the emulsion–diffusion method, as previously described.20 PLGA-PEG (50 mg) and PLGA-PEG-GAL (50 mg) were dissolved in 4.8 mL of ethyl acetate. Then, 5 mg of EC dissolved in 0.2 mL of methanol (Merck, Damstadt, Germany) was added to each solution, followed by the addition of 1% (w/v) PVA aqueous solution (5 mL) as a stabilizer to form the aqueous phase. The organic and aqueous phases were emulsified via probe sonication at 160 W for 30s in an ice bath. The emulsion was subsequently stirred at 1000 rpm for 6 h at room temperature under argon atmosphere to facilitate solvent evaporation. Following NP formation, the suspension was purified by dialysis (MWCO 12–14 kDa) against distilled water for 6 h, with periodic replacement of the medium to remove any unencapsulated EC and residual solvent. The purified NPs were then lyophilized to obtain the dry EC@PLGA-PEG-GAL NPs. The coupling reactions were conducted in an anhydrous dimethylformamide (DMF) medium under an argon atmosphere at room temperature. The reaction mixture was maintained at a mildly basic pH of approximately 8.0 by the controlled addition of borate buffer, which facilitates the activation of carboxyl groups and promotes efficient amide bond formation during NHS/DCC-mediated coupling.
Characterization of EC@PLGA-PEG-GAL NPs
Measurement of Particle Size, PDI, and ζ-Potential
Hydrodynamic diameter, polydispersity index (PDI), and ζ-potential were measured by dynamic light scattering (DLS) using a Zetasizer Nano ZS (Malvern Instruments, Malvern, UK).
Fourier-Transform Infrared (FTIR) Spectroscopy
FTIR spectra were recorded using the Bruker VERTEX 80v Vacuum FTIR Spectrometer (Ettlingen, Germany) equipped with a deuterated triglycine sulfate detector. All measurements were taken in the attenuated total reflectance mode across a wavenumber range from 4000 to 400 cm−1, with a spectral resolution of 4 cm−1 and average 32 scans per sample. The samples were directly analyzed without additional preparation.
Scanning Electron Microscopy (SEM) Imaging
NP morphological characteristics were examined via field-emission SEM (SU7000; HITACHI, Tokyo, Japan). NPs were dispersed in distilled water, ultrasonicated to ensure uniform dispersion, and subsequently deposited on Si wafers or Al stubs. After air-drying overnight at room temperature, the samples were coated with a thin layer of Pt using a sputter coater to minimize the charging effects. SEM imaging was performed at an accelerating voltage of 0.1–30 kV, and representative micrographs were captured at various magnifications to accurately assess the particle shape, uniformity, and surface characteristics.
Nuclear Magnetic Resonance (NMR) Analysis
Structural integrity and chemical conjugation of PLGA-PEG and PLGA-PEG-GAL NPs were assessed via proton (1H) NMR spectroscopy (Avance Neo 400 MHz; Bruker, Billerica, MA, USA). The samples were dissolved in CDCl3 and analyzed using a high-resolution NMR spectrometer typically operating at 400 MHz. The δ/ppm values of all1 H-NMR peaks were referenced to tetramethylsilane.
Matrix-Assisted Laser Desorption/Ionization Time-of-Flight Mass Spectrometry (MALDI-TOF-MS)
The molecular weights of PLGA-PEG and PLGA-PEG-GAL copolymers were measured using a MALDI-TOF mass spectrometer (Bruker Autoflex Speed, Bremen, Germany). Samples of PLGA-PEG and PLGA-PEG-GAL were dissolved in chloroform (2 mg/mL) and mixed with the matrix solution consisting of 2,5-dihydroxybenzoic acid (10 mg/mL) at a 1:10 (v/v) ratio. One microliter of each mixture was spotted onto a stainless-steel target plate and air-dried.
Drug Loading Content and Encapsulation Efficiency
Drug loading content (DL, %) and encapsulation efficiency (EE, %) for EC were quantified using a UV–Vis calibration curve. Briefly, freshly prepared NP dispersions were placed in dialysis tubing bags (MWCO 10–30 kDa) to separate unencapsulated EC. The EC content in the filtrate was measured at 400 nm using a UV–Vis spectrophotometer (Eppendorf, Hamburg, Germany), with external standards prepared in phosphate-buffered saline (PBS) buffer containing 0.1% Tween-20 (v/v) over a validated linear range. Drug loading and encapsulation efficiency were calculated using the following formula:


Release Profile of the Drug in vitro
In vitro release of EC from EC@PLGA-PEG and EC@PLGA-PEG-GAL NPs was investigated using the previously described dialysis membrane method.20 Lyophilized NPs were suspended in a dissolution medium (pH 7.4 and 5.5) of PBS containing 0.1% Tween-20 (v/v) and maintained at 37 °C with shaking at 85 rpm. At the predetermined time points, 100 μL of the samples were collected, and EC levels in the samples were analyzed at 400 nm using a UV–Vis spectrophotometer. Finally, drug release percentage was calculated using the following formula:

Cell Culture and Treatment
The HepG2 (human hepatocellular carcinoma) and HEK293T (human embryonic kidney) cell lines were obtained from Korean Cell Line Bank (Seoul, South Korea). Cells were propagated in DMEM (Welgene, Daegu, South Korea) containing 10% FBS (Welgene) and antibiotics (penicillin–streptomycin, 100 U/mL), under standard culture conditions at 37 °C. To investigate the effects of PA, the cells were treated with 500 μM PA for specific durations, as described by Kim et al.24 The controls were treated with fatty acid-free BSA (Sigma-Aldrich), which served as a vehicle for comparison.
Plasmids and Viral Transduction
HEK293T cells were transfected with the sh-luciferase (sh-Luc) or sh-TSC2 constructs (gifted by Dr. Andrei V. Budanov, Trinity College Dublin, Ireland) and packaging plasmids using polyethylenimine (Sigma-Aldrich) as a transfection reagent. Culture supernatants containing lentivirus were collected at 48 and 72 h post-transfection, filtered using a 0.45 µm syringe filter (Pall Life Sciences, Port Washington, NY, USA). The resulting lentiviruses were used to transduce HepG2 cells in the presence of 4 μg/mL polybrene (Sigma-Aldrich).
Animal Experiments
All animal experiments were approved by the Institutional Animal Care and Use Committee of Konyang University (approval no. P-23-33-A-01). Male C57BL/6 mice (8 weeks old) were obtained from Samtako (Osan, Korea) and housed under standardized conditions (21–24 °C and 50 ± 5% humidity) with a 12-h light/12-h dark photoperiod. The mice were provided ad libitum access to water and fed either a standard low- or high-fat diet (HFD) to obtain 60% of calories from fat (Research Diets, New Brunswick, NJ, USA). EC@PLGA-PEG and EC@PLGA-PEG-GAL NPs were formulated to deliver 20 mg/kg EC (equivalent to 220 mg/kg NPs) to mice via intravenous injections. After nine weeks of HFD feeding, the mice were intravenously injected with the indicated formulations every other day for three weeks. At the end of the experimental period, the animals were euthanized via CO2 inhalation. Their blood, liver, and epididymal white adipose tissues were collected, snap-frozen in liquid nitrogen, and stored at –80 °C for molecular analyses.
Cytotoxicity Assay
Cytotoxicity was assessed via WST-8 assay using the WST-8 Cell Counting Kit (Biomax, Seoul, South Korea), following the manufacturer’s protocol. HepG2 cells were seeded in a 96-well plate (SPL, Seoul, South Korea) at a density of 1×10⁴ cells/well in 100 μL of the culture medium. After overnight incubation for cell attachment, the cells were treated with (-)-EC (dissolved in dimethyl sulfoxide), EC@PLGA-PEG NPs, EC@PLGA-PEG-GAL NPs, or vehicle control (dimethyl sulfoxide), as required. Subsequently, 10 μL of WST-8 reagent was added to each well, and the plate was incubated at 37 °C in a humidified atmosphere with 5% CO2 for 30 min. The optical density at 450 nm was recorded with the Epoch 2 plate reader (BioTek Instruments, Winooski, VT, USA). Cytotoxicity was calculated as a percentage relative to that of the control.
Cellular Uptake
Next, in vitro cellular uptake of PLGA-FITC, PLGA-PEG-FITC, and PLGA-PEG-GAL-FITC NPs by HepG2 cells was assessed qualitatively via confocal laser scanning microscopy (LSM 700; Carl Zeiss, Jena, Germany) and quantitatively via flow cytometry (Beckman Coulter, Fullerton, CA, USA). HepG2 cells were seeded in a 6-well plate (SPL) and incubated overnight. After exposure to NPs for 15, 30, and 60 min, the cells were washed, fixed with 4% paraformaldehyde, stained with 4′,6-diamidino-2-phenylindole (Invitrogen, Waltham, MA, USA), and analyzed via confocal laser scanning microscopy. For quantitative analysis, HepG2 cells were collected, rinsed, and analyzed by flow cytometry, while untreated cells used as controls.
Flow Cytometric Analysis of Apoptosis
HepG2 cells were seeded in a 12-well plate (SPL) at a density of 4 × 10⁵ cells/well and allowed to adhere for 12 h. Subsequently, the cells were treated with the indicated concentrations of (-)-EC, EC@PLGA-PEG NPs, and EC@PLGA-PEG-GAL NPs for 48 h. Following treatment, both suspended and attached cells were harvested, rinsed with ice-cold PBS, and stained using the FITC annexin V/Dead Cell Apoptosis Kit (Thermo Fisher Scientific, Waltham, MA, USA). Finally, the stained cells were analyzed using the CytoFLEX benchtop flow cytometer (Beckman Coulter, Brea, CA, USA).
Mitochondrial Morphology Analysis
Mitochondrial morphology was visualized using MitoTracker Red (Invitrogen). Following the indicated treatment, HepG2 cells were incubated with 50 nM MitoTracker Red in the dark at 37 °C for 30 min. After staining, the cells were gently washed thrice with PBS to remove the excess dye. Fluorescence imaging was performed using a confocal laser scanning microscope. Mitochondrial length was measured and quantified from the fluorescence images using the ImageJ software (National Institutes of Health, Bethesda, MD, USA).
Measurement of the Mitochondrial Reactive Oxygen Species (ROS) Levels
Mitochondrial ROS levels were measured using the MitoSOX Red fluorescent probe (Invitrogen). Following the indicated treatment, HepG2 cells were incubated with 2.5 μM MitoSOX Red in the dark at 37 °C for 20 min. Then, the cells were washed thrice with PBS to remove the excess dye. Fluorescence signals were visualized using a confocal laser scanning microscope.
Determination of the Mitochondrial Δψm
Mitochondrial membrane potential was assessed using JC-1 fluorescence dye (Invitrogen). HepG2 cells were seeded on confocal dishes (SPL), subjected to the indicated treatment, and incubated with 10 μM JC-1 in the dark at 37 °C for 20 min. The cells were washed twice with PBS to remove the excess dye. Fluorescence images were acquired using a confocal laser scanning microscope with appropriate filters for JC-1 monomers (excitation/emission: approximately 488/530 nm) and aggregates (excitation/emission: approximately 540/590 nm). Finally, mitochondrial membrane potential was determined by calculating the red/green fluorescence intensity ratio using the ImageJ software.
Glucose (GTT) and Insulin (ITT) Tolerance Tests
The mice were fasted for 6 h, with free access to water, before the tests. D-glucose (1 g/kg body weight) was intraperitoneally administered to the mice for GTT, whereas insulin (0.65 U/kg body weight) was intraperitoneally injected into the mice for ITT. Blood samples were collected from the tail vein 0, 20, 40, 60, and 120 min after injection. Blood glucose levels were measured using a glucometer (Accu-Chek; Roche Diagnostics, Germany). Glucose clearance was assessed by calculating the area under the curve (AUC) for each group.
Biochemical Measurements
Blood specimens were left to coagulate for 30 min at ambient temperature and subsequently centrifuged at 1,000 × g for 15 min to obtain the serum samples. Serum concentrations of alanine aminotransferase, aspartate aminotransferase, and alkaline phosphatase were quantified using their respective assay kits (BioVision, Milpitas, CA, USA), according to the manufacturer’s protocols.
Solubility Fractionation
Solubility-based protein fractionation was performed as previously described.24 Cells and tissues were lysed and spun at 12,000 × g for 15 min at 4 °C. Triton X-100–soluble proteins were obtained from the supernatants, while the pellets were re-extracted in 2% SDS lysis buffer to obtain the Triton X-100-insoluble fractions. Both the soluble and insoluble fractions were boiled in the Laemmli sample buffer and analyzed via SDS-polyacrylamide gel electrophoresis, followed by immunoblotting.
Immunoblotting
Frozen liver tissues and cells were lysed using the radioimmunoprecipitation assay buffer supplemented with a complete protease inhibitor cocktail (Roche Diagnostics, Basel, Switzerland). Protein concentrations were determined using a BCA assay kit (Thermo Fisher Scientific). Equal amounts of proteins were separated via SDS-polyacrylamide gel electrophoresis and transferred onto polyvinylidene difluoride membranes (Merck Millipore, Burlington, MA, USA). The membranes were blocked with 5% non-fat dry milk or BSA in Tris-buffered saline containing 0.1% Tween-20 at room temperature for 1 h and incubated overnight at 4 °C with antibodies against ubiquitin, p62, total and phosphorylated AMPK and p70S6K, as well as GAPDH, α-tubulin, and β-actin. After washing with Tris-buffered saline containing 0.1% Tween-20, the membranes were incubated with the appropriate horseradish peroxidase-conjugated secondary antibodies (Bio-Rad, Herules, CA, USA). Protein bands were visualized using an enhanced chemiluminescence detection system (Thermo Fisher Scientific) and imaged using the Fusion Solo imaging system (Vilber Lourmat, Torcy, France). Densitometric analysis of the bands was performed with the ImageJ (NIH) and normalized to those of the loading controls, β-actin or GAPDH.
Histological Analysis
Liver tissues were histologically evaluated via hematoxylin and eosin (H&E) and oil red O staining, as previously described.25 For H&E staining, the tissues were fixed with 10% formalin, processed into paraffin blocks, sectioned, and stained with H&E. For lipid visualization, frozen liver tissues mounted in OCT compound (Sakura Finetek, Torrance, CA, USA) were cryosectioned and stained with oil red O (Sigma-Aldrich), according to the manufacturer’s instructions. All stained sections were analyzed under a light microscope integrated with a digital camera system (Leica, Wetzlar, Germany).
Hemolysis Assay
Fresh mouse blood was centrifuged at 500 × g for 10 min to isolate red blood cells (RBCs). The RBC pellet was washed with PBS (pH 7.4) and resuspended to obtain a 2% (v/v) RBC suspension. NP dispersions at various concentrations (0.34–2.75 mg/mL) were incubated with the RBC suspension at 37 °C for 1 h. After incubation, samples were centrifuged at 1,000 × g for 10 min, and the absorbance of the supernatant was measured at 540 nm. The percentage of hemolysis was calculated as:

Quantitative Real-Time RT-PCR
Total RNA was extracted from the liver tissue and cell samples using the TRIzol reagent (Invitrogen), according to the manufacturer’s instructions. cDNA was synthesized from 1 μg of total RNA using a reverse transcription kit (BioFact, Seoul, Korea), according to the manufacturer’s protocol. Quantitative real-time PCR was performed using the SYBR Green qPCR Master Mix (BioFact) on the QuantStudio 3 Real-Time PCR System (Life Technologies, Carlsbad, CA, USA). Gene expression levels were quantified using the comparative Ct (ΔΔCt) method and normalized to cyclophilin A. The sequences of all primers used in this study are provided in Table S1.
Statistical Analyses
Data are represented as the mean ± standard error of the mean of at least three independent experiments, unless otherwise indicated. Statistical comparisons between two groups were performed using a two-tailed Student’s t-test. Multigroup comparisons were performed via one-way analysis of variance, followed by Tukey’s post-hoc test. Statistical significance was set at p < 0.05.
Results
Characterization of EC@PLGA-PEG-GAL NPs
EC@PLGA-PEG-GAL NPs were synthesized and characterized in this study. Their structure was confirmed via 1H NMR spectroscopy, which revealed characteristic peaks at 3.37 (amide bond), 2.88 and 2.90 (–CH2 in PEG), 4.82 (–CH2 in PLGA), and 5.20 (–CH in PLGA) ppm (Figure 1A). Conjugation of GAL to PEG was confirmed by the presence of peaks in the 3.42–3.59 ppm range, corresponding to the chemical interaction between GAL and PEG. NP morphology was examined via SEM, which revealed that both blank and EC@PLGA-PEG-GAL NPs were spherical in shape with a uniform size distribution and smooth surface (Figure 1B). Similar spherical morphology was observed in both the blank and EC@PLGA-PEG NPs (Figure S1A). Dynamic light scattering analysis indicated that the average hydrodynamic diameter of the PLGA-PEG-GAL and EC@PLGA-PEG-GAL NPs was approximately 243 nm, with polydispersity indices of 0.149 and 0.124, respectively (Figure 1C and Table S2), consistent with the values for their non-galactosylated NPs (Figure S1B). The zeta potential (mV), encapsulation efficiency (EE, % w/w), and drug loading (DL, %) values of the EC@PLGA-PEG and EC@PLGA-PEG-GAL formulations are summarized in Table S2. FTIR spectroscopy was performed to confirm EC encapsulation and surface functionalization. FTIR spectra of PEGylated-PLGA polymers were observed with characteristic peaks at 1,741 (C–O stretch of carbonyl group), 2,874–2,905 (C–H bending vibration), and 1,678 (N–H bending of primary amine) cm−1 (Figures 1D and S1C). Blank PLGA-PEG, EC@PLGA-PEG, and EC@PLGA-PEG-GAL NPs showed similar peaks around 1,741 and 2,905 cm−1, as observed for the PLGA polymer. The narrow and broad peaks at 1448 and 1524 cm−1 in GAL-conjugated NPs are attributed to C–N and N–H bending vibrations, confirming the successful conjugation of GAL onto the NP surface. Additionally, the weak and broadened O–H stretching band observed in the 3500–3200 cm−1 region for EC-loaded NPs corresponds to hydrogen-bonding interactions between EC and the polymeric matrix, indicating successful drug encapsulation within the NPs. MALDI-TOF analysis demonstrated the expected molecular weight shift following GAL conjugation. The PLGA-PEG copolymer exhibited a molecular ion peak at approximately m/z = 15,353, whereas PLGA-PEG-GAL showed a corresponding peak at approximately m/z = 15,515, confirming the addition of a galactose unit (Δ ≈ 162 Da) (Figure 1E). Subsequently, aqueous dispersibility of NPs was visually assessed. In contrast to free EC, which exhibited poor solubility in water, both EC@PLGA-PEG and EC@PLGA-PEG-GAL NPs formed stable homogenous dispersions at an equivalent EC concentration (100 μg/mL), indicating improved solubility upon NP encapsulation (Figure 1F). Release profiles of EC from PLGA-PEG and PLGA-PEG-GAL NPs were studied at a physiological pH 7.4 and pH 5.5 over ten days. Free EC exhibited an initial burst release within the first 1–2 h, during which the majority of the compound rapidly dissolved into the release medium. In contrast, both EC@PLGA-PEG and EC@PLGA-PEG-GAL NPs exhibited an obvious burst release of up to 30% EC within the initial 24 h, followed by a sustained release of up to 90% EC within eight days (Figure 1G). This controlled release behavior suggests that the PLGA-PEG-based nanocarrier system effectively regulates EC delivery in a physiological environment.
 |
Figure 1 Characterization of epicatechin (EC)-loaded galactosylated poly(lactic-co-glycolic acid)-polyethylene glycol nanoparticles (EC@PLGA-PEG-GAL NPs). (A) Schematic representation and proton nuclear magnetic resonance (1H NMR) spectrum of PLGA, PLGA-PEG NPs, and EC@PLGA-PEG-GAL NPs. (B) Scanning electron microscopy (SEM) images of PLGA-PEG-GAL and EC@PLGA-PEG-GAL NPs. Scale bar, 200 nm. (C) Size distribution of PLGA-PEG-GAL and EC@PLGA-PEG-GAL NPs. (D) Fourier-transform infrared (FTIR) spectra of EC, PLGA-PEG-GAL NPs, EC@PLGA-PEG NPs, and EC@PLGA-PEG-GAL NPs. (E) MALDI-TOF MS spectra of PLGA-PEG and PLGA-PEG-GAL (F) Photographs of EC, EC@PLGA-PEG NPs, and EC@PLGA-PEG-GAL NPs in water (100 μg/mL EC). (G) In vitro release profiles of free EC, EC@PLGA-PEG, and EC@PLGA-PEG-GAL NPs in phosphate-buffered saline (PBS) containing 0.05% Tween-20 at 37 °C. Data are represented as the mean ± standard error (SE). |
Biocompatibility and Safety of EC@PLGA-PEG-GAL NPs
Cytotoxicity of free EC in HepG2 human hepatic cells was assessed via WST-8 assay. The results showed a dose-dependent reduction in cell viability at 24 and 48 h (Figure S2). In vitro cytotoxicity was tested by exposing HepG2 cells to different concentrations of PBS, free EC, PLGA-PEG-GAL NPs, EC@PLGA-PEG NPs, and EC@PLGA-PEG-GAL NPs for 48 h. WST-8 assay revealed that EC@PLGA-PEG-GAL NPs maintained high cell viability even at the highest tested EC concentration (250 μg/mL; Figure 2A). However, free EC showed significant cytotoxicity at high concentrations (125 μg/mL). Flow cytometric analysis via annexin V-FITC and propidium iodide staining showed that free EC significantly increased the apoptotic cell proportions in a dose-dependent manner, whereas the apoptotic cell percentage in the EC@PLGA-PEG-GAL NP group was comparable to that in the control group (Figure 2B and C). Consistently, immunofluorescence staining for cleaved caspase-3 revealed that the percentage of cleaved caspase-3-positive cells was significantly lower in the HepG2 cells treated with EC@PLGA-PEG-GAL NPs than in those treated with free EC (Figure 2D and E). The hemolytic activity of EC@PLGA-PEG NPs and EC@PLGA-PEG-GAL NPs was evaluated to confirm their safety for intravenous administration. The hemolysis percentage remained below 3% for all tested concentrations of both EC@PLGA-PEG and EC@PLGA-PEG-GAL NPs, which is well within the acceptable threshold (<5%) (Figure 2F and G). These results indicate that the nanoparticles are hemocompatible and suitable for systemic administration. To assess the systemic safety, histopathological examination of the major organs (heart, liver, spleen, lung, and kidney) was performed after intravenous administration of PBS and EC@PLGA-PEG-GAL NPs. H&E staining revealed no apparent tissue damage and inflammatory infiltration in the EC@PLGA-PEG-GAL NP group, further confirming the in vivo biocompatibility of the established NP formulation (Figure 2H).
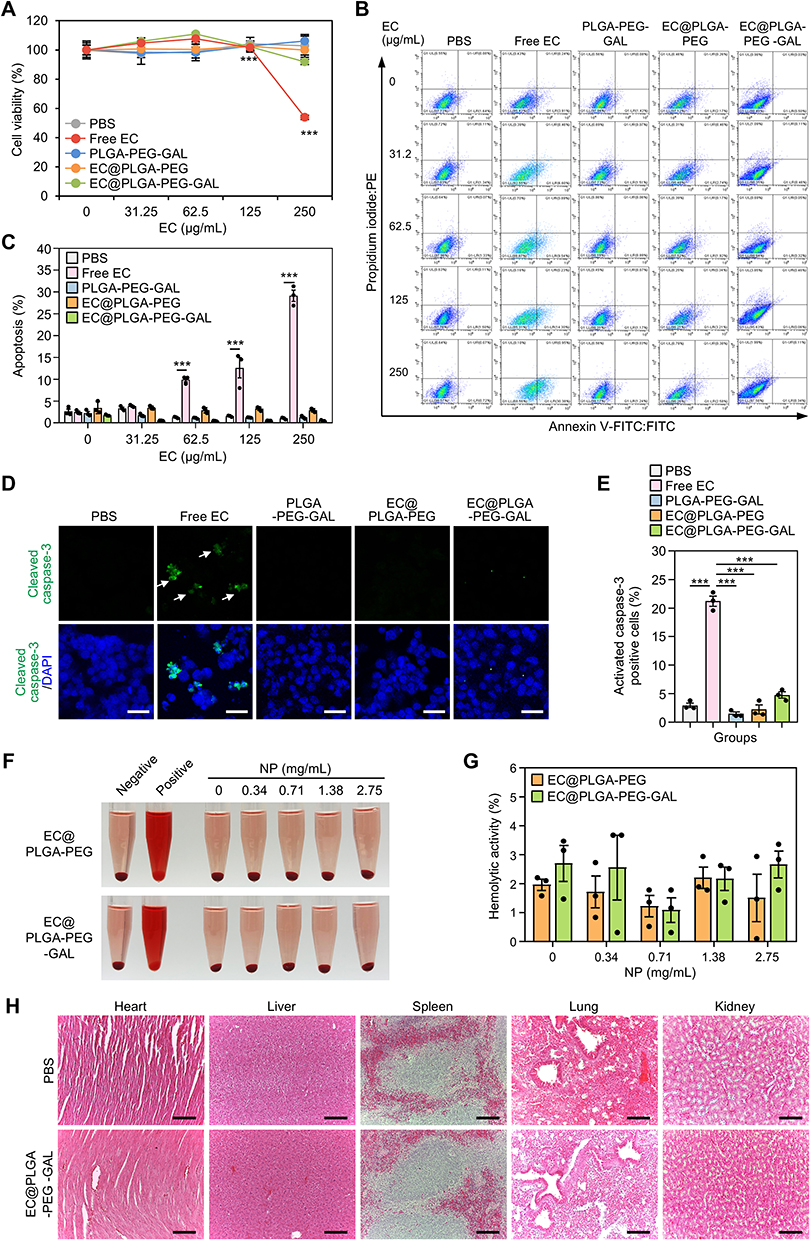 |
Figure 2 Biocompatibility of EC@PLGA-PEG-GAL NPs in vitro and in vivo. (A) Water-soluble tetrazolium salt (WST)-8 assay of HepG2 cells treated with the indicated concentrations of EC (31.25–250 μg/mL) dissolved in PBS, PLGA-PEG-GAL NPs, EC@PLGA-PEG NPs, and EC@PLGA-PEG-GAL NPs for 48 h. (B) Flow cytometric analysis of HepG2 cells stained with annexin V-fluorescein isothiocyanate (FITC) and propidium iodide (PI) after the indicated treatment. (C) Apoptotic cell percentage. (D) Immunofluorescence staining for cleaved caspase-3 levels in HepG2 cells after the indicated treatment for 48 h. Nuclei were stained with Hoechst 33342 (blue). White arrows show cleaved caspase-3 positive cells. Scale bars, 10 μm. (E) Cleaved caspase-3-positive cell percentage. (F and G) Hemolysis assay of EC@PLGA-PEG NPs and EC@PLGA-PEG-GAL NPs. (H) Hematoxylin and eosin (H&E) staining of the heart, liver, spleen, lung, and kidney tissues of mice in each group. Scale bars, 100 μm. Data are represented as the mean ± SE. ***p < 0.001. |
Cellular Uptake and Biodistribution of Galactosylated NPs
We synthesized FITC-labeled NPs (PLGA-FITC, PLGA-PEG-FITC, and PLGA-PEG-GAL-FITC NPs) to evaluate the hepatocyte-targeting efficiency of galactosylated NPs (Figure 3A). Flow cytometric analysis demonstrated the time-dependent cellular uptake of all nanoformulations by HepG2 cells, with PLGA-PEG-GAL-FITC NPs showing significantly higher internalization at 30 and 60 min than their non-galactosylated counterparts (Figure 3B). Quantitative analysis of the mean fluorescence intensity revealed an approximately 1.6-fold higher uptake of PLGA-PEG-GAL-FITC NPs than of PLGA-PEG-FITC NPs at 60 min (Figure 3C). Confocal fluorescence microscopy confirmed the enhanced cellular uptake of PLGA-PEG-GAL-FITC NPs after 60 min of incubation, with the fluorescence primarily localized in the cytoplasm (Figure 3D). These results suggest that GAL attachment to drug-loaded NPs enhances the hepatocyte-specific uptake of NPs via ASGPR-mediated endocytosis.
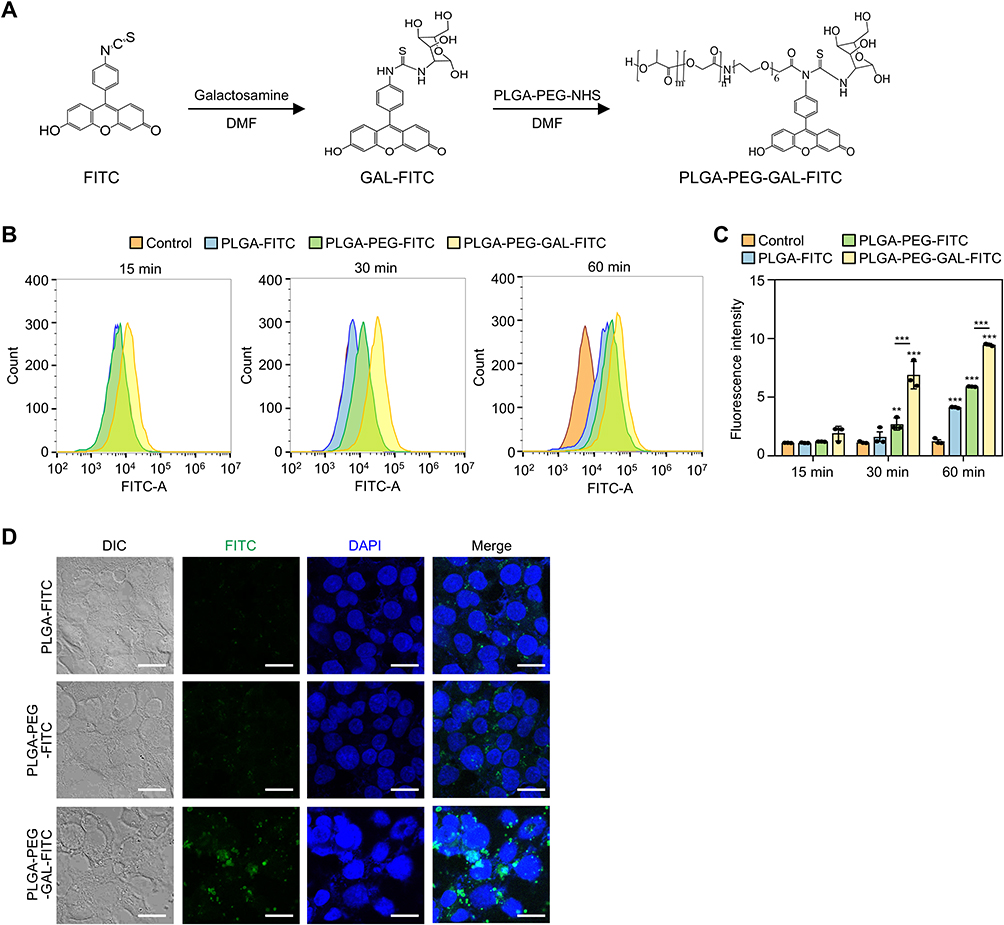 |
Figure 3 Cellular uptake of PLGA-PEG-GAL-FITC NPs. (A) Synthesis of PLGA-PEG-GAL-FITC NPs. (B) Flow cytometric analysis of HepG2 cells treated with PLGA-FITC, PLGA-PEG-FITC, and PLGA-PEG-GAL-FITC NPs for 15, 30, and 60 min. (C) Mean fluorescence intensity of FITC-positive cells. (D) Confocal fluorescence imaging of HepG2 cells treated with PLGA-FITC, PLGA-PEG-FITC, and PLGA-PEG-GAL-FITC NPs for 60 min. Nuclei were stained with 4′,6-diamidino-2-phenylindole (DAPI; blue). Scale bars, 50 μm. Data are represented as the mean ± SE. **p < 0.01, and ***p < 0.001. |
Next, we prepared PLGA-PEG-ICG and PLGA-PEG-GAL-ICG NPs to assess the in vivo biodistribution of NPs (Figure 4A). Ex vivo fluorescence imaging of the harvested organs (heart, liver, spleen, lungs, kidneys, and pancreas) at various time points (0, 1, and 4 h) post-injection revealed the preferential accumulation of PLGA-PEG-GAL-ICG NPs over PLGA-PEG-ICG NPs in the liver (Figure 4B). Quantification of fluorescence intensity showed that the liver uptake of PLGA-PEG-GAL-ICG NPs was significantly higher than that of PLGA-PEG-ICG NPs at 1 and 4 h post-injection (Figure 4C). These results confirmed the liver-targeting capacity of PLGA-PEG-GAL NPs in vivo.
 |
Figure 4 Biodistribution of PLGA-PEG-GAL-ICG NPs in mice. (A) Synthesis of PLGA-PEG-GAL-ICG NPs. (B) Ex vivo fluorescence imaging of the heart, liver, spleen, lung, kidney, and pancreatic tissues 0, 1, and 4 h after treatment with PLGA-PEG-ICG and PLGA-PEG-GAL-ICG NPs. (C) Mean fluorescence intensity in each organ. Data are represented as the mean ± SE. *p < 0.05 and ***p < 0.001. |
EC@PLGA-PEG-GAL NPs Alleviate Obesity-Induced Metabolic Dysfunction
To evaluate the therapeutic effects of EC@PLGA-PEG-GAL NPs in vivo, HFD-fed mice were treated with PBS, free EC, PLGA-PEG-GAL NPs, EC@PLGA-PEG NPs, and EC@PLGA-PEG-GAL NPs for three weeks (Figure 5A). Body weight monitoring revealed that EC@PLGA-PEG-GAL NP-treated mice exhibited significantly lower body weights than the PBS-, free EC-, and PLGA-PEG-GAL NP-treated mice (Figure 5B). This was not associated with the changes in daily food intake and mean food intake (Figure 5C and D). GTT revealed that the EC@PLGA-PEG-GAL NPs significantly improved the glucose clearance in HFD-fed mice, as evidenced by the decreased blood glucose levels at multiple time points following the glucose challenge (Figure 5E). AUC analysis confirmed the significantly improved glucose tolerance in the EC@PLGA-PEG-GAL NP group compared to that in the PBS, free EC, and PLGA-PEG-GAL NP groups (Figure 5F). Similarly, ITT showed enhanced insulin sensitivity in the EC@PLGA-PEG-GAL NP group, as reflected by the considerable reduction in blood glucose levels following insulin administration (Figure 5G). AUC for ITT was significantly lower in the EC@PLGA-PEG-GAL NP group than in the control group (Figure 5H). These findings suggest that the targeted delivery of EC effectively alleviates HFD-induced insulin resistance.
 |
Figure 5 EC@PLGA-PEG-GAL NPs alleviate high-fat diet (HFD)-induced obesity insulin resistance. (A–G) Eighteen-week-old HFD-fed mice treated with PBS, free EC, PLGA-PEG-GAL NPs, EC@PLGA-PEG NPs, or EC@PLGA-PEG-GAL NPs for three weeks (thrice per week). (A) Experimental design. (B) Body weight changes in HFD-fed mice during treatment. (C) Daily food intake. (D) Mean food intake. (E) Glucose (GTT) and (G) insulin (ITT) tolerance tests of Low-fat diet (LFD)-fed mice and HFD-fed mice treated with PBS, free EC, PLGA-PEG-GAL NPs, EC@PLGA-PEG NPs, or EC@PLGA-PEG-GAL NPs. (F and H) Area under the curve values in GTT and ITT. Data are represented as the mean ± SE. **p < 0.01, and ***p < 0.001. |
EC@PLGA-PEG-GAL NPs Ameliorate Hepatic Steatosis in Obese Mice
To determine whether EC@PLGA-PEG-GAL NPs inhibit hepatic lipid accumulation, liver morphology and functions were examined in HFD-fed mice. Gross examination of liver tissues revealed that the HFD-fed mice treated with PBS exhibited enlarged pale livers characteristic of steatosis, whereas those treated with EC@PLGA-PEG-GAL NPs showed livers with an appearance similar to that of low-fat diet-fed mouse livers (Figure 6A). Consistently, liver mass was significantly lower in the EC@PLGA-PEG-GAL NP group than in the PBS group (Figure 6B). Serum biochemical parameter analysis indicated that the EC@PLGA-PEG-GAL NPs effectively alleviated the HFD-induced liver injury, as evidenced by the significantly lower alanine aminotransferase, aspartate aminotransferase, and alkaline phosphatase levels in the EC@PLGA-PEG-GAL NP group than in the PBS group (Figure 6C–E). Histological examination via H&E and oil red O staining further confirmed the hepatoprotective effects of EC@PLGA-PEG-GAL NPs, revealing markedly reduced hepatic lipid accumulation compared to those in the PBS and PLGA-PEG-GAL NP groups (Figure 6F). Quantitative analysis revealed a significantly low MASLD activity score and small oil red O-stained area in the EC@PLGA-PEG-GAL NP group (Figure 6G and H). Molecular analysis of hepatic gene expression levels revealed that the EC@PLGA-PEG-GAL NPs significantly downregulated the lipogenic gene (SREBP1c, FAS, SCD1, and ACC) levels and upregulated the fatty acid oxidation gene (PGC-1α, CPT1α, and Acox1) levels compared to those in the PBS group (Figure 6I and J). Additionally, EC@PLGA-PEG-GAL NPs significantly reduced the inflammatory gene (TNFα, IL-6, IL-1β, and MCP-1) levels in the livers of HFD-fed mice (Figure S3), exerting anti-inflammatory effects in addition to providing metabolic benefits.
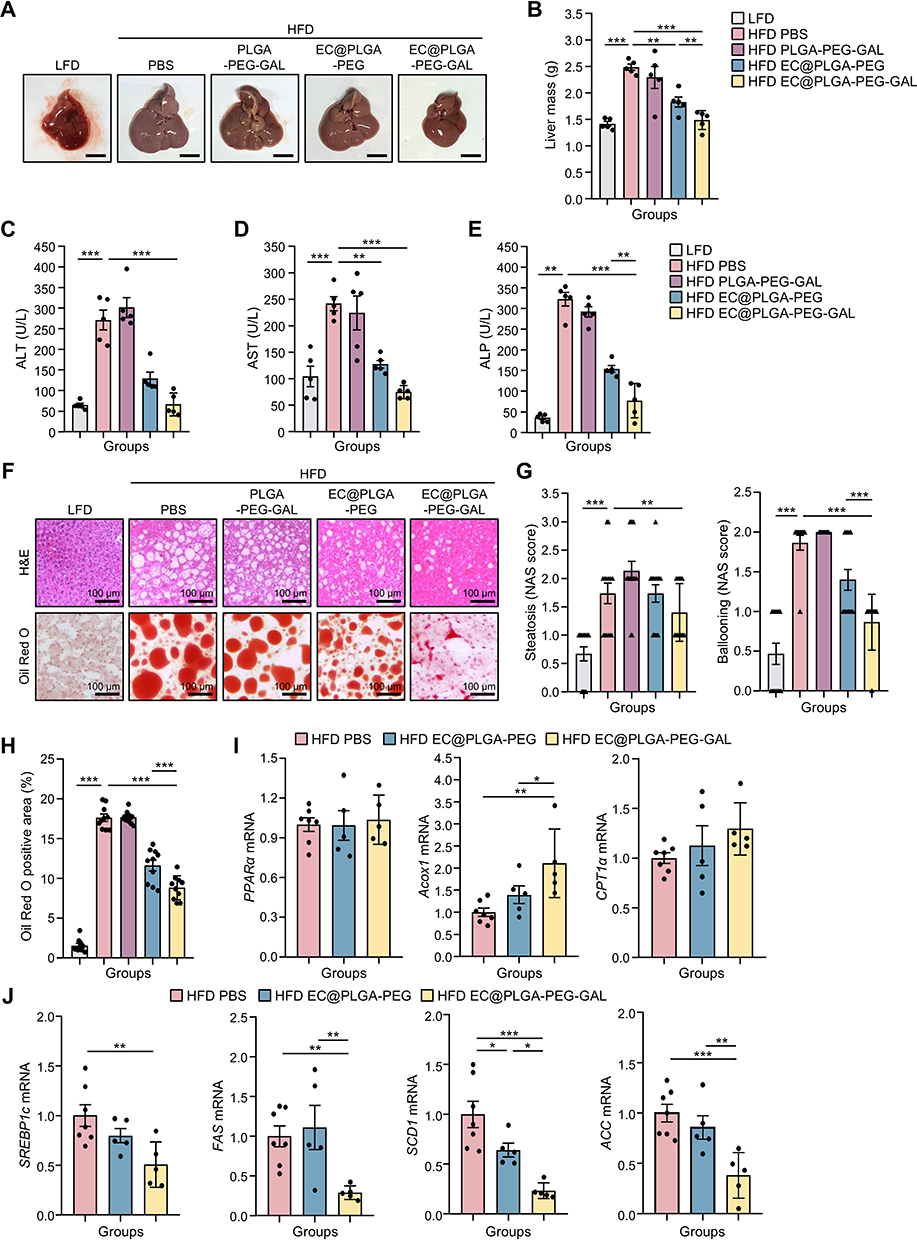 |
Figure 6 EC@PLGA-PEG-GAL NPs ameliorate HFD-induced hepatic steatosis. (A–J) Eighteen-week-old HFD-fed mice were treated with PBS, PLGA-PEG-GAL NPs, EC@PLGA-PEG NPs, and EC@PLGA-PEG-GAL NPs for three weeks. Same-age low-fat diet (LFD)-fed mice were used as negative controls. (A) Representative images of the liver tissues and (B) total liver mass of mice in each group. Scale bar, 1 cm. Serum (C) alanine aminotransferase (ALT), (D) aspartate aminotransferase (AST), and (E) alkaline phosphatase (ALP) levels. (F) H&E and oil red O staining of the liver sections of mice in each group. Scale bar, 100 μm. (G) Histological metabolic-associated fatty liver disease (MAFLD) activity score (MAS). (H) Quantified oil red O-stained area. (I and J) Relative mRNA levels of the genes involved in hepatic lipid metabolism, including fatty acid oxidation (I) and lipogenesis (J), in the livers of mice in each group. Data are represented as the mean ± SE. *p < 0.05, **p < 0.01, and ***p < 0.001. |
EC@PLGA-PEG-GAL NPs Enhance the Autophagic Clearance of Ubiquitinated Proteins
To investigate the mechanisms underlying the hepatoprotective effects of the EC@PLGA-PEG-GAL NPs, we examined their effects on autophagy, a cellular process impaired in MASLD. Immunoblotting analysis of the detergent-soluble and -insoluble fractions of PA-treated HepG2 cells revealed significantly decreased ubiquitin and p62 levels in the detergent-insoluble fraction (Figure 7A), indicating enhanced clearance of protein aggregates. Immunofluorescence staining for ubiquitin and p62 in HepG2 cells revealed protein aggregate accumulation upon PA treatment, which was significantly reduced by the EC@PLGA-PEG-GAL NPs (Figure 7B). Similar results were observed in vivo, where immunoblotting analysis of the liver tissue lysates of HFD-fed mice treated with EC@PLGA-PEG-GAL NPs showed markedly reduced levels of detergent-insoluble p62 and ubiquitinated proteins compared to those in PBS group (Figure 7C). Fusion of autophagosomes and lysosomes is crucial for autophagy in liver cells; however, PA inhibits this process, thereby suppressing the autophagic flux.24,26 To confirm that the enhanced clearance of protein aggregates was due to increased autophagic flux, we determined the LC3-II levels in HepG2 cells treated with the lysosomal inhibitor, bafilomycin A1. In PA-treated cells, LC3-II levels remained unchanged following bafilomycin A1 treatment; however, EC@PLGA-PEG-GAL NPs markedly elevated LC3-II when bafilomycin A1 was applied (Figure 7D). These findings suggest that EC@PLGA-PEG-GAL NPs promote the autophagic flux. Consistent with enhanced autophagic clearance, boron-dipyrromethene staining revealed that the EC@PLGA-PEG-GAL NPs significantly reduced the lipid accumulation in PA-treated HepG2 cells (Figure 7E), suggesting that improved autophagy contributes to the amelioration of hepatic steatosis.
 |
Figure 7 EC@PLGA-PEG-GAL NPs improve the autophagic clearance of ubiquitinated proteins in the livers of HFD mice. (A) Immunoblots of ubiquitin and p62 in the Triton X-100-soluble and -insoluble fractions of HepG2 cells treated with 500 μM palmitic acid (PA) and bovine serum albumin (BSA; vehicle) for 12 h in the presence or absence of the release medium containing 319.286 μg/mL EC@PLGA-PEG-GAL NPs. Band intensities were quantified and normalized to the control levels. (B) Immunofluorescence staining for ubiquitin (green) and p62 (red) in HepG2 cells after the indicated treatment. Nuclei were stained with DAPI (blue). Scale bar, 10 μm. (C) Immunoblots of ubiquitin and p62 in the Triton X-100-soluble and -insoluble fractions of the liver tissue lysates. β-actin was used as a loading control. Band intensities were quantified and normalized to the control levels. (D) Immunoblots of LC3 in the lysates of HepG2 cells pretreated with 319.286 μg/mL EC@PLGA-PEG-GAL NPs for 1 h, followed by 500 μM PA treatment for 12 h with or without 100 nM bafilomycin A1 in the last 3 h. Band intensities were quantified and normalized to the control levels. (E) Boron-dipyrromethene (BODIPY) staining of HepG2 cells after the indicated treatment. Nuclei were stained with DAPI. Scale bar, 10 μm. Data are represented as the mean ± SE. *p < 0.05, **p < 0.01, and ***p < 0.001. |
EC@PLGA-PEG-GAL NPs Enhance the Autophagic Flux via the AMPK/mTOR Pathway
To investigate how EC@PLGA-PEG-GAL NPs promote autophagy at the molecular level, we examined the activation status of the AMPK/mTOR pathway, a key regulator of autophagy.27 Immunoblotting analysis revealed that the EC@PLGA-PEG-GAL NPs significantly increased the AMPK phosphorylation in PA-treated cells after 3 and 6 h of treatment (Figure 8A). This effect was also observed in vivo, where the liver tissue lysates of HFD-fed mice treated with EC@PLGA-PEG-GAL NPs exhibited higher phospho-AMPK levels than those of PBS-treated mice (Figure 8B). Consistent with AMPK activation, EC@PLGA-PEG-GAL NPs decreased the phosphorylation of p70S6K, a downstream target of mTOR, in both the PA-treated HepG2 cells (Figure 8C) and liver tissues of HFD-fed mice (Figure 8D), indicating the inhibition of mTOR signaling. Dose- and time-dependent studies of free EC confirmed that these effects were due to the active compound, with increasing concentrations and exposure times enhancing the AMPK phosphorylation and reducing the p70S6K phosphorylation (Figure S4 and S5). To confirm the causal relationship between AMPK activation and enhanced autophagy, HepG2 cells were pretreated with compound C, an AMPK inhibitor, before EC@PLGA-PEG-GAL NP treatment. Compound C reversed the EC@PLGA-PEG-GAL NP-induced reduction in p62 levels (Figure 8E). Furthermore, knockdown of TSC2, a negative regulator of mTOR, inhibited the ability of EC@PLGA-PEG-GAL NPs to reduce the p62 levels in PA-treated cells (Figure 8F). These findings suggest that EC@PLGA-PEG-GAL NPs enhance autophagy via the AMPK/TSC2/mTOR signaling axis.
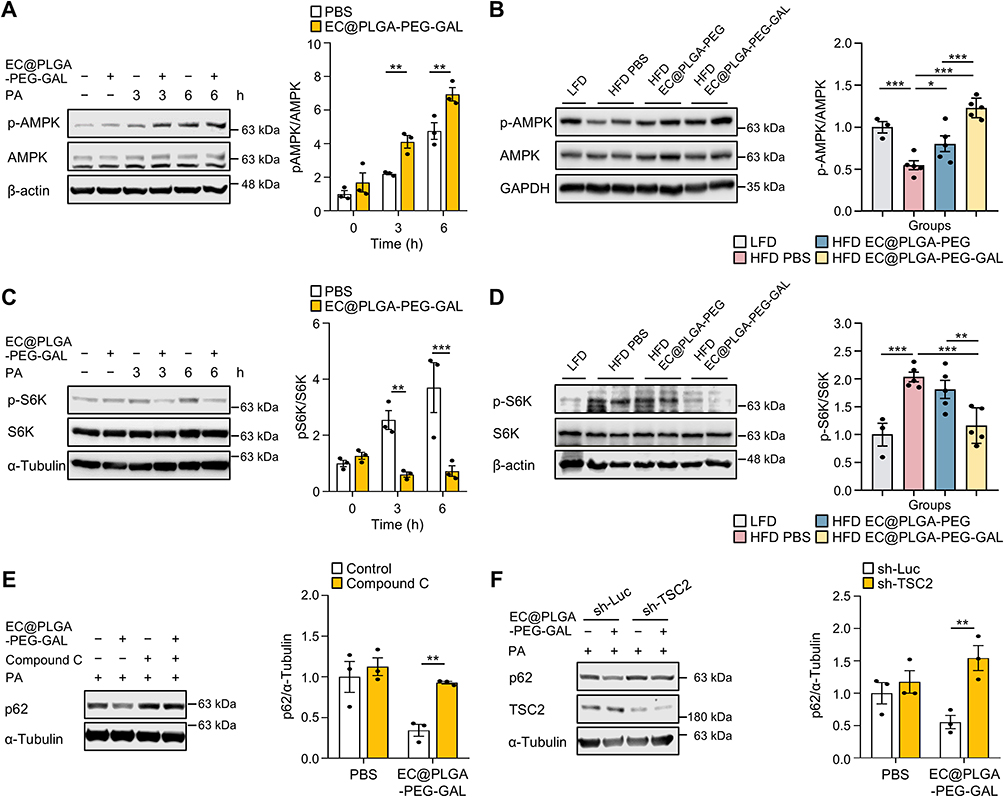 |
Figure 8 EC@PLGA-PEG-GAL NPs enhance the autophagic flux via the AMP-activated protein kinase (AMPK)/mechanistic target of rapamycin kinase (mTOR) pathway. (A) Immunoblots of phospho-AMPK and AMPK in the lysates of HepG2 cells pretreated with 319.286 μg/mL EC@PLGA-PEG-GAL NPs for 1 h, followed by 500 μM PA treatment for 3 and 6 h. (B) Immunoblots of phospho-AMPK and AMPK in the liver tissue lysates of LFD- and HFD-fed mice treated with PBS, EC@PLGA-PEG NPs, and EC@PLGA-PEG-GAL NPs. (C) Immunoblots of phospho-p70S6K and p70S6K in the lysates of HepG2 cells pretreated with 319.286 μg/mL EC@PLGA-PEG-GAL NPs for 1 h, followed by 500 μM PA treatment for 3 and 6 h. (D) Immunoblots of phospho-p70S6K and p70S6K in the liver tissue lysates of LFD- and HFD-fed mice treated with PBS, EC@PLGA-PEG NPs, and EC@PLGA-PEG-GAL NPs. (E) Immunoblots of p62 in the lysates of HepG2 cells pretreated with 20 μM compound C or 319.286 μg/mL EC@PLGA-PEG-GAL NPs for 1 h, followed by 500 μM PA treatment for 9 h. (F) Immunoblots of p62 and TSC2 in the lysates of lentiviral sh-Luc- or sh-TSC2-transfected HepG2 cells pretreated with 319.286 μg/mL EC@PLGA-PEG-GAL NPs for 1 h, followed by 500 μM PA treatment for 9 h. Band intensities were quantified and normalized to the control levels. Data are represented as the mean ± SE. *p < 0.05, **p < 0.01, and ***p < 0.001. |
EC@PLGA-PEG-GAL NPs Alleviate Mitochondrial Dysfunction
Considering the critical roles of mitochondrial dysfunction in MASLD pathogenesis, we investigated whether EC@PLGA-PEG-GAL NPs improve the mitochondrial functions using PA-treated HepG2 cells. MitoTracker Red staining revealed that PA induced mitochondrial fragmentation, which was significantly attenuated by the EC@PLGA-PEG-GAL NPs (Figure 9A and B). JC-1 staining showed that PA caused mitochondrial membrane depolarization, as evidenced by the decreased red/green fluorescence ratio (Figure 9C and D). However, EC@PLGA-PEG-GAL NPs significantly enhanced the mitochondrial membrane potential in PA-treated cells. MitoSOX staining revealed increased mitochondrial ROS production in PA-treated cells, which was significantly reduced by the EC@PLGA-PEG-GAL NPs (Figure 9E and F), indicating improved mitochondrial functions and reduced oxidative stress. At the molecular level, RT-qPCR analysis of the liver tissues of HFD-fed mice demonstrated that EC@PLGA-PEG-GAL NPs significantly upregulated the levels of genes involved in mitochondrial biogenesis (peroxisome proliferator-activated receptor-γ coactivator-1α, mitochondrial transcription factor A, nuclear respiratory factor 1, and peroxisome proliferator-activated receptor-γ) compared to PBS (Figure 9G). Furthermore, EC@PLGA-PEG-GAL NPs favorably modulated the levels of genes regulating the mitochondrial dynamics (mitofusin-2 and optic atrophy-1; Figure 9H). Collectively, these findings suggest that EC@PLGA-PEG-GAL NPs alleviate MASLD, partly by improving the mitochondrial homeostasis.
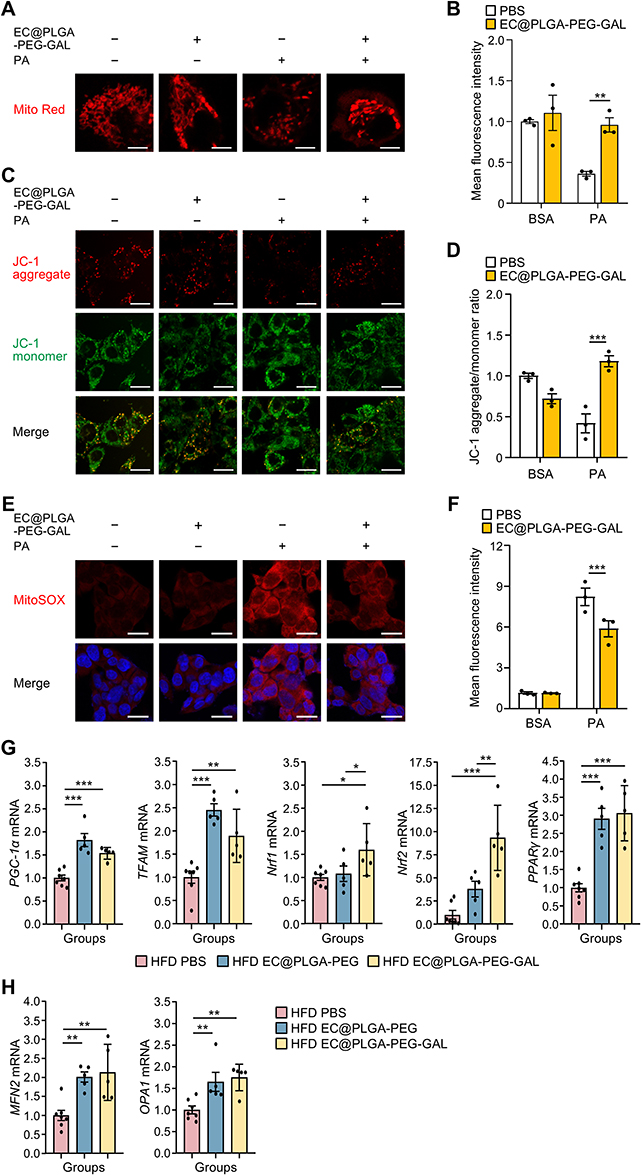 |
Figure 9 EC@PLGA-PEG-GAL NPs alleviate mitochondrial dysfunction in PA-treated HepG2 cells and livers of HFD-fed mice. (A) MitoTracker Red staining of HepG2 cells pretreated with 319.286 μg/mL EC@PLGA-PEG-GAL NPs for 1 h, followed by 500 μM PA treatment for 6 h. Scale bars, 5 μm. (B) Relative fluorescence intensity of MitoTracker Red. (C) 5,5′,6,6′-tetrachloro-1,1′,3,3′-tetraethylbenzimidazolcarbocyanine iodide (JC-1) staining of HepG2 cells pretreated with 319.286 μg/mL EC@PLGA-PEG-GAL NPs for 1 h, followed by 500 μM PA treatment for 6 h. Scale bars, 20 μm. (D) Relative fluorescence intensity of JC-1 (red/green fluorescence). (E) MitoSOX staining of HepG2 cells pretreated with 319.286 μg/mL EC@PLGA-PEG-GAL NPs for 1 h, followed by 500 μM PA treatment for 6 h. Scale bars, 20 μm. (F) Relative fluorescence intensity of MitoSOX. (G) Relative mRNA levels of mitochondrial biogenesis-related genes (peroxisome proliferator-activated receptor-γ coactivator-1α [PGC-1α], mitochondrial transcription factor A [TFAM], nuclear respiratory factor 1 [Nrf1]) in the liver tissue lysates of HFD-fed mice treated with PBS, EC@PLGA-PEG NPs, and EC@PLGA-PEG-GAL NPs. (H) Relative mRNA levels of mitochondrial dynamics-related genes in the liver tissue lysates of HFD-fed mice treated with PBS, EC@PLGA-PEG NPs, and EC@PLGA-PEG-GAL NPs. Data are represented as the mean ± SE. *p < 0.05, **p < 0.01, and ***p < 0.001. |
Discussion
The current study demonstrates that the developed EC@PLGA-PEG-GAL NPs effectively ameliorate the hepatic steatosis and metabolic dysfunction associated with MASLD by simultaneously addressing two central pathogenic processes: impaired autophagy and mitochondrial dysfunction. Our findings suggest that encapsulating EC with galactosylated NPs not only overcomes its inherent physicochemical limitations but also enhances its efficacy by targeting the primary site of disease pathology through a multi-mechanistic approach. Poor aqueous solubility and potential off-target toxicity are the key challenges limiting the use of hydrophobic therapeutic agents, such as EC.17 To address these issues, we successfully synthesized and characterized EC@PLGA-PEG-GAL NPs, confirming their improved aqueous solubility and sustained release of EC. EC@PLGA-PEG-GAL NPs exhibited excellent biocompatibility and significantly reduced cytotoxicity compared to free EC, as evidenced by in vitro assays using HepG2 cells. This improvement is crucial as the oral bioavailability of EC is only 0.39 due to poor absorption and extensive first-pass metabolism.17 Importantly, galactosylated NPs demonstrated enhanced uptake by hepatocytes and preferential accumulation in the liver tissues by targeting ASGPR. EC@PLGA-PEG-GAL NPs significantly improved the glucose tolerance, increased the insulin sensitivity, and ameliorated hepatic steatosis in HFD-fed mice.
Mechanistically, EC@PLGA-PEG-GAL NPs restored the autophagic flux, demonstrated by reduced p62 accumulation and clearance of ubiquitinated proteins. Autophagy is a fundamental quality-control mechanism that eliminates damaged organelles and lipid droplets; its impairment is strongly linked to MASLD progression.28 Previous reports have shown that defective autophagic flux exacerbates hepatic steatosis and inflammation by permitting buildup of toxic protein aggregates and lipid intermediates.29,30 By restoring autophagic activity through AMPK activation and mTOR suppression, our NPs corrected this pathogenic defect, aligning with prior findings that AMPK/mTOR modulation is central to liver metabolic homeostasis. In addition, EC@PLGA-PEG-GAL NPs restored the mitochondrial functions, improved the membrane potential, and reduced oxidative stress. These findings are important for many reasons, as listed below. First, they highlight ways to overcome the poor bioavailability of EC by leveraging nanocarrier technology to enhance EC delivery to liver tissues. Second, they suggest the use of galactose as an ASGPR ligand for the selective targeting of hepatocytes, with minimal off-target effects and systemic toxicity. Third, they suggest modulating autophagy and mitochondrial functions as part of a multifaceted approach to manage MASLD, which exhibits complex pathophysiology involving lipid metabolism dysregulation, chronic inflammation, and cellular stress responses.
The superior biocompatibility of EC@PLGA-PEG-GAL NPs compared to that of free EC offers a significant therapeutic advantage. Although free EC exhibited concentration-dependent cytotoxicity, our nanoformulation maintained high cell viability even at elevated concentrations. This improved safety profile was possibly due to the controlled release characteristics of PLGA-based systems and protective effects of nanoencapsulation.31,32 The sustained release profile observed over 72 h ensured prolonged therapeutic exposure, while minimizing peak concentration-related toxicity. Our nanoformulation galactosylation strategy successfully achieved liver-specific targeting via ASGPR-mediated endocytosis.33,34 The significantly enhanced cellular uptake of galactosylated NPs by HepG2 cells and preferential liver accumulation in vivo further validated the effectiveness of our targeting approach. ASGPR is exclusively expressed in hepatocytes and recognizes galactose residues, making it an ideal target for liver-specific drug delivery.35 Targeted drug delivery is particularly important for MASLD treatment, as it ensures maximum drug concentration at the site of pathology, while minimizing systemic exposure and potential off-target effects.19,36
Both EC@PLGA-PEG and EC@PLGA-PEG-GAL NPs exhibited an initial burst release of approximately 30% of EC within the first 24 h. This burst effect is commonly attributed to the rapid diffusion of drug molecules located near or adsorbed onto the NP surface during synthesis. In our system, the emulsion-diffusion method and the hydrophobic nature of EC may have facilitated partial localization of EC at or near the particle-water interface during NP formation. Consequently, these surface-associated EC molecules are more readily released into the dissolution medium upon rehydration, leading to the observed burst release. This effect is well-documented for PLGA-based nanocarriers.37,38 The subsequent sustained release phase likely results from gradual diffusion of EC encapsulated within the PLGA-PEG matrix.
This study demonstrated that the EC@PLGA-PEG-GAL NPs enhanced autophagy by activating the AMPK/mTOR signaling pathway. AMPK is a central regulator of cellular energy homeostasis and critical therapeutic target for MASLD.39 AMPK activation by EC@PLGA-PEG-GAL NPs led to mTOR inhibition, which subsequently promoted autophagy.27,40 In this study, the critical role of this pathway was confirmed via experiments, in which AMPK inhibition with compound C or mTOR regulator TSC2 knockdown abrogated the ability of the established NPs to clear the p62 aggregates. Our findings are consistent with previous reports highlighting the AMPK/mTOR pathway as a viable target for MASLD treatment.27,41 The enhanced clearance of ubiquitinated protein aggregates and p62 after EC@PLGA-PEG-GAL NP treatment indicates an improved autophagic flux.42,43 This is particularly significant in MASLD, where impaired autophagy contributes to the accumulation of damaged proteins and organelles, exacerbating hepatocyte dysfunction.26,44 p62 serves as a selective autophagy receptor targeting ubiquitinated substrates for autophagic degradation;45 its reduction indicates the enhanced cellular clearance of autophagic intermediates.
Mitochondrial dysfunction, which was alleviated by EC@PLGA-PEG-GAL NPs, is another critical aspect of MASLD pathogenesis. It is a central feature of MASLD progression, contributing to decreased energy production, increased oxidative stress, and hepatocyte injury.14,46 In this study, EC@PLGA-PEG-GAL NPs effectively restored the mitochondrial structure and ΔΨm and reduced mitochondrial ROS generation. Upregulation of mitochondrial biogenesis-related gene levels and favorable modulation of mitochondrial dynamics-related gene levels by EC@PLGA-PEG-GAL NPs comprehensively improved the mitochondrial functions.47 This restoration of mitochondrial homeostasis is essential to break the pathological cycle of oxidative stress and cellular dysfunction, which contribute to MASLD progression.
Our findings are consistent with and extend those of previous NP-based approaches for fatty liver disease, such as nifedipine-loaded NPs and supramolecular hydrogel patches, which primarily restore autophagy or reduce inflammation. Similar to these systems, our NPs corrected defective autophagic flux; however, the galactosylated PLGA-PEG formulation described here is unique in its hepatocyte-targeted uptake and combined effects on autophagy and mitochondrial homeostasis. Furthermore, unlike prior reports, we directly compared nanoparticle-encapsulated EC with free EC, demonstrating that free EC alone has little therapeutic benefit in vivo, whereas encapsulation is essential to realize its efficacy.
Although the present study demonstrates that hepatocyte-targeted EC-loaded PLGA–PEG–GAL NPs effectively restore autophagy and mitochondrial function in MASLD models, further investigations are warranted to facilitate clinical translation. Future studies will focus on optimizing formulation parameters to minimize the initial burst release and improve pharmacokinetic stability. Long-term safety, biodistribution, and efficacy studies in large animal models will be essential to establish clinical applicability. Evaluating the therapeutic performance of this nanoformulation in advanced stages of MASLD, including fibrosis or steatohepatitis, will help clarify its broader therapeutic relevance. Moreover, integrating this platform with combinatorial regimens involving other metabolic modulators may provide synergistic benefits. The galactosylated NP system also holds promise as a versatile carrier for the targeted delivery of other bioactive molecules to treat diverse hepatic diseases.
Conclusion
In conclusion, this study demonstrated the liver-targeted delivery of EC using galactosylated PLGA-PEG NPs as a highly promising strategy for MASLD treatment. Our nanoplatform successfully overcame the limitations of free EC, ensuring safe and targeted drug delivery to the liver. The main therapeutic benefit of our approach was the restoration of crucial cellular processes via promotion of the autophagic flux through the AMPK/mTOR pathway and alleviation of mitochondrial defects. These findings not only validate the potential of EC-based nanomedicine but also support the broader application of receptor-mediated hepatic targeting in metabolic liver diseases. Future studies should investigate the long-term safety, pharmacodynamics, and translational potential of this system in diverse models of metabolic dysfunction and steatohepatitis. Overall, our findings highlight the potential of EC@PLGA-PEG-GAL NPs as promising liver-targeted therapeutics for MASLD.
Data Sharing Statement
The data in this study are available upon request from the corresponding author.
Ethics Approval and Consent
All animal experiments were approved by the Institutional Animal Care and Use Committee of Konyang University (approval no. P-23-33-A-01) and conducted in accordance with the Guide for the Care and Use of Laboratory Animals (the National Research Council (US), 2011).
Acknowledgments
This manuscript has been edited for English language, grammar, punctuation, spelling, and overall style by professional native English-speaking editors at Editage. We thank Taeeun Emily Kim from Duke University for her insightful comments.
Funding
This study was supported by the National Research Foundation of Korea (NRF) funded by the Ministry of Education, Republic of Korea (NRF-2017R1A6A1A03015713) and Regional Innovation System & Education (RISE) program through the Daejeon RISE Center funded by the Ministry of Education and Daejeon Metropolitan City, Republic of Korea (2025-RISE-06-001).
Disclosure
The authors report no potential conflicts of interest in this article.
References
1. Grander C, Grabherr F, Tilg H. Non-alcoholic fatty liver disease: pathophysiological concepts and treatment options. Cardiovasc Res. 2023;119(9):1787–1798. doi:10.1093/cvr/cvad095
2. Eslam M, Sanyal AJ, George J, International Consensus P. MAFLD: a consensus-driven proposed nomenclature for metabolic associated fatty liver disease. Gastroenterology. 2020;158(7):1999–2014e1. doi:10.1053/j.gastro.2019.11.312
3. Gerges SH, Wahdan SA, Elsherbiny DA, El-Demerdash E. Non-alcoholic fatty liver disease: an overview of risk factors, pathophysiological mechanisms, diagnostic procedures, and therapeutic interventions. Life Sci. 2021;271:119220. doi:10.1016/j.lfs.2021.119220
4. Duvnjak M, Lerotic I, Barsic N, Tomasic V, Virovic Jukic L, Velagic V. Pathogenesis and management issues for non-alcoholic fatty liver disease. World J Gastroenterol. 2007;13(34):4539–4550. doi:10.3748/wjg.v13.i34.4539
5. Arab JP, Arrese M, Trauner M. Recent insights into the pathogenesis of nonalcoholic fatty liver disease. Annu Rev Pathol. 2018;13:321–350. doi:10.1146/annurev-pathol-020117-043617
6. Khambu B, Yan S, Huda N, Liu G, Yin XM. Autophagy in non-alcoholic fatty liver disease and alcoholic liver disease. Liver Res. 2018;2(3):112–119. doi:10.1016/j.livres.2018.09.004
7. Klionsky DJ, Emr SD. Autophagy as a regulated pathway of cellular degradation. Science. 2000;290(5497):1717–1721.
8. Park HW, Lee JH. Calcium channel blockers as potential therapeutics for obesity-associated autophagy defects and fatty liver pathologies. Autophagy. 2014;10(12):2385–2386. doi:10.4161/15548627.2014.984268
9. Yamamoto T, Takabatake Y, Takahashi A, et al. High-fat diet-induced lysosomal dysfunction and impaired autophagic flux contribute to lipotoxicity in the kidney. J Am Soc Nephrol. 2017;28(5):1534–1551. doi:10.1681/ASN.2016070731
10. Pankiv S, Clausen TH, Lamark T, et al. p62/SQSTM1 binds directly to Atg8/LC3 to facilitate degradation of ubiquitinated protein aggregates by autophagy. J Biol Chem. 2007;282(33):24131–24145. doi:10.1074/jbc.M702824200
11. Mizushima N, Klionsky DJ. Protein turnover via autophagy: implications for metabolism. Annu Rev Nutr. 2007;27:19–40. doi:10.1146/annurev.nutr.27.061406.093749
12. Zatloukal K, Stumptner C, Fuchsbichler A, et al. p62 Is a common component of cytoplasmic inclusions in protein aggregation diseases. Am J Pathol. 2002;160(1):255–263. doi:10.1016/S0002-9440(10)64369-6
13. Prasun P, Ginevic I, Oishi K. Mitochondrial dysfunction in nonalcoholic fatty liver disease and alcohol related liver disease. Transl Gastroenterol Hepatol. 2021;6:4. doi:10.21037/tgh-20-125
14. Zheng Y, Wang S, Wu J, Wang Y. Mitochondrial metabolic dysfunction and non-alcoholic fatty liver disease: new insights from pathogenic mechanisms to clinically targeted therapy. J Transl Med. 2023;21(1):510. doi:10.1186/s12967-023-04367-1
15. Ikeda I, Kobayashi M, Hamada T, et al. Heat-epimerized tea catechins rich in gallocatechin gallate and catechin gallate are more effective to inhibit cholesterol absorption than tea catechins rich in epigallocatechin gallate and epicatechin gallate. J Agric Food Chem. 2003;51(25):7303–7307. doi:10.1021/jf034728l
16. Connolly K, Batacan R Jr, Jackson D, Fenning AS. Effects of epicatechin on cardiovascular function in middle-aged diet-induced obese rat models of metabolic syndrome. Br J Nutr. 2024;131(4):593–605. doi:10.1017/S000711452300209X
17. Zhu M, Chen Y, Li RC. Oral absorption and bioavailability of tea catechins. Planta Med. 2000;66(5):444–447. doi:10.1055/s-2000-8599
18. Cheng H, Xu N, Zhao W, et al. (-)-Epicatechin regulates blood lipids and attenuates hepatic steatosis in rats fed high-fat diet. Mol Nutr Food Res. 2017;61(11). doi:10.1002/mnfr.201700303
19. Athanasopoulou F, Manolakakis M, Vernia S, Kamaly N. Nanodrug delivery systems for metabolic chronic liver diseases: advances and perspectives. Nanomedicine. 2023;18(1):67–84. doi:10.2217/nnm-2022-0261
20. Lee S, Han D, Kang HG, et al. Intravenous sustained-release nifedipine ameliorates nonalcoholic fatty liver disease by restoring autophagic clearance. Biomaterials. 2019;197:1–11. doi:10.1016/j.biomaterials.2019.01.008
21. Park JK, Utsumi T, Seo YE, et al. Cellular distribution of injected PLGA-nanoparticles in the liver. Nanomedicine. 2016;12(5):1365–1374. doi:10.1016/j.nano.2016.01.013
22. Thapa B, Kumar P, Zeng H, Narain R. Asialoglycoprotein receptor-mediated gene delivery to hepatocytes using galactosylated polymers. Biomacromolecules. 2015;16(9):3008–3020. doi:10.1021/acs.biomac.5b00906
23. Mistry NP, Desai JL, Thakkar HP. Formulation and evaluation of tacrolimus-loaded galactosylated Poly(lactic-co-glycolic acid) nanoparticles for liver targeting. J Pharm Pharmacol. 2015;67(10):1337–1348. doi:10.1111/jphp.12430
24. Kim DK, Han D, Bae J, et al. Verapamil-loaded supramolecular hydrogel patch attenuates metabolic dysfunction-associated fatty liver disease via restoration of autophagic clearance of aggregated proteins and inhibition of NLRP3. Biomater Res. 2023;27(1):4. doi:10.1186/s40824-023-00342-5
25. Han D, Kim H, Kim S, et al. Sestrin2 protects against cholestatic liver injury by inhibiting endoplasmic reticulum stress and NLRP3 inflammasome-mediated pyroptosis. Exp Mol Med. 2022. doi:10.1038/s12276-022-00737-9
26. Park HW, Park H, Semple IA, et al. Pharmacological correction of obesity-induced autophagy arrest using calcium channel blockers. Nature Communications. 2014;5:4834. doi:10.1038/ncomms5834
27. Han D, Kim D, Kim H, et al. Methylsulfonylmethane ameliorates metabolic-associated fatty liver disease by restoring autophagy flux via AMPK/mTOR/ULK1 signaling pathway. Front Pharmacol. 2023;14. 1302227. doi:10.3389/fphar.2023.1302227
28. Chen CL, Lin YC. Autophagy dysregulation in metabolic associated fatty liver disease: a new therapeutic target. Int J Mol Sci. 2022;23(17). doi:10.3390/ijms231710055
29. Ramos VM, Kowaltowski AJ, Kakimoto PA. Autophagy in hepatic steatosis: a structured review. Front Cell Dev Biol. 2021;9:657389. doi:10.3389/fcell.2021.657389
30. Gonzalez-Rodriguez A, Mayoral R, Agra N, et al. Impaired autophagic flux is associated with increased endoplasmic reticulum stress during the development of NAFLD. Cell Death Dis. 2014;5(4):e1179. doi:10.1038/cddis.2014.162
31. Yue Z, You Z, Yang Q, et al. Molecular structure matters: PEG-b-PLA nanoparticles with hydrophilicity and deformability demonstrate their advantages for high-performance delivery of anti-cancer drugs. J Mater Chem B. 2013;1(26):3239–3247. doi:10.1039/c3tb20406e
32. Hines DJ, Kaplan DL. Poly(lactic-co-glycolic) acid-controlled-release systems: experimental and modeling insights. Crit Rev Ther Drug Carrier Syst. 2013;30(3):257–276. doi:10.1615/critrevtherdrugcarriersyst.2013006475
33. Ramirez-Cortes F, Menova P. Hepatocyte targeting via the asialoglycoprotein receptor. RSC Med Chem. 2025;16(2):525–544. doi:10.1039/d4md00652f
34. D’Souza AA, Devarajan PV. Asialoglycoprotein receptor mediated hepatocyte targeting - strategies and applications. J Control Release. 2015;203:126–139. doi:10.1016/j.jconrel.2015.02.022
35. Biessen EA, Beuting DM, Roelen HC, van de Marel GA, van Boom JH, van Berkel TJ. Synthesis of cluster galactosides with high affinity for the hepatic asialoglycoprotein receptor. J Med Chem. 1995;38(9):1538–1546. doi:10.1021/jm00009a014
36. Sharma R, Porterfield JE, An HT, et al. Rationally designed galactose dendrimer for hepatocyte-specific targeting and intracellular drug delivery for the treatment of liver disorders. Biomacromolecules. 2021;22(8):3574–3589. doi:10.1021/acs.biomac.1c00649
37. Yoo J, Won YY. Phenomenology of the initial burst release of drugs from PLGA microparticles. ACS Biomater Sci Eng. 2020;6(11):6053–6062. doi:10.1021/acsbiomaterials.0c01228
38. Kesharwani P, Kumar V, Goh KW, et al. PEGylated PLGA nanoparticles: unlocking advanced strategies for cancer therapy. Mol Cancer. 2025;24(1):205. doi:10.1186/s12943-025-02410-x
39. Fang C, Pan J, Qu N, et al. The AMPK pathway in fatty liver disease. Front Physiol. 2022;13. 970292. doi:10.3389/fphys.2022.970292
40. Decuypere JP, Kindt D, Luyten T, et al. mTOR-controlled autophagy requires intracellular Ca(2+) signaling. PLoS One. 2013;8(4):e61020. doi:10.1371/journal.pone.0061020
41. Marcondes-de-Castro IA, Reis-Barbosa PH, Marinho TS, Aguila MB, Mandarim-de-Lacerda CA. AMPK/mTOR pathway significance in healthy liver and non-alcoholic fatty liver disease and its progression. J Gastroenterol Hepatol. 2023;38(11):1868–1876. doi:10.1111/jgh.16272
42. Liu WJ, Ye L, Huang WF, et al. p62 links the autophagy pathway and the ubiqutin-proteasome system upon ubiquitinated protein degradation. Cell Mol Biol Lett. 2016;21:29. doi:10.1186/s11658-016-0031-z
43. Cho CS, Park HW, Ho A, et al. Lipotoxicity induces hepatic protein inclusions through TANK binding kinase 1-mediated p62/sequestosome 1 phosphorylation. Hepatology. 2018;68(4):1331–1346. doi:10.1002/hep.29742
44. Zhang L, Yao Z, Ji G. Herbal extracts and natural products in alleviating non-alcoholic fatty liver disease via activating autophagy. Front Pharmacol. 2018;9:1459. doi:10.3389/fphar.2018.01459
45. Kim PK, Hailey DW, Mullen RT, Lippincott-Schwartz J. Ubiquitin signals autophagic degradation of cytosolic proteins and peroxisomes. Proc Natl Acad Sci U S A. 2008;105(52):20567–20574. doi:10.1073/pnas.0810611105
46. Grattagliano I, Montezinho LP, Oliveira PJ, et al. Targeting mitochondria to oppose the progression of nonalcoholic fatty liver disease. Biochem Pharmacol. 2019;160:34–45. doi:10.1016/j.bcp.2018.11.020
47. Deng Y, Dong Y, Zhang S, Feng Y. Targeting mitochondrial homeostasis in the treatment of non-alcoholic fatty liver disease: a review. Front Pharmacol. 2024;15:1463187. doi:10.3389/fphar.2024.1463187
 © 2025 The Author(s). This work is published and licensed by Dove Medical Press Limited. The
full terms of this license are available at https://www.dovepress.com/terms
and incorporate the Creative Commons Attribution
- Non Commercial (unported, 4.0) License.
By accessing the work you hereby accept the Terms. Non-commercial uses of the work are permitted
without any further permission from Dove Medical Press Limited, provided the work is properly
attributed. For permission for commercial use of this work, please see paragraphs 4.2 and 5 of our Terms.
© 2025 The Author(s). This work is published and licensed by Dove Medical Press Limited. The
full terms of this license are available at https://www.dovepress.com/terms
and incorporate the Creative Commons Attribution
- Non Commercial (unported, 4.0) License.
By accessing the work you hereby accept the Terms. Non-commercial uses of the work are permitted
without any further permission from Dove Medical Press Limited, provided the work is properly
attributed. For permission for commercial use of this work, please see paragraphs 4.2 and 5 of our Terms.