Back to Journals » Clinical Ophthalmology » Volume 8
Hemifield pattern electroretinogram in ocular hypertension: comparison with frequency doubling technology and optical coherence tomography to detect early optic neuropathy
Authors Finzi A, Strobbe E, Tassi F, Fresina M ![]() , Cellini M
, Cellini M
Received 4 May 2014
Accepted for publication 19 June 2014
Published 22 September 2014 Volume 2014:8 Pages 1929—1936
DOI https://doi.org/10.2147/OPTH.S67193
Checked for plagiarism Yes
Review by Single anonymous peer review
Peer reviewer comments 3
Alessandro Finzi, Ernesto Strobbe, Filippo Tassi, Michela Fresina, Mauro Cellini
Department of Specialized, Diagnostic and Experimental Medicine, Ophthalmology Service, University of Bologna, Bologna, Italy
Background: To assess the sensitivity and specificity of hemifield pattern electroretinogram (HF-PERG) for detecting early retinal ganglion cell (RGC) damage in ocular hypertensive (OH) patients.
Methods: Fifty-two OH patients (mean age 56±9.6 years) with an intraocular pressure (IOP) >21 mmHg were assessed. All subjects underwent HF-PERG, optical coherence tomography (OCT), and frequency doubling technology (FDT) visual field.
Results: OH patients showed a significant increase of peak-time of the N95 (P=0.027) compared to controls. The amplitude of the N95 of the lower and upper HF-PERG showed significant differences (P=0.037 and P=0.023, respectively) between the two groups. A significant intraocular (P=0.006) and interocular (P=0.018) asymmetry of N95 amplitude was found. Receiver operating characteristic (ROC) curve analysis revealed a sensitivity of 93% for the N95 of the lower HF-PERG, whereas full-field pattern electroretinogram (PERG) N95 peak-time had a sensitivity of 88%. In OH patients, we found a thinning of OCT - retinal nerve fiber layer (RNFL), especially in the superior and inferior quadrant, although not statistically significant, and a significantly higher FDT pattern standard deviation (FDT-PSD; P=0.001). In the OCT-RNFL inferior quadrant, a sensitivity of 82% was recorded. Finally, the sensitivity of the FDT-PSD was 92%.
Conclusion: Our study shows that HF-PERG is a very sensitive test for detecting early damage of the RGC.
Keywords: ocular hypertension, hemifield pattern electroretinogram, optical coherence tomography, frequency doubling technology
Introduction
Glaucoma is a chronic optic neuropathy characterized by progressive functional loss and death of retinal ganglion cells (RGCs), visual field (VF) defects, and the appearance of optic nerve head abnormalities.1
Although standard achromatic perimetry (SAP) is still the most used method to monitor VF damage in glaucoma patients, it is well accepted that there are limitations in the early detection of the disease. Indeed, SAP does not detect VF defects until approximately 30% of RGCs have been lost,2,3 because their receptive fields are considerably redundant in the coverage of a given location in the retina4 and may be stimulated in toto by a nonselective stimulus, as it happens for the white-on-white stimulus.5 Furthermore, changes in the appearance of the peripapillary retinal nerve fiber layer (RNFL) may often precede optic disc damage and SAP VF loss.6,7
For all these reasons, newer and more sensitive diagnostic techniques to assess the RNFL and visual function have been introduced in an attempt to evaluate glaucomatous damage at an earlier stage of the disease and to monitor patients with suspected glaucoma.
Pattern electroretinograms (PERGs) work by recording the electrical response of the RGC network.8,9 Hemifield (HF) PERGs measure the electrical response in the upper and lower fields and may play a key diagnostic role by considering that VF defects in glaucoma usually occur first in the upper half of the field than the lower.
Optical coherence tomography (OCT) provides accurate quantitative analysis and reproducible measurements of RNFL thickness.10 Frequency doubling technology (FDT) perimetry may target selective RGCs, specifically the M cells of the magnocellular pathway,11 which represents 3%–5% of the entire RGC population and might be selectively damaged in early glaucoma.12
The purpose of this study was to compare the sensitivity and specificity abilities of HF-PERG, FDT, and OCT-RNFL in a population of ocular hypertensive (OH) patients for detecting early glaucomatous damage.
Materials and methods
Fifty-two patients with ocular hypertension prospectively recruited as longitudinal study participants at the Glaucoma Unit of the S Orsola-Malpighi Hospital of Bologna, Italy, from September 2012 to April 2013 were included.
Participants were enrolled if they had no family history of glaucoma, a minimum best corrected visual acuity of 0.1 logarithm of the minimum angle of resolution (LogMAR), open anterior angles, clear ocular media, untreated intraocular pressure (IOP) of more than 21 mmHg on at least three occasions with the Goldmann applanation tonometer in both eyes, normal optic nerve head with no signs of diffuse thinning or focal narrowing or notching of the neuroretinal rim, hemorrhage, cupping or visible alterations of the RNFL, and mean defect (MD) and pattern standard deviation (PSD) perimetric indices of less than 1.5 dB.
Patients were excluded if they had history of ocular surgery or trauma, secondary causes of elevated IOP (exfoliation syndrome, pigment dispersion, corticosteroid use, iridocyclitis), intraocular eye diseases, or if they were on systemic medications known to affect IOP or if they wore contact lenses.
All patients underwent full ophthalmologic assessment, including best corrected visual acuity, Goldmann applanation tonometry, gonioscopy, corneal radius curvature measurement with automated keratometry (RK; Canon Inc., Tokyo, Japan), corneal thickness evaluation with a Tomey SP3000 pachymeter (Tomey Corp., Nagoya, Japan), slit-lamp examination of the anterior segment, and dilated funduscopy of the optic nerve head and RNFL with a 78-D lens.
Participants were submitted to FDT, HF-PERG, and OCT-RNFL. All visual function tests were reliable (25% false positives, false negatives, fixation losses) and all RNFL images obtained were judged to be of acceptable quality by experienced operators.
The study was approved by the Local Ethical Committee of the University of Bologna and adhered to the tenets of the Declaration of Helsinki. Written informed consent was obtained from all participants.
Instrumentation
Pattern electroretinogram hemifield test
For PERG recording, we followed the International Society for Clinical Electrophysiology of Vision (ISCEV) standard guidelines13 and used the RetimaxPlus system (CSO Instruments, Florence, Italy).
The patient sat in a chair at a distance of 114 cm from the television screen and fixed binocularly on a 6 mm spot at the center of the screen. The generated potential was measured with HK-LOOP ocular electrodes. The ground electrode was placed on the right ear lobe, and the interelectrode resistance was less than 3 kOhm. The monitor screen subtended a visual angle of 28.36°. The refraction of all subjects was corrected for the viewing distance. PERG stimulus was first presented as a full-screen black-and-white checkerboard pattern (contrast: 99%; spatial frequency: 49.2 minutes; temporal frequency: 2 Hz) and then only on the upper and lower part of the screen (contrast: 99%; spatial frequency: 46.3 minutes; temporal frequency: 2 Hz) in order to obtain three transient PERGs relative to the full, lower, and upper fields. The amplitude and peak time of P50 and N95 were measured according to the guidelines of ISCEV.13,14
Optical coherence tomography
The exam was performed using a spectral domain (SD) OCT (Heidelberg Spectralis OCT; Heidelberg Engineering GmbH, Heidelberg, Germany).
For the RNFL assessment, the device allows 1,024 A-scan points from a 3.45 mm circle that is centered manually on the optic nerve head by a well-trained examiner and provides an acquisition rate of 40,000 A-scans per second at an axial resolution of 3.9 μm. The included software algorithm delineates the anterior and posterior margins of the RNFL.
The resulting parapapillary RNFL thickness was evaluated as average thickness and specifically in the temporal quadrant, temporal superior quadrant, nasal superior quadrant, nasal quadrant, nasal inferior quadrant, and temporal inferior quadrant.
Only images of high quality, with proper centering of the optic disc in the the OCT scan circle and accurate segmentation were selected for analysis.
Frequency doubling technology perimetry
FDT was performed using the FDT VF Instrument (Welch Allyn, Skaneateles Falls, NY, USA and Carl Zeiss, Meditec Inc., Dublin, CA, USA). A full-threshold C-30 program was used for each patient.
This test is based on the phenomenon of the frequency-doubling illusion.15–17
The device randomly presents target stimuli that consist of individual 10° squares, with 0.25 cycles per degree monochrome sine-wave sinusoidal pattern of vertical gray stripes that are temporally modulated at 25 Hz.
Contrast between the lighter and darker phases of the vertical stripes in each stimulus pattern is attenuated automatically by using a modified binary staircase procedure to detect thresholds for sensitivity across the VF.
For each stimulus, which is presented for a maximum duration of 720 milliseconds, observers respond by pressing a button when the stimulus is detected.
During the first 160 milliseconds, the stimulus contrast is gradually increased from 0 to that selected for the presentation. If it is not immediately observed, the stimulus remains at this selected contrast for 400 milliseconds and is then gradually decreased to 0 during the final 160 milliseconds. The interstimulus interval varies randomly up to 500 milliseconds and the target location is randomly selected for each presentation.
Targets are presented in one of 17 test areas located within the central 20° radius of the VF (threshold program C-20). With a shift in fixation point location, the range can be extended to 30° in the nasal step area (threshold program N-30).
None of the study subjects had previous experience with FDT. For this reason, it was performed three times within 28 days, and the results of the last examination were used for statistical analysis.
Statistical analysis
All data were expressed as the mean ± standard deviation. The statistical analysis was performed using the MedCalc statistical program (v10.9.1; MedCalc Software, Ostend, Belgium). The Wilcoxon nonparametric test and Spearman’s correlation test were used, taking P<0.05 as statistically significant. Furthermore, receiver operating characteristic (ROC) curve analysis was performed to determine the diagnostic sensitivities and specificities of HF-PERG, OCT-RNFL, and FDT. Finally, a comparison between the ROC areas of the most sensitive indices for each examination was obtained by calculating the p-ROC value.
Results
A total of 104 eyes of 52 OH patients (male:female [M:F] =24:28, mean age 56±9.6 years) were examined and compared to 104 control eyes of 52 healthy subjects (M:F =27:25, mean age 54.8±10.4 years) with no eye or systemic disorders, IOP <21 mmHg, normal optic nerve head appearance, and VF indices <1.5 dB.
No significant differences in ocular characteristics between the two groups were found, with the exception of IOP (P<0.001; Table 1).
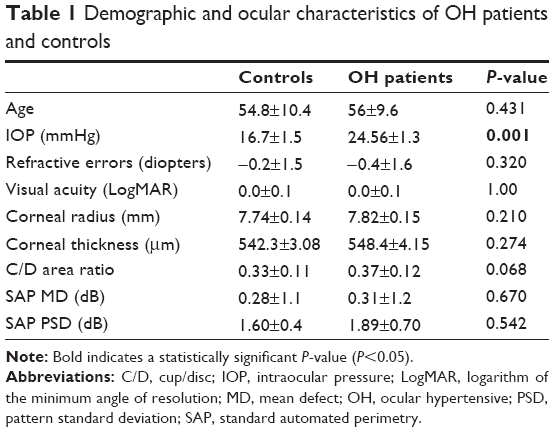 | Table 1 Demographic and ocular characteristics of OH patients and controls |
By assessing full-field PERG, we found that OH subjects had reduced amplitude of the P50-N95, but this data was not statistically significant (P=0.097), although the latency of N95 significantly increased (P=0.027). By evaluating the HF-PERG, a statistically significant difference between OH patients and controls as regards to the amplitudes of both the lower and upper field N95 was found (P=0.037 and P=0.023, respectively; Table 2). We also found statistically significant intraocular (−1.766±0.828 vs −0.675±0.405 μV; P=0.006) and interocular (−1.199±0.678 vs −0.408±0.281 μV; P=0.018) asymmetry of the N95 wave in 18% of OH patients when compared to healthy controls. After OCT and FDT measurements, OH patients showed RNFL thinning in the inferior (P=0.204) and superior (P=0.526) quadrants and higher FDT-PSD (P=0.001) compared to controls (Table 3). The Spearman’s correlation analysis showed a correlation between the amplitude of N95 lower with RNFL inferior (r=−0.675; P=0.001) and N95 upper with RNFL superior (r=−0.645; P=0.002).
 | Table 2 PERG recording in OH patients and controls |
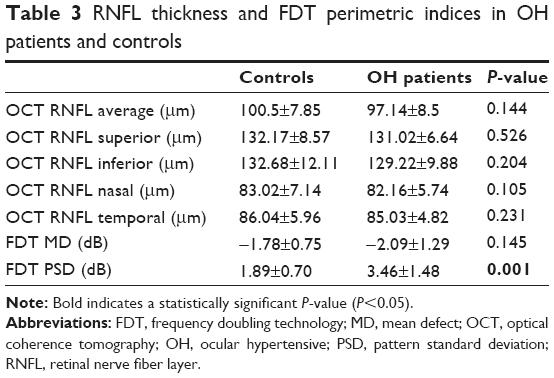 | Table 3 RNFL thickness and FDT perimetric indices in OH patients and controls |
ROC curve analysis revealed that full-field PERG amplitude of N95 had a sensitivity of 56%, whereas the latency of N95 was 83%. When we perform HF-PERG, we found a sensitivity of 93% in the lower field and 88% in the upper. FDT-PSD had a sensitivity of 92% and the OCT-RNFL of the inferior quadrant had a sensitivity of 82% (Table 4). The comparison between the ROC areas of the most sensitive indices for each examination is presented in detail in Table 5.
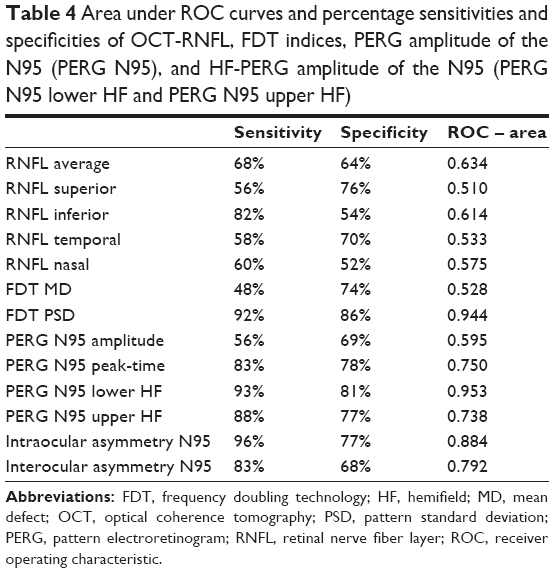 | Table 4 Area under ROC curves and percentage sensitivities and specificities of OCT-RNFL, FDT indices, PERG amplitude of the N95 (PERG N95), and HF-PERG amplitude of the N95 (PERG N95 lower HF and PERG N95 upper HF) |
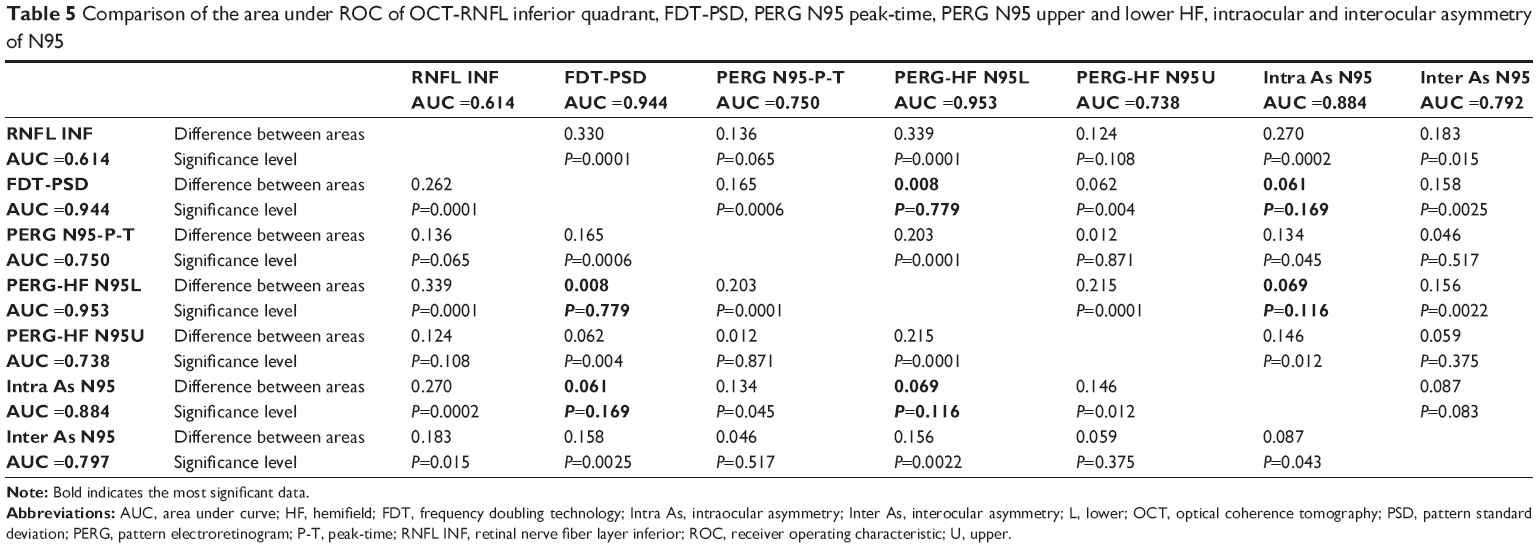 | Table 5 Comparison of the area under ROC of OCT-RNFL inferior quadrant, FDT-PSD, PERG N95 peak-time, PERG N95 upper and lower HF, intraocular and interocular asymmetry of N95 |
Discussion
Glaucoma is the second most common cause of blindness worldwide18 and it is well-established that early diagnosis is important to treat it promptly in order to avoid or slow the progression of the disease. As such, the objective detection of glaucoma at its earliest stages remains the major target for clinicians and researchers. Indeed, each exam, which may nowadays be used for this purpose, presents some limitations, and are not able to diagnose early glaucoma accurately in 100% of cases. For this reason, the search for more accurate objective techniques continues even as knowledge of the pathogenetic mechanisms of the disease improves.
The purpose of this study was to examine the sensitivity and specificity abilities of three tests (HF-PERG, OCT-RNFL, and FDT), which are more sensitive than SAP in the early detection of glaucomatous damage in eyes of OH patients.
In our study, in regards to OCT-RNFL, we did not find a statistically significant reduction in thickness in the inferior quadrant of the optic disc in OH patients when compared to controls (P=0.204), with a sensitivity of 82% and a specificity of 54%. Several studies have suggested that optic nerve and RFNL impairment may generally be identified before SAP alterations.7,19,20 OCT morphology results are well related to histopathological findings;21 indeed, the finding of the RNFL thinning that was observed in our patients, although not statistically significant, confirms those of previous studies.22,23
The asymmetry of OCT-RNFL sensitivity between the upper and lower sector could confirm the hypothesis that onset of early RNFL damage in the lower sector recognizes not only a metabolic suffering of RGC, but also simultaneous ischemic damage to the fibers due to increased resistance in the posterior ciliary arteries.24–27
FDT is a highly sensitive test that assesses the functionality of a subgroup of magnocellular ganglion cells that are selectively impaired in glaucoma patients as demonstrated by histopathological experimental studies28,29 as they are relatively more vulnerable to early damage.30
Therefore, an alteration of FDT indices may be indicative of early glaucomatous damage much earlier than SAP does. Indeed, FDT showed a significant increase in the PSD index in our OH subjects, with a sensitivity of 92% and a specificity of 86%.
PERG is an electrical response thought to be derived from RGCs when a temporally modulated patterned stimulus is viewed.13 The recording may be divided into two components, P50 (a prominent positive peak at 50 milliseconds) and N95 (a slow, broad trough at approximately 95 milliseconds).31–33
In glaucoma or high-risk ocular hypertension, PERG is reduced in most cases.11,34–43 This suggests that PERG may reflect damage to the RGCs before reliable SAP damage can be observed. Furthermore, in patients with ocular hypertension and normal SAP, a reduction of the PERG amplitude has been found, and several groups have shown that a pathologic PERG may predict impairment of the VF in those patients.44–49
Graham et al50 studied the upper:lower HF-PERG ratio in normal and glaucoma patients and found that the ratio was abnormal in most of the glaucoma patients, with less variability between patients than PERG amplitude. Thus, it could be useful for investigating and following up glaucoma patients since it reflects VF loss. In our study, we found an intraocular asymmetry of N95 amplitude in 18% of OH patients, and this suggests, that not only in patients with glaucoma, but also in OH patients, an abnormal ratio between the upper and lower HF may be seen. Obviously, it remains to be established whether the OH subjects who show abnormal electrophysiological responses are more predisposed to developing pathological optic glaucomatous neuropathy in the long term. In another study, Horn et al51 tested the scanning laser ophthalmoscope as a stimulator for evoking quadrant PERGs in normal and glaucoma eyes. They found that PERG amplitudes of the temporal lower retinal area seem to be more sensitive to glaucoma defects than those of the other quadrants, but this method did not reveal advantages compared to conventional stimulation. In our study, we performed a different method of stimulation to record PERG in OH patients, but our results confirm an initial abnormality in the lower HF. Falsini et al52 evaluated the relationship between PERG amplitude by using the steady-state protocol and the RNFL thickness in OH and early glaucoma patients. Their findings showed a weak or absent correlation between PERG and RNFL in OH patients, with the presence of significant reduction of PERG amplitude with minimal or no decrease in RNFL thickness. These findings suggest that RGC dysfunction is present even when an anatomical loss is minimal. As regards to full-field transient PERG, a nonsignificant reduction in amplitude of N95 was found in OH eyes when compared to controls (7.16±2.99 vs 9.29±1.18 μV; P=0.097) and these data had a sensitivity of 56% and a specificity of 69%. This finding is not in agreement with previous studies; indeed, other authors found a reduction of the N95 amplitude in suspected glaucoma patients.49,52–54
This discrepancy is probably due to the use of the steady-state technique. Steady-state PERG only records the activity of the RGC ON-spiking pathway;55 thus, the reduction of the N95 amplitude as reported in glaucoma and suspected glaucoma patients, may depend on the high temporal frequency of stimuli that causes metabolic stress to the RGC, with consequent reduction of N95 amplitude.56,57 On the other hand, we observed a significant increase in N95 latency, which is the first sign of RGC, metabolic suffering, as detectable by the PERG-transient full-field technique, in accordance with Jafarzadehpour et al.58
By using transient HF-PERG, we showed a statistically significant reduction of the N95 amplitude of both the lower and upper fields in OH patients as compared to controls (3.25±1.31 vs 4.43±1.0 μV; P=0.037 and 4.04±1.22 vs 4.61±0.82 μV; P=0.023, respectively).
The percentages of sensitivity and specificity of lower and upper HF-PERG N95 were respectively 93% and 81% in the lower field, and 88% and 77% in the upper field, and were very similar to those of FDT-PSD.
Moreover, we found a statistically significant correlation between lower and upper HF-PERG with the corresponding RNFL thickness sectors. This finding confirms that the functional alteration of RGC is established before the anatomical damage.59
The main characteristic of the early damage caused by glaucoma is its asymmetry with respect to the horizontal meridian. For this reason, several methods of investigation have been developed in order to assess the asymmetry of the upper and lower sectors of the nerve fiber layer,60,61 of the neuroretinal rim,62,63 and macular thickness.64,65
Finally, we found not only an intraocular but also an interocular asymmetry of N95 amplitude in about 18% of OH patients.
This study has several limitations. First, we evaluated a small sample size to obtain the data. Secondly, the lack of a well-known gold standard exam for detecting early glaucomatous damage means that comparison of the different tests is difficult.
In conclusion, in our opinion, HF-PERG may be a useful exam for detecting early glaucomatous damage as it provides additional information on the asymmetry of RGC activity through comparison of the upper and lower fields. However, a long-term follow-up study is required to better clarify the relationship between HF-PERG testing and pathological change of glaucomatous optic neuropathy in its very early stages.
Thus, a test battery consisting of HF-PERG and FDT may enhance the detection of early glaucomatous damage in OH patients, and could be useful to identify those patients who need ocular therapy to reduce IOP and to avoid the onset of VF defects.
Disclosure
The authors report no conflicts of interest in this work.
References
American Academy of Ophthalmology Preferred Practice Patterns Committee Glaucoma Panel. Preferred Practice Patterns. Primary Open Angle Glaucoma Suspect. San Francisco, CA: American Academy of Ophthalmology; 2002. Available from: http://one.aao.org/preferred-practice-pattern/primary-openangle-glaucoma-suspect-ppp--october-20. Accessed August 18, 2014. | ||
Quigley HA, Addicks EM, Green WR. Optic nerve damage in human glaucoma. III: quantitative correlation of nerve fiber loss and visual field defect in glaucoma, ischemic neuropathy, papilledema, and toxic neuropathy. Arch Ophthalmol. 1982;100(1):135–146. | ||
Quigley HA, Dunkelberger GR, Green WR. Retinal ganglion cell atrophy correlated with automated perimetry in human eyes with glaucoma. Am J Ophthalmol. 1989;107(5):453–464. | ||
Lee BB. Receptive field structure in the primate retina. Vision Res. 1996;36(5):631–644. | ||
Johnson CA. Selective versus non-selective losses in glaucoma. J Glaucoma. 1994;3 Suupl 1:S32–S44. | ||
Mikelberg FS, Yidegiligne HM, Shulzer M. Optic nerve axon count and axon diameter in patients with ocular hypertension and normal visual fields. Ophthalmology. 1995;102(2):342–348. | ||
Quigley HA, Katz J, Derick RJ, Gilbert D, Sommer A. An evaluation of optic disk and nerve fiber layer examinations in monitoring progression of early glaucoma damage. Ophthalmology. 1992;99(1):19–28. | ||
Trick GL. Pattern electroretinogram: an electrophysiological technique applicable to primary open-angle glaucoma and ocular hypertension. J Glaucoma. 1992;1(4):271–279. | ||
Graham SL, Drance SM, Chauhan BC, et al. Comparison of psychophysical and electrophysiological testing in early glaucoma. Invest Ophthalmol Vis Sci. 1996;37(13):2651–2662. | ||
Sommer A, Miller NR, Pollack I, Maumenee AE, George T. The nerve fiber layer in the diagnosis of glaucoma. Arch Ophthalmol. 1977;95(12): 2149–2156. | ||
Anderson AJ, Johnson CA. Mechanisms isolated by frequency-doubling technology perimetry. Invest Ophthalmol Vis Sci. 2002;43(2): 398–401. | ||
Glovinsky Y, Quigley HA, Dunkelberger GR. Retinal ganglion cell loss is size dependent in experimental glaucoma. Invest Ophthalmol Vis Sci. 1991;32(3):484–491. | ||
Bach M, Brigell MG, Hawlina M, et al. ISCEV standard for clinical pattern electroretinography (PERG): 2012 update. Doc Ophthalmol. 2013;126(1):1–7. | ||
Parisi V, Miglior S, Manni G, Centofanti M, Bucci GM. Clinical ability of pattern electroretinograms and visual evoked potentials in detecting visual dysfunction in ocular hypertension and glaucoma. Ophthalmology. 2006;113(2):216–228. | ||
Johnson CA, Samuels SJ. Screening for glaucomatous visual field loss with frequency-doubling perimetry. Invest Ophthalmol Vis Sci. 1997;38(2):413–425. | ||
Kelly DH. Frequency doubling in visual responses. J Opt Soc Am. 1966;56(11):1628–1632. | ||
Kelly DH. Nonlinear visual responses to flickering sinusoidal gratings. J Opt Soc Am. 1981;71(9):1051–1055. | ||
Quigley HA, Broman AT. The number of people with glaucoma worldwide in 2010 and 2020. Br J Ophthalmol. 2006;90(3):262–267. | ||
Zeyen TG, Caprioli J. Progression of disc and field damage in early glaucoma. Arch Ophthalmol. 1993;111(1):62–65. | ||
Nomoto H, Matsumoto C, Takada S, et al. Detectability of glaucomatous changes using SAP, FDT, flicker perimetry, and OCT. J Glaucoma. 2009;18(2):165–171. | ||
Hee MR, Izatt JA, Swanson EA, et al. Optical coherence tomography of the human retina. Arch Ophthalmol. 1995;113(3):325–332. | ||
Bowd C, Weinreb RN, Williams JM, Zangwill LM. The retinal nerve fiber layer thickness in ocular hypertensive, normal and glaucomatous eyes with optical coherence tomography. Arch Ophthalmol. 2000; 118(1):22–26. | ||
Dada T, Gadia R, Aggarwal A, Dave V, Gupta V, Sihota R. Retinal nerve fiber layer thickness measurement by scanning laser polarimetry (GDxVCC) at conventional and modified diameter scans in normals, glaucoma suspects, and early glaucoma patients. J Glaucoma. 2009; 18(6):448–452. | ||
Harris A, Ishii Y, Chung HS, et al. Blood flow per unit retinal nerve fibre tissue volume is lower in the human inferior retina. Br J Ophthalmol. 2003;87(2):184–188. | ||
Logan JF, Rankin SJ, Jackson AJ. Retinal blood flow measurements and neuroretinal rim damage in glaucoma. Br J Ophthalmol. 2004;88(8): 1049–1054. | ||
Cellini M, Bernabini B, Carbonelli M, Zamparini E, Campos EC. Optical coherence tomography, frequency doubling technology an colour Doppler imaging in ocular hypertension. Eye (London). 2007;21(8): 1071–1077. | ||
Hafez AS, Bizzarro RL, Lesk MR. Evaluation of optic nerve head and peripapillary retinal blood flow in glaucoma patients, ocular hypertensives, and normal subjects. Am J Ophthalmol. 2003;136(6): 1022–1031. | ||
Asai T, Katsumori N, Mizokami K. [Retinal ganglion cell damage in human glaucoma. 2. Studies on damage pattern]. Nippon Ganka Gakkai Zasshi. 1987;91(12):1204–1213. Japanese. | ||
Weber AJ, Chen H, Kaufman PL, Hubbard WC. Effects of elevated IOP on cell size, density and number in the primate lateral geniculate nucleus (LGN). Invest Ophthalmol Vis Sci. 1997;38(4 Suppl):159. | ||
Glovinsky Y, Quigley HA, Pease ME. Foveal ganglion cell loss is size dependent in experimental glaucoma. Invest Ophthalmol Vis Sci. 1993; 34(2):395–400. | ||
Hood DC, Xu L, Thienprasiddhi P, et al. The pattern electroretinogram in glaucoma patients with confirmed visual field deficits. Invest Ophthalmol Vis Sci. 2005;46(7):2411–2418. | ||
Holder GE. Significance of abnormal pattern electroretinography in anterior visual pathway dysfunction. Br J Ophthalmol. 1987;71(3): 166–171. | ||
Viswanathan S, Frishman LJ, Robson JG. The uniform field and pattern ERG in macaques with experimental glaucoma: removal of spiking activity. Invest Ophthalmol Vis Sci. 2000;41(9):2797–2810. | ||
Wanger P, Persson HE. Pattern-reversal electroretinograms in unilateral glaucoma. Invest Ophthalmol Vis Sci. 1983;24(6):749–753. | ||
Papst N, Bopp M, Schnaudigel OE. The pattern evoked electroretinogram associated with elevated intraocular pressure. Graefes Arch Clin Exp Ophthalmol. 1984;222(1):34–37. | ||
van Lith G, Ringens P, de Heer LJ. Pattern electroretinogram and glaucoma. Dev Ophthalmol. 1984;9:133–139. | ||
Weinstein GW, Arden GB, Hitchings RA, Ryan S, Calthorpe CM, Odom JV. The pattern electroretinogram (PERG) in ocular hypertension and glaucoma. Arch Ophthalmol. 1988;106(7):923–928. | ||
Price MJ, Drance SM, Price M, Schulzer M, Douglas GR, Tansley B. The pattern electroretinogram and visual-evoked potential in glaucoma. Graefes Arch Clin Exp Ophthalmol. 1988;226(6):542–547. | ||
Bach M, Hiss P, Röver J. Check-size specific changes of pattern electroretinogram in patients with early open-angle glaucoma. Doc Ophthalmol. 1988;69(3):315–322. | ||
Korth M, Horn F, Storck B, Jonas J. The pattern-evoked electroretinogram (PERG): age-related alterations and changes in glaucoma. Graefes Arch Clin Exp Ophthalmol. 1989;227(2):123–130. | ||
O’Donaghue E, Arden GB, O’Sullivan F, et al. The pattern electroretinogram in glaucoma and ocular hypertension. Br J Ophthalmol. 1992; 76(7):387–394. | ||
Bach M. Electrophysiological approaches for early detection of glaucoma. Eur J Ophthalmol. 2001;11 Suppl 2:41–49. | ||
Bach M, Unsoeld AS, Philippin H, et al. Pattern ERG as an early glaucoma indicator in ocular hypertension: a long-term, prospective study. Invest Ophthalmol Vis Sci. 2006;47(11):4881–4887. | ||
Pfeiffer N, Tillmon B, Bach M. Predictive value of the pattern electroretinogram in high-risk ocular hypertension. Invest Ophthalmol Vis Sci. 1993;34(5):1710–1715. | ||
Porciatti V, Falsini B, Brunori S, Colotto A, Moretti G. Pattern electroretinogram as a function of spatial frequency in ocular hypertension and early glaucoma. Doc Ophthalmol. 1987;65(3):349–355. | ||
Ambrosio G, Arienzo G, Aurilia P, Colasanti A, Fusco R. Pattern electroretinograms in ocular hypertension. Doc Ophthalmol. 1988;69(2): 161–165. | ||
Bach M, Speidel-Fiaux A. Pattern electroretinogram in glaucoma and ocular hypertension. Doc Ophthalmol. 1989;73(2):173–181. | ||
Parisi V, Manni G, Gandolfi SA, Centofanti M, Colacino G, Bucci MG. Visual function correlates with nerve fiber layer thickness in eyes affected by ocular hypertension. Invest Ophthalmol Vis Sci. 1999;40(8):1828–1833. | ||
Ventura LM, Porciatti V, Ishida K, Feuer WJ, Parrish RK 2nd. Pattern electroretinogram abnormality and glaucoma. Ophthalmology. 2005; 112(1):10–19. | ||
Graham SL, Wong VA, Drance SM, Mikelberg FS. Pattern electroretinograms from hemifields in normal subjects and patients with glaucoma. Invest Ophthalmol Vis Sci. 1994;35(9):3347–3356. | ||
Horn F, Mardin C, Korth M, Martus P. Quadrant pattern ERG with SLO stimulation in normals and glaucoma patients. Graefes Arch Clin Exp Ophthalmol. 1996;234 Suppl 1:S174–S179. | ||
Falsini B, Marangoni D, Salgarello T, et al. Structure-function relationship in ocular hypertension and glaucoma: interindividual and interocular analysis by OCT and pattern ERG. Graefes Arch Clin Exp Ophthalmol. 2008;246(8):1153–1162. | ||
Ventura LM, Sorokac N, De Los Santos R, Feuer WJ, Porciatti V. The relationship between retinal ganglion cell function and retinal nerve fiber thickness in early glaucoma. Invest Ophthalmol Vis Sci. 2006;47(9): 3904–3911. | ||
Ventura LM, Golubev I, Feuer WJ, Porciatti V. Pattern electroretinogram progression in glaucoma suspects. J Glaucoma. 2013;22(3):219–225. | ||
Luo X, Frishman LJ. Retinal pathway origins of the pattern electroretinogram (PERG). Invest Ophthalmol Vis Sci. 2011;52(12):8571–8584. | ||
Bach M, Hoffmann MB. Update on the pattern electroretinogram in glaucoma. Optom Vis Sci. 2008;85(6):386–395. | ||
Porciatti V, Sorokac N, Buchser W. Habituation of retinal ganglion cell activity in response to steady state pattern visual stimuli in normal subjects. Invest Ophthalmol Vis Sci. 2005;46(4):1296–1302. | ||
Jafarzadehpour E, Radinmehr F, Pakravan M, Mirzajani A, Yazdani S. Pattern electroretinography in glaucoma suspects and early primary open angle glaucoma. J Ophthalmic Vis Res. 2013;8(3):199–206. | ||
Tatham AJ, Weinreb RN, Zangwill LM, Liebmann JM, Girkin CA, Medeiros FA. Estimated retinal ganglion cell counts in glaucomatous eyes with localized retinal fiber layer defects. Am J Ophthalmol. 2013;156(3):578–587. | ||
Reis AS, Vidal KS, Kreuz AC, Monteiro ML, Nicolela MT, Malta RF. Nerve fiber layer in glaucomatous hemifield loss: a case-control study with time and spectral-domain optical coherence tomograohy. Arq Bras Oftalmol. 2012;75(1):53–58. | ||
Takagi ST, Kita Y, Takeyama A, Tomita G. Macular retinal ganglional cell complex thickness and its relationship to the optic nerve head topography in glaucomatous eyes with hemifield defects. J Ophthalmol. 2011;2011:914250. | ||
European Glaucoma Prevention Study (EGPS) Group; Miglior S, Pfeiffer N, Torri V, Zeyen T, Cunha-Vaz J, Adamson I. Predictive factors for open angle glaucoma among patients with ocular hypertension in the European Glaucoma Prevention Study. J Ophthalmol. 2007;114(1):3–9. | ||
Jonas JB, Budde WM, Panda-Jonas S. Ophthalmoscopic evaluation of the optic nerve head. Surv Ophthalmol. 1999;43(4):293–320. | ||
Salgarello T, Colotto A, Valente P, et al. Posterior pole retinal thickness in ocular hypertension and glaucoma: early changes detected by hemispheric asymmetries. J Glaucoma. 2005;14(5):375–383. | ||
Bagga H, Greenfield DS, Knighton RW. Macular symmetry testing for glaucoma detection. J Glaucoma. 2005;14(5):385–363. |
 © 2014 The Author(s). This work is published and licensed by Dove Medical Press Limited. The
full terms of this license are available at https://www.dovepress.com/terms
and incorporate the Creative Commons Attribution
- Non Commercial (unported, 3.0) License.
By accessing the work you hereby accept the Terms. Non-commercial uses of the work are permitted
without any further permission from Dove Medical Press Limited, provided the work is properly
attributed. For permission for commercial use of this work, please see paragraphs 4.2 and 5 of our Terms.
© 2014 The Author(s). This work is published and licensed by Dove Medical Press Limited. The
full terms of this license are available at https://www.dovepress.com/terms
and incorporate the Creative Commons Attribution
- Non Commercial (unported, 3.0) License.
By accessing the work you hereby accept the Terms. Non-commercial uses of the work are permitted
without any further permission from Dove Medical Press Limited, provided the work is properly
attributed. For permission for commercial use of this work, please see paragraphs 4.2 and 5 of our Terms.