Back to Journals » International Journal of Women's Health » Volume 10
Health perception in menopausal women
Authors Del Sueldo M ![]() , Martell-Claros N, Abad-Cardiel M, Zilberman JM, Marchegiani R
, Martell-Claros N, Abad-Cardiel M, Zilberman JM, Marchegiani R ![]() , Fernández-Pérez C
, Fernández-Pérez C
Received 11 May 2018
Accepted for publication 30 August 2018
Published 24 October 2018 Volume 2018:10 Pages 655—661
DOI https://doi.org/10.2147/IJWH.S173891
Checked for plagiarism Yes
Review by Single anonymous peer review
Peer reviewer comments 2
Editor who approved publication: Dr Everett Magann
Mildren Del Sueldo,1,2,* Nieves Martell-Claros,3–5,* María Abad-Cardiel,3–5 Judith M Zilberman,6–8 Raul Marchegiani,1,2 Cristina Fernández-Pérez9
1Healthy heart program, Municipalidad de Villa María, Córdoba, Argentina; 2Cardiology Division and Cardiovascular Prevention, Specialty Clinic, Villa María, Córdoba, Argentina; 3Hypertension Unit, Internal Medicine Service, Hospital Clínico San Carlos, Madrid, Spain; 4School of Medicine, Complutense University, Madrid, Spain; 5Research Institute of the San Carlos Clinical Hospital, Madrid, Spain; 6Physiology Course at the School of Pharmacy and Biochemistry, University of Buenos Aires, IQUIMEFA-CONICET, CABA, Argentina; 7Department of Cardiovascular Prevention, Hypertension Unit, Cardiovascular Institute, Buenos Aires (ICBA), CABA, Argentina; 8Cardiology Service, Hypertension Unit, Hospital General de Agudos Dr. Cosme Argerich, Buenos Aires, Argentina; 9Unit of Epidemiology and Clinical Methodology, Preventive Medicine Service, Research Institute of the San Carlos Clinical Hospital, UCM, Madrid, Spain
*These authors contributed equally to this work
Aim: The aim of this study is to find whether the worsening of health perception was related to the menopausal (MNP) state or to its negative consequences on cardiometabolic risk factors (CMRF) and the presence of depression/anxiety.
Methods: In this study, 2,562 women, 1,357 (53%) MNP and 1,205 (47%) non-MNP, were analyzed. Blood pressure, heart rate, body mass index, waist circumference, and depression/anxiety screening using the Hospital Depression/Anxiety Scale (HADS) were measured. We collected a blood sample in fasting state for glycemia, total cholesterol, high-density lipoprotein cholesterol, low-density lipoprotein cholesterol and triglycerides. Logistic regression models were fitted with a backward method from the potentially confusing variables of the menopause study groups.
Results: Age 49.4 (±15.9) years; 10.1% belonged to semi-rural population; 87.5% had children. Regarding the educational level, 22.1% had <5 years of education, 31.3% had between 6 and 7 years, 33.4% had between 8 and 12 years, and 13.2% had >12 years of education. The prevalence of CMRF was significantly higher in MNP women, except for smoking. We did not find any differences in the prevalence of depression or anxiety between MNP and non-MNP women. Health was perceived as worse among MNP women (P<0.05) and patients over 45 years of age than patients younger than 45 years. We found a relationship between the negative health perception with metabolic syndrome, depression, and anxiety, having children, smoking, residing in rural area, and low educational level; nevertheless, it is not correlative with MNP status.
Conclusion: Perceived health should be viewed as a multifaceted condition related to social circumstances, and various symptoms in women, including menopause symptoms, but not with MNP state itself.
Keywords: menopause, health perception, depression, anxiety, metabolic syndrome
Introduction
Cardiovascular diseases are the leading cause of death in the world. More than half (54%) of the 56.4 million deaths occurred in 2015 were due to ten causes. Ischemic heart disease and stroke were the biggest culprits, with up to 15 million deaths attributable to both of them in that year alone. Diabetes caused 1.6 million deaths. These diseases have been the main causes of global mortality for the past 15 years.1
To optimize the preventive measures of cardiovascular diseases, it is essential that people have an adequate perception of cardiovascular risk factors, given that they lack specific symptoms, although they may present mild generic symptoms, with a loss of well-being that the patient should be able to perceive.2–6
Perceived health status is one of the majorly used indicators when evaluating the real health of the population providing the first sight of the individual’s life satisfaction. It is one of the most consolidated and frequently asked indicators in health surveys. Although health perception measurement is subjective, there is a close relationship between health assessment and other consequences of such assessment acceptance. Generally, it has been shown that people who perceive their health as poor see their mortality increased due to cardiovascular diseases, cancer, and other diseases.2–6
The relationship between sex and health perception is close. Women tend to have a worse perception of their own health than men at all ages, especially when they are over 50 years of age. This could be related to the onset of menopause, which, in turn, leads to an increase in cardiovascular risk. However, it is a fact that women universally have a higher life expectancy than men.
The excess of minor physical morbidity reported among women compared with men has been widely confirmed in large representative community population samples in North America and Europe. However, men have poorer health in chronic conditions related to the leading causes of death.7 Hospitalization rates are higher in men over 50 years of age, and hospital stays are longer8 for men compared with women.
In the face of this controversy, this study tries to answer whether the worsening of health perception was related to the menopausal (MNP) state or to the negative consequences on cardiometabolic risk factors and/or depression/anxiety presence.
Subjects
In this study, women ≥21 years of age who participated in the “Healthy Heart” Cardiovascular Disease Prevention Program were included. This study was designed to identify the prevalence in the population of cardiovascular diseases and risk factors. Exclusion criteria were as follows: <21 years, pregnant, or disability and/or inability to sign the informed consent or complete the studies required by the protocol.
Sample calculation
The present study is an epidemiological, cross-sectional, exploratory, and a posteriori inferential one. The field work was carried out in the towns of Villa María (Córdoba) and Rancúl (La Pampa), Argentina.
The sample size was estimated considering a proportion of poor health perception of 50% (proportion in which the largest sample size is required), with an estimation error of 2% and an estimated loss ratio of 10%. The sample size needed was 2,415 women.
The sampling was multistage, stratified by sex and age, based on previous records of the population. The work was carried out in the Primary Health Care Centers of both locations.
A probabilistic sample of the population of the city was extracted, which means that the selection was done in such a way that every subject of the population (and, therefore, of every subject within each group of expected age) will have a nonzero probability and known in advance to be chosen. Specifically, a multistage stratified sampling was applied.
The sampling was multistage, considering the nominal population in charge of each Primary Health Care Center (PHC) of the mentioned municipalities (Villa María y Rancúl), with representation of all the strata of age contemplated in the design.
The final selected sample included 2,562 women, corresponding to 2,294 women in the city of Villa María and 268 in the town of Rancúl (Figure 1).
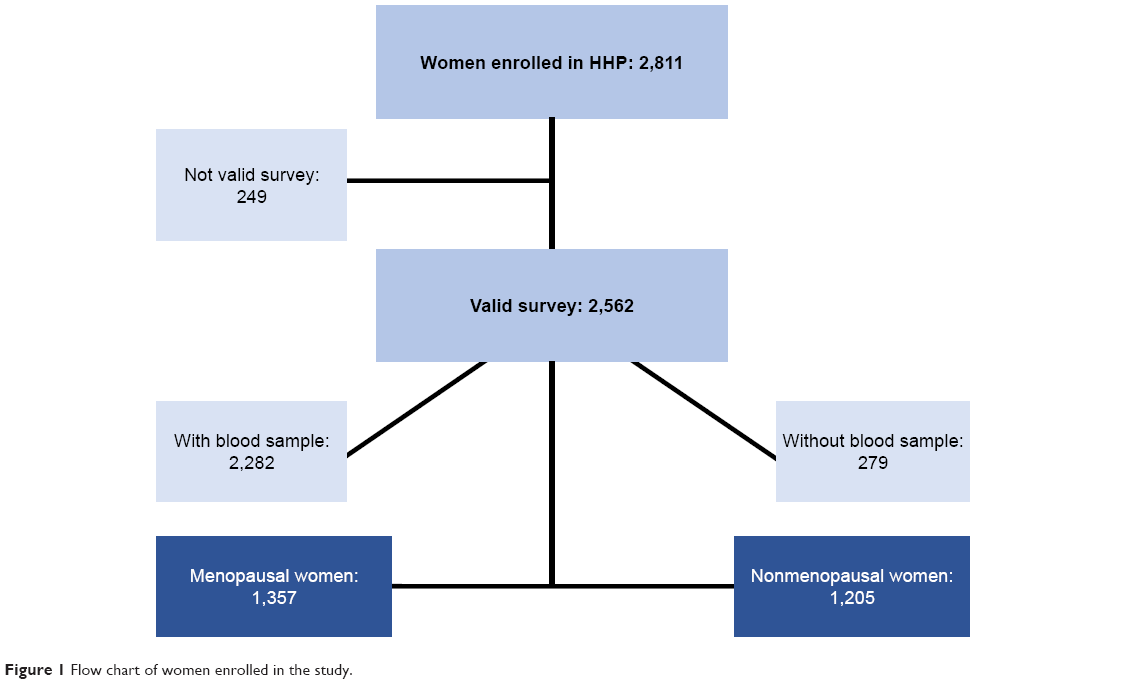 | Figure 1 Flow chart of women enrolled in the study. |
Methods
Blood pressure and heart rate
Three records of blood pressure and heart rate were obtained, with an interval of 2 minutes between each measurement, considering the average of the last two as a valid measure. The blood pressure was taken in the sitting position with the arm supported at rest at heart level.
An electronic digital sphygmomanometer (OMRON model HEM 7200-E) validated by the British Hypertension Society and the European Hypertension Society was used.
Weight and height
Weight (in kilograms) and height (in centimeters) were measured using a properly calibrated weighing scale with altimeter. The weight and height measurements were taken with the subjects not wearing shoes and wearing light clothing as a measurement parameter.
Waist circumference
The circumference of the waist was measured at a midpoint between the rib flange and the iliac crest with the participant standing, with the torso exposed, both arms on the sides of the body and in unintended exhalation.
Blood determinations
Blood samples were collected from the participants after 12-hour fasting. Glycemia, total cholesterol, high-density lipoprotein (HDL) cholesterol, low-density lipoprotein (LDL) cholesterol and triglycerides were determined.
Hypertension
Hypertension was defined as systolic blood pressure (SBP) ≥140 mmHg and/or diastolic blood pressure (DBP) ≥90 mmHg (5) and/or the current use of antihypertensive drugs.9
Smoking
People who, at the time of the survey, reported having smoked daily or occasionally were considered smokers; those who had never smoked and those who had not smoked for more than 6 months were considered nonsmokers.
Overweight – obesity
Body mass index (BMI) was calculated using the Quetelet Index (weight/height squared). A BMI between 20 and 24.9 kg/m2 defined as normal, 25–29.9 kg/m2 as overweight, and ≥30 kg/m2 obesity. Abdominal obesity was considered when waist circumference was ≥88 cm.10
Diabetes
Abnormal fasting plasma glucose (FPG) was considered when blood glucose was ≥100 mg/dL and diabetes when fasting blood glucose was ≥126 mg/dL and/or current use of hypoglycemic agents and/or insulin.11
Dyslipidemia
Dyslipidemia was defined as such when the analysis performed yielded one or more of the following results: total cholesterol ≥200 mg/dL and/or HDL cholesterol ≤50 mg/dL, and/or triglycerides ≥150 mg/dL or current treatment with drugs lipid-lowering agents.12
Metabolic syndrome
ATP III criteria10 was used, which defines the metabolic syndrome as the presence of three of the following five traits: 1) abdominal obesity, defined as a waist circumference in women ≥88 cm; 2) serum triglycerides ≥150 mg/dL or drug treatment for elevated triglycerides; 3) serum HDL cholesterol <50 mg/dL in women or drug treatment for low HDL cholesterol; 4) blood pressure ≥130/85 mmHg or drug treatment for elevated blood pressure; and 5) FPG ≥100 mg/dL or drug treatment for elevated blood glucose.
Anxiety/depression
Anxiety/depression evaluated with HADS, as an approximation to the state of mind. It assessed depressive and anxious symptoms, rating the severity of the symptom. HADS is a self-applied questionnaire with 14 items. Two subscales of 7 items each, on a Likert scale of 0–3. HAD anxiety: odd items, and HAD Depression: even elements, with a score range on each subscale of 0–21. Higher score, greater anxiety and depression. For both subscales scores, >11 would indicate “case.”13
The population educational level was stratified into four: 1) incomplete primary education equals <5 years of education, 2) complete primary education equals 6–7 years of education, 3) incomplete/complete secondary education equals 8–12 years of education and 4) tertiary university/incomplete/complete to >12 years of education.
Menopause was considered when the woman presented amenorrhea for 1 year or more.14
Statistical analysis
The descriptive statistical analysis was performed from the summary measurements and the comparisons were made applying bivariate analyses with parametric or nonparametric tests, as appropriate. We work with 95% CI.
A descriptive analysis of mean and SD for quantitative variables and frequency for qualitative variables was performed. For the comparison of qualitative variables, the chi-squared test was used; and for the quantitative variables, the Student’s t-test was used before studying the homogeneity of variables. Logistic regression models were fitted with a backward method from the potentially confusing variables of the menopause study groups. The ORs and their 95% CI are presented in all tests. All data analyses were performed using the SPSS Version 20 package. All P-values were two-tailed, and the cutoff of significant level was defined as P<0.05. The work was approved by the ethical committee of the University Hospital Favaloro Foundation.
Results
In this study, 2,811 women were recruited, of which 249 were withdrawn from the study due to lack of data in the survey; the final valid population was 2,562 women (Figure 1). The average age was 49.4 (±15.9); 10.4% belonged to semi-rural population and the rest to urban population; 87.5% of the population had one child or more than one; 40.9% of the population worked outside their home. Regarding the educational level, 22.1% of the population had <5 years of education, 31.3% had between 6 and 7 years, 33.4% had between 8 and 12 years and 13.2% had over 12 years of education (Table 1).
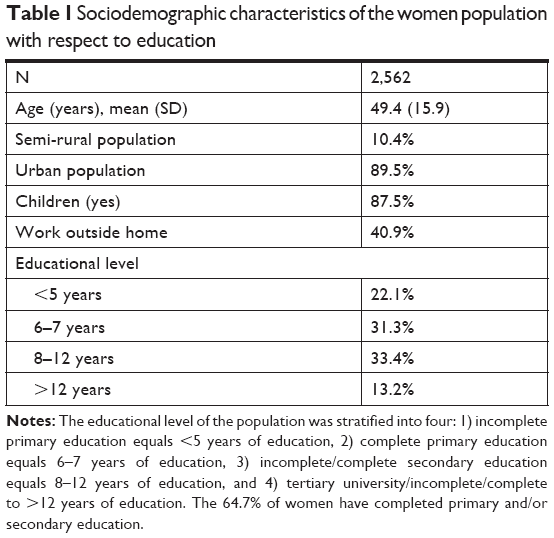 | Table 1 Sociodemographic characteristics of the women population with respect to education |
In our study, 1,357 (53%) women were MNP and 1,205 (47%) were non-MNP. The 249 excluded women presented similar characteristics to those who remained in the study.
Blood sample for analytical was obtained from 2,283 women (89%). The characteristics of MNP and non-MNP women are shown in Table 2. There are statistically significant differences (P<0.001) in age, SBP and DBP, heart rate, lipid profile, glycemia, and waist circumference.
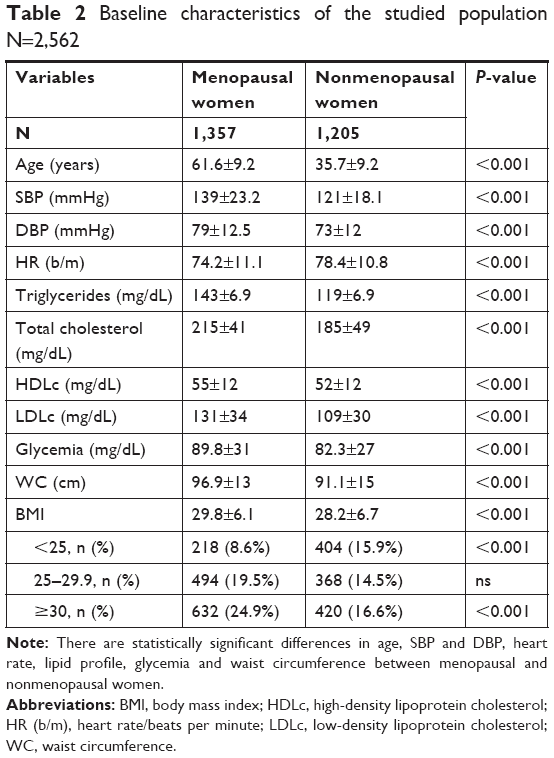 | Table 2 Baseline characteristics of the studied population N=2,562 |
BMI mean differs significantly between both groups. However, no differences were found in the overweight range. More women were found within normal weight among non-MNP women (P<0.001), and a higher prevalence of obesity among MNP women (P<0.001) was detected.
The prevalence of cardiovascular risk factors was significantly higher in MNP women, except for smoking that was higher in non-MNP women. All differences were statistically significant (Table 3).
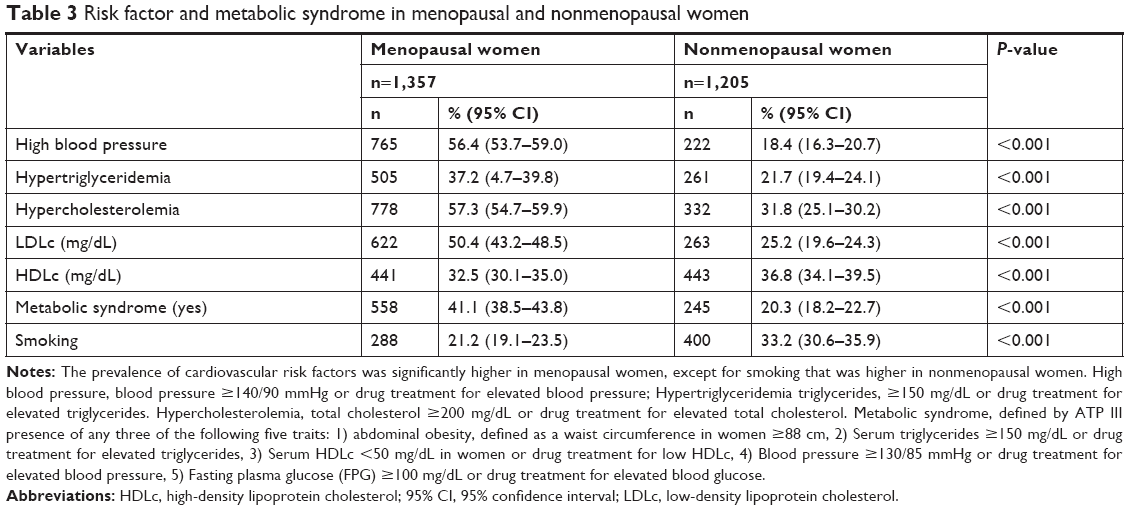 | Table 3 Risk factor and metabolic syndrome in menopausal and nonmenopausal women |
As variables can influence the perception of health, the anxiety and depression tests were performed using the HADS scale, considering a pathological score ≥11 for both. We did not find any differences in the prevalence of depression (12.2 vs 15.5, P=ns) or anxiety (20.7 vs 27.3, P=ns) between MNP and non-MNP women.
Health was perceived as worse among MNP women (P<0.05). Patients under 45 years of age also had a better perception of health than older patients (Table 4). For the subsequent analysis of health perception, we divided the samples into three categories: good, very good, and excellent into a single category (good or more) and maintaining the regular and bad categories.
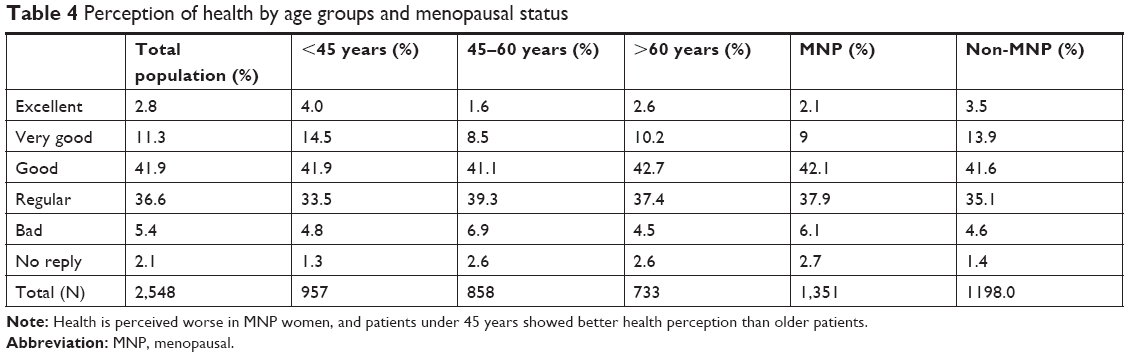 | Table 4 Perception of health by age groups and menopausal status |
We found a relationship between the negative perception of health with metabolic syndrome, depression, and anxiety, having children, smoking, residing in rural area, and low educational level; nevertheless, it does not correlate with MNP status (Table 5).
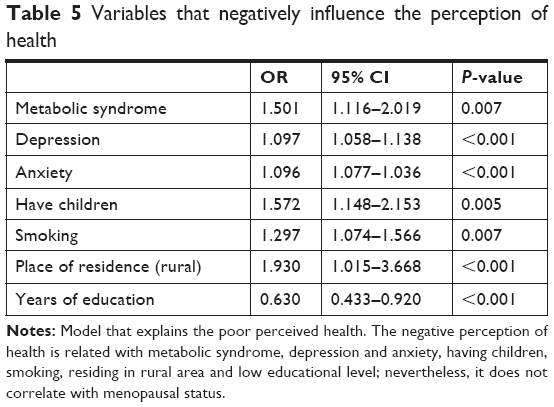 | Table 5 Variables that negatively influence the perception of health |
Discussion
The main finding of the present study was that self-reported poor health was strongly associated with metabolic syndrome, depression and anxiety, having children, smoking, residing in rural or semi-rural areas and low educational level; nevertheless, it does not correlate with menopause.
The advantages of this study were the well-defined study population, as well as the response rate of almost 100%. Other strength was the focus on a large random sample of the Argentinean population.
In this study, it was possible to simultaneously control variables such as age, self-reported health status, educational level, etc. Population was large enough to analyze data separately in relation to non-MNP and MNP women and two age groups.
These types of surveys have a long tradition; therefore, there is a considerable amount of experience associated with it. The questions were well validated and have been consistent over the years, according to the HAD Scale,13 and they have a high reliability.
Health surveys suggest that women generally perceive their health worse than men; that health professionals tend to overestimate our state of health; and that aging increases negative perception of their health (phenomenon of underestimation of health).13 Depression is an important mental health problem that impairs personal functioning and affects one in four women in their lifetime.15,16 It has been suggested that estrogen deficiency may increase the susceptibility to depression.17
Results on this study indicate that health was perceived as worse in MNP women (P<0.05) compared with non-MNP women. Patients younger than 45 years had a better perception of health than older patients.
We found a relationship between the negative perception of health and metabolic syndrome, depression, and anxiety, having children, smoking, residing in rural areas and low educational level; nevertheless, it does not correlate with menopause.
Results on this study contrast with those of Yen et al.18 A total of 672 Aboriginal women aged between 40 and 60 years (mean age: 49.43±5.33) were studied, of which 182 (38.3%) were classified as the depressive group. Conclusions drawn on that study were that perimenopausal states were associated with depression and women with a perimenopausal state had a higher prevalence of depression than those with a premenopausal state. Somatic symptoms were associated with depression for pre, peri, and postmenopausal states. What the authors related to depression is not exactly the MNP state, but the presence of vasomotor somatic symptoms.
In this study, negative perception of health associated with metabolic syndromes was found, which is in agreement with the previous findings of Burger et al, establishing that menopause is accompanied by adverse changes, including altered serum lipid profiles, hormonal changes, and neuroendocrine and immune system changes.19–21
Hypertension was related to poor perceived health in women but not in men. Likewise, women with poor self-perceived health were much more likely to be obese than women with good health.2
The study showed a negative perception of health related to depression, anxiety and residing in rural areas; in accordance with the results of Yen et al18 that related vasomotor symptoms with depression. The association between depression and perimenopausal status demonstrates that depression is also an important mental health issue for women going through MNP transition in rural areas. Physiological MNP symptoms were the factors most associated with depression, under control of psychosocial factors mentioned above in the present study. These results may also suggest a possible biological link between depression and MNP symptoms.
Results in this study showed that smoking has an inverse correlation with the perception of health, in concordance with other studies which confirm that both smoking men and women who had no regular physical activity perceived their health as worse than nonsmokers and physically active persons. Both men and women with poor self-perceived health were about twice as likely to be smokers.2
Lower educational levels were related to the ability to estimate risk and, thus, intelligence and other cognitive functions may further explain such ability.22 Individuals who had a university/college education were less likely to perceive their health as poor.2 On the other hand, a low educational level (<9 years) was also associated with increased mortality risks for men and women.23
Alcohol consumption was also related to ability to estimate risk, but this relation is not easy to understand and needs further confirmation.22
In this study, it was found that having children has an inverse correlation with the perception of health. This is probably related to the findings of Lui Filho24 who found that the number of births is associated with more severe symptoms of menopause in Brazilian women.
Results in this study should be interpreted in the light of three limitations. First, the stigmatization of mental health disorders might make women unwilling to admit their depression in the interviewing study. Second, the cross-sectional research design of the present study could not confirm causal correlations between MNP symptoms and depression. Third, women with MNP symptoms were not separated from the rest. However, given the large sample selected, this point could have been diluted.
Conclusions
Perceived health should be viewed as a multifaceted condition related to social circumstances, and various symptoms in women, including MNP symptoms, but not with menopause itself.
Acknowledgment
Fundación CERTUS Villa María. Córdoba. Argentina. The abstract of this paper was presented at the 28th European Meeting on Hypertension and vascular Protection as a poster presentation. The authors report no conflicts of interest in this work.
Disclosure
The authors report no conflicts of interest in this work.
References
WHO | World Health Organization [Internet]. WHO. [cited 2017 Jul 15]. Available from: http://www.who.int/mediacentre/factsheets/fs310/%20(Accessed%2014%20Jun%202017%20) | ||
Welin C, Wilhelmsen L, Welin L, Johansson S, Rosengren A. Perceived health in 50-year-old women and men and the correlation with risk factors, diseases, and symptoms. Gend Med. 2011;8(2):139–149. | ||
Kaplan GA, Camacho T. Perceived health and mortality: a nine-year follow-up of the human population laboratory cohort. Am J Epidemiol. 1983;117(3):292–304. | ||
Rakowski W, Mor V, Hiris J. The association of self-rated health with two-year mortality in a sample of well elderly. J Aging Health. 1991;3(4):527–545. | ||
Sundquist J, Johansson SE. Self reported poor health and low educational level predictors for mortality: a population based follow up study of 39,156 people in Sweden. J Epidemiol Community Health. 1997;51(1):35–40. | ||
Heistaro S, Jousilahti P, Lahelma E, Vartiainen E, Puska P. Self rated health and mortality: a long term prospective study in eastern Finland. J Epidemiol Community Health. 2001;55(4):227–232. | ||
Ladwig KH, Scheuermann W. Gender differences in the decline of mortality rates of acute myocardial infarction in West Germany. Eur Heart J. 1997;18(4):582–587. | ||
Verbrugge LM. Work satisfaction and physical health. J Community Health. 1982;7(4):262–283. | ||
Mancia G, de Backer G, Dominiczak A. 2007 ESH-ESC Practice Guidelines for the Management of Arterial Hypertension: ESH-ESC Task Force on the Management of Arterial Hypertension. J Hypertens. 2007;25(9):1751–1762. | ||
Grundy SM, Brewer HB, Cleeman JI, et al. Definition of metabolic syndrome: Report of the National Heart, Lung, and Blood Institute/American Heart Association conference on scientific issues related to definition. Circulation. 2004;109(3):433–438. | ||
Bloomgarden Z. American Diabetes Association Annual Meeting, 1997: obesity, diabetes prevention, and type 1 diabetes. Diabetes Care. 1997;20(12):1913–1917. | ||
National Cholesterol Education Program, National Heart, Lung, and Blood Institute, National Institutes of Health. Detection, Evaluation, and Treatment of High Blood Cholesterol in Adults (Adult Treatment Panel III) Final Report; 2012. | ||
Zigmond AS, Snaith RP. The hospital anxiety and depression scale. Acta Psychiatr Scand. 1983;67(6):361–370. | ||
Soules MR, Sherman S, Parrott E, et al. Executive summary: Stages of Reproductive Aging Workshop (STRAW). Climacteric. 2001;4(4):267–272. | ||
Kessler RC, Mcgonagle KA, Zhao S, et al. Lifetime and 12-month prevalence of DSM-III-R psychiatric disorders in the United States. Results from the National Comorbidity Survey. Arch Gen Psychiatry. 1994;51(1):8–19. | ||
Zilberman JM, Cerezo GH, del Sueldo M, Fernandez-Pérez C, Martell-Claros N, Vicario A. Association between hypertension, menopause, and cognition in women. J Clin Hypertens. 2015;17(12):970–976. | ||
Hunter M, Rendall M. Bio-psycho-socio-cultural perspectives on menopause. Best Pract Res Clin Obstet Gynaecol. 2007;21(2):261–274. | ||
Yen JY, Yang MS, Wang MH, et al. The associations between menopausal syndrome and depression during pre-, peri-, and postmenopausal period among Taiwanese female aborigines. Psychiatry Clin Neurosci. 2009;63(5):678–684. | ||
Burger HG, Hale GE, Robertson DM, Dennerstein L. A review of hormonal changes during the menopausal transition: focus on findings from the Melbourne Women’s Midlife Health Project. Hum Reprod Update. 2007;13(6):559–565. | ||
Gameiro CM, Romão F, Castelo-Branco C. Menopause and aging: changes in the immune system – a review. Maturitas. 2010;67(4):316–320. | ||
Zilberman JM. Menopausia: hipertension arterial y enfermedad vascular. Hipertensión y Riesgo Vascular. 2018;35(2):77–83. | ||
Frijling BD, Lobo CM, Keus IM, et al. Perceptions of cardiovascular risk among patients with hypertension or diabetes. Patient Educ Couns. 2004;52(1):47–53. | ||
Sundquist J, Johansson SE. Self reported poor health and low educational level predictors for mortality: a population based follow up study of 39 156 people in Sweden. J Epidemiol Commun Health. 1997;51:35–40. | ||
Lui Filho JF, Baccaro LF, Fernandes T, Conde DM, Costa-Paiva L, Pinto Neto AM. Factors associated with menopausal symptoms in women from a metropolitan region in Southeastern Brazil: a population-based household survey. Rev Bras Ginecol Obstet. 2015;37(4):152–158. |
 © 2018 The Author(s). This work is published and licensed by Dove Medical Press Limited. The
full terms of this license are available at https://www.dovepress.com/terms
and incorporate the Creative Commons Attribution
- Non Commercial (unported, 3.0) License.
By accessing the work you hereby accept the Terms. Non-commercial uses of the work are permitted
without any further permission from Dove Medical Press Limited, provided the work is properly
attributed. For permission for commercial use of this work, please see paragraphs 4.2 and 5 of our Terms.
© 2018 The Author(s). This work is published and licensed by Dove Medical Press Limited. The
full terms of this license are available at https://www.dovepress.com/terms
and incorporate the Creative Commons Attribution
- Non Commercial (unported, 3.0) License.
By accessing the work you hereby accept the Terms. Non-commercial uses of the work are permitted
without any further permission from Dove Medical Press Limited, provided the work is properly
attributed. For permission for commercial use of this work, please see paragraphs 4.2 and 5 of our Terms.