Back to Journals » Risk Management and Healthcare Policy » Volume 14
Health Data-Driven Machine Learning Algorithms Applied to Risk Indicators Assessment for Chronic Kidney Disease
Authors Chiu YL, Jhou MJ, Lee TS ![]() , Lu CJ, Chen MS
, Lu CJ, Chen MS ![]()
Received 19 May 2021
Accepted for publication 30 September 2021
Published 27 October 2021 Volume 2021:14 Pages 4401—4412
DOI https://doi.org/10.2147/RMHP.S319405
Checked for plagiarism Yes
Review by Single anonymous peer review
Peer reviewer comments 2
Editor who approved publication: Dr Jongwha Chang
Yen-Ling Chiu,1– 3 Mao-Jhen Jhou,4 Tian-Shyug Lee,4,5 Chi-Jie Lu,4– 6 Ming-Shu Chen7
1Graduate Institue of Medicine and Graduate School of Biomedical Informatics, Yuan Ze University, Taoyuan, 32003, Taiwan, Republic of China; 2Graduate Institute of Clinical Medicine, National Taiwan University College of Medicine, Taipei, 10002, Taiwan, Republic of China; 3Department of Medical Research, Department of Medicine,Far Eastern Memorial Hospital, New Taipei, 22056, Taiwan, Republic of China; 4Graduate Institute of Business Administration, Fu Jen Catholic University, New Taipei, 242062, Taiwan, Republic of China; 5Artificial Intelligence Development Center, Fu Jen Catholic University, New Taipei City, 242062, Taiwan, Republic of China; 6Department of Information Management, Fu Jen Catholic University, New Taipei City, 242062, Taiwan, Republic of China; 7Department of Healthcare Administration,College of Healthcare and Management, Asia Eastern University of Science and Technology, New Taipei, 22061, Taiwan, Republic of China
Correspondence: Chi-Jie Lu Fu Jen Catholic University, New Taipei 242062, Taiwan Email [email protected]
Ming-Shu Chen Asia Eastern University of Science and Technology, Taiwan
Asia Eastern University of Science and Technology, No.58, Sec. 2, Sichuan Rd, Pan-Chiao Dist., New Taipei, 22061, Taiwan
Email [email protected]
Purpose: As global aging progresses, the health management of chronic diseases has become an important issue of concern to governments. Influenced by the aging of its population and improvements in the medical system and healthcare in general, Taiwan’s population of patients with chronic kidney disease (CKD) has tended to grow year by year, including the incidence of high-risk cases that pose major health hazards to the elderly and middle-aged populations.
Methods: This study analyzed the annual health screening data for 65,394 people from 2010 to 2015 sourced from the MJ Group – a major health screening center in Taiwan – including data for 18 risk indicators. We used five prediction model analysis methods, namely, logistic regression (LR) analysis, C5.0 decision tree (C5.0) analysis, stochastic gradient boosting (SGB) analysis, multivariate adaptive regression splines (MARS), and eXtreme gradient boosting (XGboost), with estimated glomerular filtration rate (e-GFR) data to determine G3a, G3b & G4 stage CKD risk factors.
Results: The LR analysis (AUC=0.848), SGB analysis (AUC=0.855), and XGboost (AUC=0.858) generated similar classification performance levels and all outperformed the C5.0 and MARS methods. The study results showed that in terms of CKD risk factors, blood urea nitrogen (BUN) and uric acid (UA) were identified as the first and second most important indicators in the models of all five analysis methods, and they were also clinically recognized as the major risk factors. The results for systolic blood pressure (SBP), SGPT, SGOT, and LDL were similar to those of a related study. Interestingly, however, socioeconomic status-related education was found to be the third important indicator in all three of the better performing analysis methods, indicating that it is more important than the other risk indicators of this study, which had different levels of importance according to the different methods.
Conclusion: The five prediction model methods can provide high and similar classification performance in this study. Based on the results of this study, it is recommended that education as the socioeconomic status should be an important factor for CKD, as high educational level showed a negative and highly significant correlation with CKD. The findings of this study should also be of value for further discussions and follow-up research.
Keywords: chronic kidney disease, health screening, machine learning algorithms, risk indicators assessment, education
Introduction
As global aging progresses, the health management of chronic diseases has become an important issue of concern to governments. Chronic kidney disease (CKD) is a disease associated with many factors, but its relative importance is not well known. The per capita healthcare expenditure for CKD in Taiwan has increased annually since Taiwan first began implementing its National Health Insurance (NHI) system in 1995. According to the Taiwanese Ministry of Health and Welfare’s NHI statistical data,1 as well as the Taiwan Society of Nephrology’s latest annual report on kidney disease in 2019,2 among the 23.571 million people in Taiwan, the number of new dialysis patients in 2017 was 11,887, and the total number of people who needed dialysis was 82,031. In the same year, the cost of dialysis was 1.23 billion US dollars, accounting for a staggering 5.73% of the total annual NHI expenditure in Taiwan.3 The costs of providing care for end-stage renal disease (ESRD) patients are especially high, as Taiwan has the highest incidence and prevalence rates of ESRD in the world.4
The US Renal Data System (USRDS) Annual Report published the latest global uremia rankings. According to the report, the data show that the prevalence of dialysis patients in Taiwan and the annual incidence of dialysis are the highest in the world.5 CKD is a global public health problem and a leading cause of morbidity and mortality worldwide, and the number of cases worldwide in 2017 was 69.75 million, with CKD causing 1.2 million deaths. The global prevalence of CKD was 9.1% in 2017.6 In the same year, 1.2 million individuals died of kidney disease. Additional 1.4 million deaths from cardiovascular disease were attributed to impaired kidney function, which is defined as having a low estimated glomerular filtration rate (e-GFR) or elevated urinary albumin-to-creatinine ratio without renal replacement therapy. The causes of the deterioration of CKD have been studied widely, but it remains necessary to find the critical factors underlying several causes.7
With ongoing improvements in medical treatment, the worldwide prevalence rate of CKD has reached 13.4% and continues to increase year by year, with the prevalence rate of CKD in women being higher than that in men.8 In Taiwan, a study utilizing the MJ Health-Check-Up-Based Population Database (MJPD) for 1994 to 2006 estimated the prevalence of CKD in adults at 11.93% (95% CI, 11.66–12.28), but only 3.54% of the population reported knowing an individual who had the disease.9 CKD is an age-related disease in which kidney function decreases with age, while hypertension, diabetes, obesity, and early kidney abnormalities all accelerate the decline in kidney function.10 There are no obvious symptoms in the early stages of CKD, but if kidney function continues to decline, end-stage renal failure (uremia) will eventually occur, and patients will need to rely on peritoneal dialysis (PD), hemodialysis (HD), or kidney transplantation to maintain kidney function and their current lifestyles.
As noted above, CKD is age-related,10–12 and Taiwan’s population is rapidly aging, with the proportion of people aged 65 years and over reaching 14.05% in 2018, which is nearly double the proportion in 1993 (7.10%). Moreover, the average life expectancy in Taiwan has reached 80.69 years old, and Taiwan has now officially met the WHO definition of an aged nation. According to statistics from Taiwan’s Ministry of the Interior13 and data from the National Development Council (NDC),14 the population over the age of 65 is growing rapidly and is expected to reach more than 20% of the elderly population in five years’ time (20.1% in 2025), such that Taiwan will formally become one of the internationally defined super-aged countries along with Japan, South Korea, Singapore, and some European countries, such as Germany and Italy. With its aging population, the prevalence of end-stage kidney failure in Taiwan is also increasing year by year, and according to the 2019 annual report of kidney disease in Taiwan, the outpatient dialysis prevalence per million people increased from 2525 in 2008 to 3480 in 2017, an increase of 37.82% in ten years. At the same time, this rapid growth in prevalence has also caused huge consumption of health care resources, resulting in heavy social and universal NHI financial burdens.2
Early CKD has no obvious symptoms, so the estimated glomerular filtration rate (e-GFR), which is associated with gender, age, and serum creatinine value, is used for the diagnosis of CKD.11 The renal function of CKD patients will gradually decline until uremia eventually develops, at which point the patient needs to receive HD, PD, or kidney transplantation. The criteria for CKD evaluation, classification, and stratification were first established in 2002 by the American Kidney Foundation.15 After many years of global expert discussion, the latest guidelines for chronic kidney disease were published in the 2012 Kidney Disease: Improving Global Outcome (KDIGO) guidelines, in which CKD is divided into five stages based on e-GFR (as shown in Table 1).16 One of the major standard definitions of CKD is the glomerular filtration rate (GFR) < 60 mL/min/1.73 m2 for over three months. In general, the assessment of CKD is mostly defined using the e-GFR categories for the G3a to G5 stages.
 |
Table 1 The Stages of CKD in e-GFR |
In Iran, 5.1% of the population aged 20–60 years suffered from kidney-related diseases in 2012, with age, hypertension, and diabetes being significant risk factors and proteinuria being significantly associated with CKD.12 Meanwhile, data collected from June 2010 to September 2012 in Henan, China, showed that the prevalence of CKD among healthy workers was 5.94%, with obesity, diabetes, and hypertension being risk factors.17 The global average prevalence of CKD was 13.4% (95% CI=11.7–15.1%), with the stage G1 prevalence rate=3.5% (2.8–4.2%, G2=3.9% (2.7–5.3%), G3=7.6% (6.4–8.9%), G4=0.4% (0.3–0.5%), and G5=0.1% (0.1–0.1%), and the female prevalence rate being higher than that of men.5 Without staging, the prevalence of CKD in US adults is around 11–15.6%, with the prevalence among people aged over 80 years being 39%,18,19 while the prevalence is 11.2% in Australian adults, with the prevalence among people aged age over 65 years being 54.8%.20
According to previous studies, there are many risk factors related to the occurrence of CKD, including age, sex, race, family history, obesity, smoking, high-protein diets, anemia, proteinuria, and various chronic diseases, such as diabetes, hypertension, hyperlipidemia, metabolic syndrome (MetS), cardiovascular disease, and hyperuricemia.21–24 Recent studies have sought to predict rates of CKD and related chronic diseases using different methodologies and algorithms. According to research by Khalilia et al, a large amount of health database data is increasingly available, and many important disease forecasting models are being developed rapidly.25 Tabaei and Herman pointed out that the establishment of disease prediction model is neither expensive nor difficult to implement and that such models offer various benefits and will become important tools for disease screening in the future.26 In Taiwan, our study teams and other relevant scholars began using decision tree algorithms in 2008 to analyze and actively apply health care screening to health care, and later used health screening databases to further explore and compare the advantages and disadvantages of different cluster technologies or algorithms for data exploration.27 During the same period, studies have also used fuzzy neural network technology to analyze various collections of medical data and have found that the alcohol hepatitis index “r-GT” and white blood cell (WBC) counts are important indicators of health hazards.28 Our research team also analyzed a large-scale health check-up database through the decision tree algorithm technique and found that the major prevention decision point of MetS should involve high levels of blood serum triglycerides (TGs),29 a result echoing the findings of previous studies. Lemieux et al, in a study of Canada’s health care system, found that controlling high TG levels can prevent cardiovascular disease,30 while Worachartcheewan et al used decision tree algorithms to analyze health databases and found that TGs are the most important factor among the five major risk factors for MetS in Thailand’s communities.31 Since there are common risk factors for CKD and MetS, these studies also provided valuable information for this study and other analyses of prediction models for other chronic diseases.
Most of the references regarding disease prediction in the medical field consist of cohort studies, but the cost of longitudinal studies is huge and the samples used must be large enough, and such studies require several years of continuous tracking data in order to provide better quality research results to build prediction models. Meanwhile, the use of machine learning algorithms tools to analyze medical/healthcare databases has increased in recent years. For large databases, prediction models techniques have been widely used to identify significant variables in a short period of time and to improve the accuracy and efficiency of disease prediction.32 Relatedly, prediction model methods are used in this study for risk indicators assessment for CKD.
There are different kinds of machine learning methods that can be used to construct prediction models for medical/healthcare databases.6,25,27–29 In the present study, the five well-known nonparametric and machine learning methods, including logistic regression (LR), C5.0, stochastic gradient boosting (SGB), the multivariate adaptive regression splines (MARS), and eXtreme gradient boosting (XGboost) methods, were used to build CKD prediction model and evaluate the risk factor indicators since they are based on different concepts to build effective predictive algorithms. LR and MARS are nonparametric methods. C5.0 is a decision tree algorithm based on information theory. SGB is an ensemble method based on decision trees. XGboost is a gradient tree boosting system.
Materials and Methods
Most cross-sectional studies have shown that CKD is influenced by age and gender,11,18–20,22 and calculating an e-GFR requires three variables, namely, gender, age, and Cr., which is why this study analyzed risk factors to exclude those variables. The study subjects discussed in this study were healthy, sub-healthy, or sub-clinical, and the study population consisted of younger and/or middle-aged groups, which can help with the early assessment of risk factors and the establishment of predictive models to prevent CKD. Figure 1 shows the gender and age distribution of the study population.
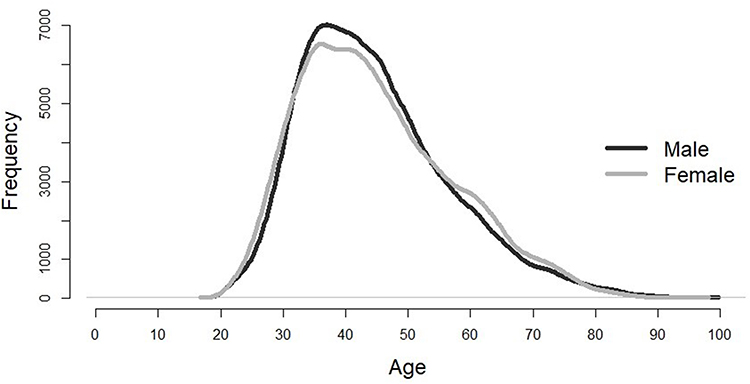 |
Figure 1 The gender and age distribution of the study subjects. |
The datasets used were sourced from the MJ Group – a major health screening center in Taiwan – for the years 2010 through 2015. The MJPD database includes data collected from four MJ clinics that provide periodic health examinations to the center’s approximately 71,000 members and contains data for 201,087 cases. For this study, we kept the latest health examination data and discarded the other inappropriate data, using only 65,394 records for our analysis. All subjects were heath or sub-health population which participates in the health screening in MJ clinics. The exclusion criteria, including moderately severe disability, severe disability, bedridden, medication or mental status, were unstable, as well as other central or peripheral types of neurological diseases such as Dementia or Alzheimer’s disease. The variables analyzed as risk factors included body mass index (BMI), body fat (BF), waist circumference (WC), blood pressure (BP), glucose, GOT, GPT, r-GT, blood urea nitrogen (BUN), uric acid (UA), TGs, total cholesterol (T-Cho), HDL, LDL, MetS, and education indicators, among others. All the datasets used were authorized by and received from the MJ Health Research Foundation (Approval No.: MJHRF-2016005A). The data application procedures are described at http://www.mjhrf.org/main/page/release1/en/#release01. The MJPD database is accessible to academic researchers upon request. With respect to ethical issues regarding the usage of data in the database, the protocol of this study was evaluated and deemed acceptable by the Research Ethics Review Committee of Far Eastern Memorial Hospital (FEMH-IRB-107126-E, Protocol Version7, 2020-06-18) and the MJ Health Research Foundation. Regarding IRB ethics requirements, all the data were anonymized before analysis.
Current disease prediction models based on different machine learning algorithms have been applied in the analysis of suspected coronary artery disease, necrotizing enterocolitis, and hepatitis C,32–34 but the application of such models for CKD has been rare. This study used LR, C5.0, SGB, MARS, and XGboost methods to build models as they have been widely applied in various healthcare and/or medical informatics applications.35–38 Moreover, LR, C5.0 and XGboost algorithms were also successfully applied in the CKD prediction research.6,39–41 The applied algorithm to each of the five methods was implemented in the corresponding R package with R software of version 3.6.3.
For the first method, the LR algorithm models the relationship between binary target variable and influencing factors. It uses logistic function to discriminate between the two classes of output and has been successfully used in different medical fields. For building the model, LR analysis was implemented using the bolrr R package, version 0.3.0.42 The default setting of this function was used.
The second method, C5.0 model, is an improved version of C4.5 decision tree. Information gain measure based on the calculation of entropy values for parent and child attributes is applied to this model.43 C5.0 model is based on maximum “information gain ratio” of attributes to split the data for generating the tree. The splitting process is iteratively executed until there is no need for further split. Each split is an interpretation of the variation or impurity in the data. For constructing the C5.0 model, the C5.0 R package of version 4.1.1544 was used. To find the best parameter set to provide a promising C5.0 model, the OptimClassifier R package of version 0.1.5 was implemented for the parameters of the number of observations in any leaf node and tree pruning.45
The third method, SGB used a stage-wise manner by fitting each tree to the gradient of a loss function for model construction.46 In the SGB algorithm, according to the classification error information, various base learners are constructed in each iteration to reduce the classification error of the previous iteration. The algorithm is based on a stochastic mechanism to construct the model due to the fact that each iteration only uses a randomly selected subset of the data in the tree building process, and only a random subset of the input variables is assessed for splitting. For building the SGB model, the “gbm” package of R of version 6.0–8447 is used in this study. The number of trees, interaction depth, and learning rate (shrinkage) are important hyper-parameters in the SGB algorithm. The OptimClassifier package of version 0.1.5 is used to find the best parameter set of the SGB model.
The fourth method, MARS partitions the dataset into different clusters, with each cluster having its own regression equation.48 MARS utilizes few variables for modeling relationships and interactions between variables that are approximately additive or involve interactions. The first step of the MARS method is to employ a forward process to select all possible basic functions and their corresponding knots. Then, the generalized cross‐validation criterion is utilized in a backward algorithm to remove all basic functions in the order of the least contributions to develop the best combination of existing knots. In the final step, the important variables and their values for knots of hinge functions are obtained. In this study, the MARS model was built by applied the earth R package of version 5.3.0 with default values.49
For the fifth method, XGboost is a tree-based learning algorithm of a scalable end-to-end gradient tree boosting system.50 Boosting is based on the ensemble learning concept to sequentially build many models in which each new model attempts to correct for the imperfections or inadequacies in the previous model. XGboost utilizes a new generalized gradient boosting decision tree algorithm to speed up the model construction. A regularization term, which uses both first-order and second-order derivatives to achieve a second-order Taylor expansion of the loss function, is employed in the XGboost to prevent the overfitting issue.50 In this study, the XGboost model was generated by using the XGboost R package of version 0.90.0.2.51 To find the best hyper-parameter set for constructing promising XGboost models, the caret R package of version 6.0–8452 was used for tuning the important hyper-parameters.
We randomly selected 80% of the total subjects as the training samples, while 20% of the total subjects were employed as the testing sample for measuring the out-of-sample predictive ability of the five machine learning methods. Moreover, a 10-fold cross-validation method was used for training the models for each of the five algorithms. To compare the performance of the five machine learning algorithms based on testing samples, the classification correctness was measured using receiver operating characteristic (ROC) curve analysis to estimate the area under the curve (AUC). Metrics including accuracy, sensitivity, and specificity were also considered in this study. The accuracy is the ratio of the number of samples that are classified correctly to the total number of samples. The sensitivity is the ratio of the true positive number of samples that are classified correctly to the total number of samples that are classified as positive. The specificity is the ratio of the true negative number of samples that are correctly classified as negative to the total number of samples that are classified as negative. The importance of all the risk factors for each model was determined by the packages used based on prediction performance.
Results
In this study, a total of 18 variables were analyzed as potential risk factors. That is, in the present cross-sectional study, e-GFR was associated with gender, age, and serum Cr. value,11 and the e-GFR was calculated based on the KDIGO guidelines16 and the Chronic Kidney Disease Epidemiology Collaboration (CKD-EPI) formula.53 To calculate the risk factors for early CKD in sub-healthy populations, we used the G3a; G3b & G4 stage in to the CKD group, as Table 1 shows that subjects with an e-GFR > 60 mL/min/1.73 m2 (G1 and G2 group) were in the Non-CKD group and removed the e-GFR < 15 mL/min/1.73 m2 (G5 group) subjects.
Table 2 shows the analysis results for the 18 variables, including the obesity-related factors (that is, BMI, BF, and WC), vital signs (SBP and DBP), and biochemical laboratory items (glucose, SGOT, SGPT, r-GT, BUN, UA, TG, T-Cho, HDL, and LDL), as well as MetS and educational level. As Table 2 shows that among the total of 65,394 subjects, 96.55% had an e-GFR identifying them as non-CKD, and 15 variables were got statistically significantly different for the risk factors of CKD. The MetS-related indicators also got statistically significantly, The Odds Ratio of MetS was 2.95, and the 95% confidence interval was 2.70 to 3.22. The high educational level showed a negative and highly significant correlation with CKD, based on illiterate people, the Odds Ratio of the University and Graduate School were 0.10, and the 95% confidence intervals were 0.08 to 0.12 and 0.08 to 0.13, respectively.
 |
Table 2 Characteristics of Participants for Predicting CKD According to Data Status |
Table 3 shows the classification performance of the five machine learning algorithms. From Table 3, it can be seen that the accuracy values of the LR analysis, C5.0 analysis, SGB analysis, the MARS, and the XGboost were 0.7773, 0.8231, 0.7139, 0.7943, and 0.7517, respectively. The C5.0 analysis had the best accuracy value, followed by the MARS. Next, with regard to sensitivity, the C5.0 analysis also generated the best result, with a value of 0.8280, followed by the MARS with a value of 0.7967. For specificity, the SGB had the highest value of 0.8207, while the XGboost had the second highest value of 0.7883. In the end, for the AUC, it can be observed that the AUC values of the LR, C5.0, SGB, MARS, and XGboost methods were 0.8487, 0.8278, 0.8552, 0.8392, and 0.8586, respectively. The XGboost generated the best AUC value, followed by the SGB and LR analyses. Figure 2 shows the ROC curves of the five classification methods. It shows that the XGboost has the best classification performance ability.
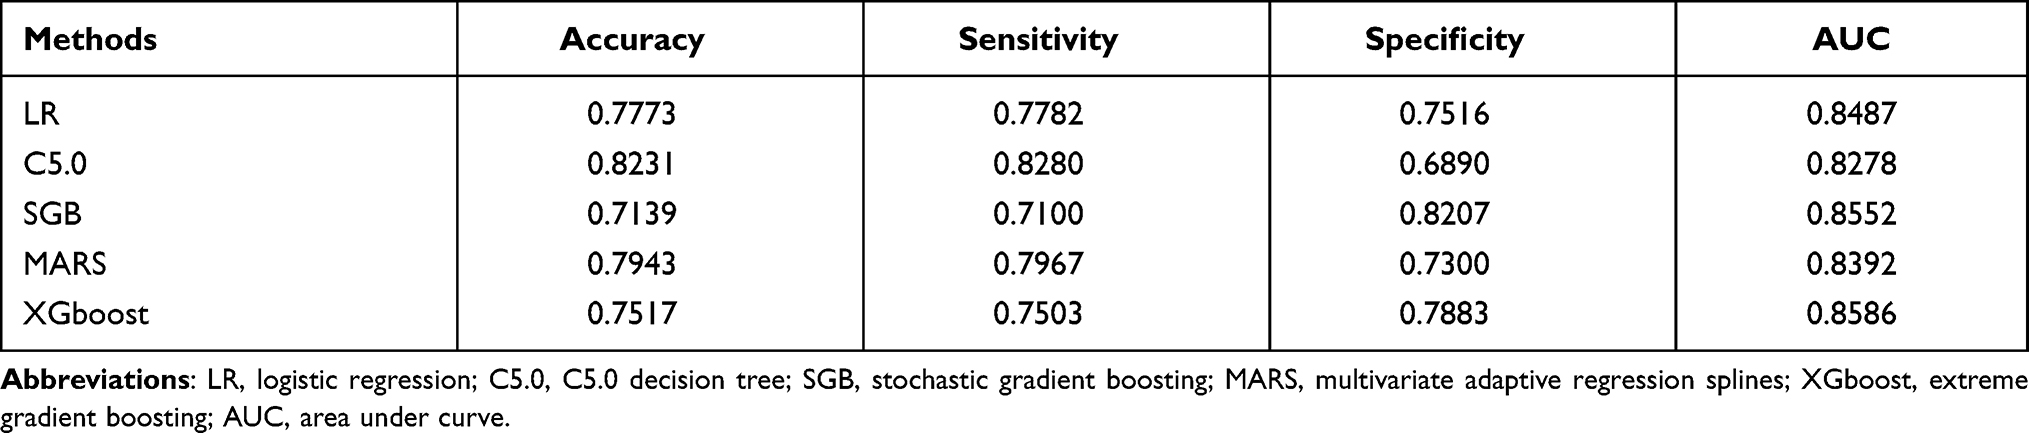 |
Table 3 Classification Performance Comparison |
 |
Figure 2 ROC curves of the five machine learning algorithms methods. |
Overall, the results in Table 3 and Figure 2 show that the XGboost generated the best classification performance. The LR, C5.0, SGB, and MARS analysis also provided similar levels of performance to that of the XGboost. As the XGboost, LR, C5.0, SGB, and MARS models all provided high classification results, the important risk factors, as ranked by XGboost, LR, C5.0, SGB, and MARS analysis methods, are further discussed. Each method generated one set of important risk factors.
Table 4 shows the top five important risk factors ranked by the LR, C5.0, SGB, MARS and XGboost methods, respectively. Note that a risk factor with a rank of 1 indicates that it is the most important risk factor. From the Table, it can be seen that there are seven risk factors, including BUN, UA, Education, SGOT, SGPT, SBP, and LDL, are selected. Moreover, BUN, UA, and Education are all ranked as the top three important risk factors in all five models, with only a different ranking. Under LR, C5.0, SGB, and XGboost methods, Education is considered as the third important risk factor. In the MARS, Education is ranked as the second important risk factor. For SGOT and LDL, they are all selected once by different methods. SGPT is ranked as the 5th by using the LR, SGB, MARS, and XGboost methods; SBP is ranked as the 4th in the C5.0, SGB, MARS, and XGboost methods.
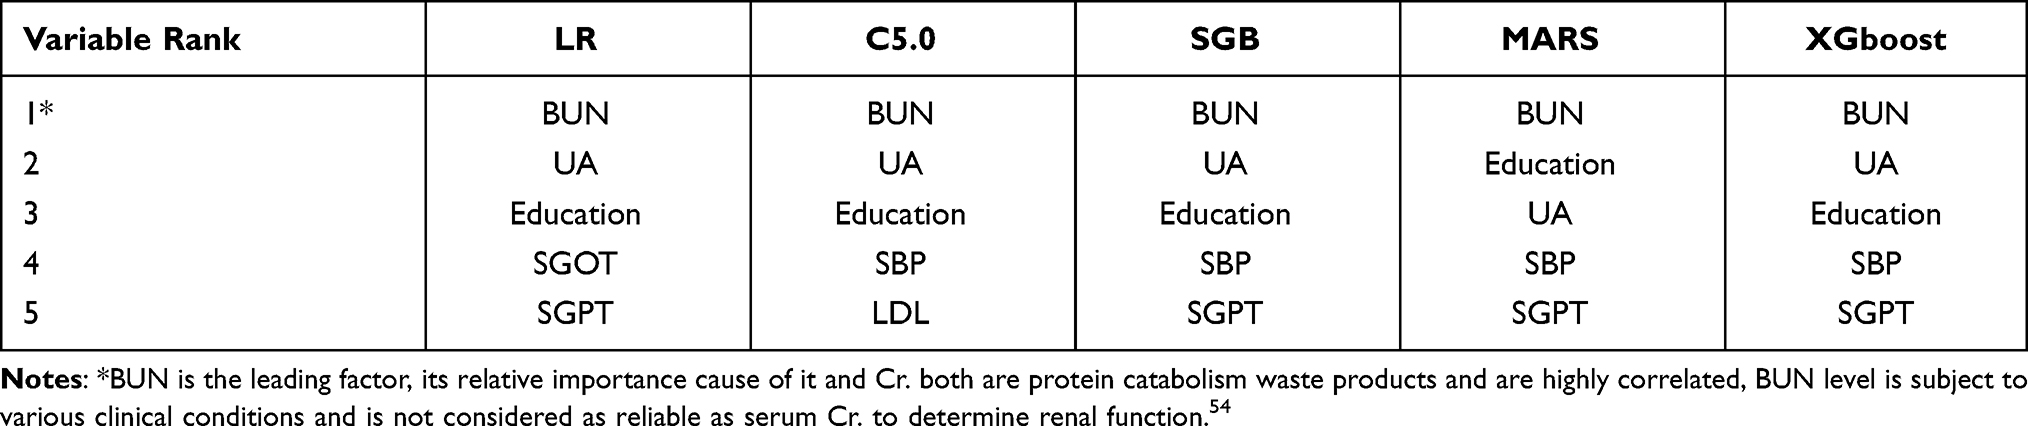 |
Table 4 The Top Five Important Risk Factors Ranked by the LR, C5.0, SGB, MARS and XGboost Methods |
Discussion
Based on the results, seven important risk factors of CKD, namely, BUN, UA, Education, SBP, SGPT, SGOT, and LDL, were screened, with some of the results being similar to those of most related studies.6,11,18–24,55 BUN, UA, and Education were found to be the three most important factors, followed by SBP, SGPT, SGOT, and LDL. We then further analyzed the Education indicator of the important CKD risk factors. Figure 3 shows a histogram of each educational level and odds ratio in the education indicator with CKD & non-CKD classes.
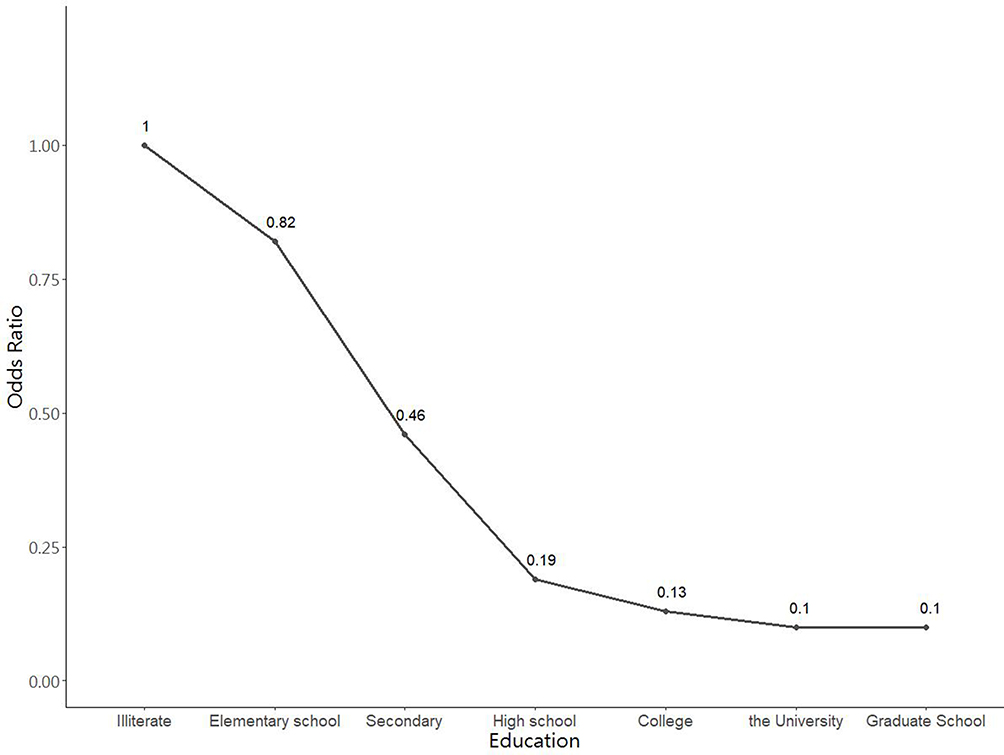 |
Figure 3 Histogram of each educational level and odds ratio in the education indicator with CKD & non-CKD classes. |
In terms of clinical concepts, BUN, UA, MetS and the other laboratory indicators are undoubtedly commonly recognized risk factors. However, in this study, educational level showed different results when analyzed using the analytical methods, high educational level showed a negative and highly significant correlation with CKD, which indicates that the lower education population may get the higher the risk of developing early CKD.
That low educational level was associated with more CKD and less health awareness might not be surprising, but the magnitude of excess and its overall implications were of concern. Participants with high educational levels had a rate of chronic kidney disease that was nearly a tenth lower than did those with low education. People, who are less educated, by having poorer lifestyles and less access to timely care, tend to have more risk factors related to CKD, such as diabetes and hypertension.56 The prevalence of chronic kidney disease was substantially higher in the group with low socioeconomic status than in the high-status group.9
In a study from Taiwan by Shih et al,6 the experimental results showed that the urine protein and creatinine ratio (UPCR), proteinuria (PRO), red blood cell (RBC) count, glucose fasting (GLU) level, TG, and T-Cho, as well as age and gender, were important risk factors for early CKD prediction. However, this study also determined CKD by using the G1 stage (e-GFR ≧ 90 mL/min/1.73 m2) to indicate non-CKD; the subjects of G2 stage were not rigorous when it was used to represent and indicate the CKD patients. Also, there were other differences between the two studies, including differences in the methods of research analysis used, as well as differences in the types of study subjects and variables of risk factors discussed. In addition, the subjects of this study included the north, central, and southern ethnic groups of Taiwan, and this study analyzed a larger number of study subjects while also comparing different decision-making analysis calculation methods.
A recent study by Chang et al55 found that, of a total of 297,603 participants, 29.7% had reduced e-GFR, with the G1 and G2 stages (e-GFR > 60 mL/min/1.73 m2) being used as the non-CKD criteria. The study used a health examination database for the elderly and evaluated the data using regression and stratification analyses. This study is similar to our study using the same criteria but only focuses on people over the age of 65 in the elderly. In addition, age, gender, BMI, and socioeconomic factors were lifestyle factors that showed statistical significance in this study. This means that the obesity-related indicators and socioeconomic factors are important for CKD evaluations.
Limitations
The source of a single dataset and the lack of continuity of data analysis were the main limitations of this study. Subsequent studies can further explore the composition of different genders, age groups, and other position variants. In addition, this study was the same as those that used cross-sectional data, in that we estimated the influence factors and speculated as to the possible effects, but this did not represent causal inference. A retrospective study using longitudinal analysis should constitute a better way to determine causal inferences.
Conclusions
Data for 65,394 different subjects sourced from a health screening database were used in this study, and we performed five machine learning algorithms including LR, C5.0, SGB, MARS and XGboost to analyze the data and then compared their performances. The empirical results show that the five ‘machine learning algorithms methods can provide high and similar classification performance in this study. The XGboost method can generate a better classification result than the four competing methods. The seven most important risk factors including BUN, UA, Education, SBP, SGPT, SGOT, and LDL were identified. In addition to BUN and UA, the present study found that Education is more important than other indicators. The lower the education population may get the higher the risk of developing early CKD, but the reason why people of lower socioeconomic status had a higher rate of CKD has not received wide recognition and discussion. This finding is worthy of further study and analysis through longitudinal or prospective studies. Moreover, such studies are warranted in general for confirmation and extrapolation of the findings of the current study.
The subject of the innovative application to CKD patient potential groups and healthcare issues, this study compares different algorithms and re-verifies the relevant risk factors, especially at a prominent educational level. The education used to represent socioeconomic status is a limitation of this study. Although education is an imperfect proxy, it is available for almost all study participants, whereas not everyone has an occupation or an income. We suggest that government health units should pay attention to increase health awareness for people with lower educational levels in order to improve the effectiveness of CKD prevention and treatment.
Data Sharing Statement
All of the datasets collected from the MJ Health Research Foundation, the data need to apply and authorize the use, and the application procedures are accessed via this link. http://www.mjhrf.org/main/page/release1/en/#release01
Ethical Approval
All the datasets used were authorized by and received from the MJ Health Research Foundation. With respect to ethical issues regarding the usage of data in the database, the protocol of this study was evaluated and deemed acceptable by the Research Ethics Review Committee of Far Eastern Memorial Hospital (FEMH-IRB-107126-E, Protocol Version7, 2020-06-18) and the MJ Health Research Foundation (Approval No.: MJHRF-2016005A).
Acknowledgments
We thank the Ministry of Science and Technology for supporting this research with ID MOST-108-2221-E-161-003-MY2. This work is also partially supported by Fu Jen Catholic University (A0110181 to C.-J.L.) and the Ministry of Science and Technology (MOST 110-2221-E-030-010 to C.-J.L.). In addition, the authors would like to thank Ching-Chih Hung, the Director at Dept. of Laboratory Medicine, Taipei Hospital, Ministry of Health and Welfare, Taiwan for support and help.
Disclosure
The authors report no conflicts of interest in this work.
References
1. National Health Insurance Administration, Ministry of Health and Welfare. Available from: https://www.nhi.gov.tw/Content_List.aspx?n=15B519F518114424&topn=5FE8C9FEAE863B46.
2. 2019 Annual Report on Kidney Disease in Taiwan, Taiwan Society of Nephrology. Available from: https://www.tsn.org.tw/UI/L/TWRD/ebook_2019%E5%B9%B4%E5%A0%B1.pdf.
3. Tang CH, Chen HH, Wu MJ, et al. Out-of-pocket costs and productivity losses in haemodialysis and peritoneal dialysis from a patient interview survey in Taiwan. BMJ Open. 2019;9(3):e023062. doi:10.1136/bmjopen-2018-023062
4. Yang WC, Hwang SJ; Taiwan Society of Nephrology. Incidence, prevalence and mortality trends of dialysis end-stage renal disease in Taiwan from 1990 to 2001: the impact of national health insurance. Nephrol Dial Transplant. 2008;23(12):3977–3982. doi:10.1093/ndt/gfn406
5. Wu HH, Kuo CF, Li IJ, et al. Family aggregation and heritability of ESRD in Taiwan: a population-based study. Am J Kidney Dis. 2017;70(5):619–626. doi:10.1053/j.ajkd.2017.05.007
6. Shih CC, Lu CJ, Chen GD, Chang CC. Risk prediction for early chronic kidney disease: results from an adult health examination program of 19,270 individuals. Int J Environ Res Public Health. 2020;17(14):4973. doi:10.3390/ijerph17144973
7. CKD a leading cause of morbidity and mortality worldwide, renal & urology news issue archive. Available from: https://www.renalandurologynews.com/home/news/nephrology/chronic-kidney-disease-ckd/ckd-a-leading-cause-of-morbidity-and-mortality-worldwide/.
8. Hill NR, Fatoba ST, Oke JL, et al. Global prevalence of chronic kidney disease–a systematic review and meta-analysis. PLoS One. 2016;11(7):e0158765. doi:10.1371/journal.pone.0158765
9. Wen CP, Cheng TYD, Tsai MK, et al. All-cause mortality attributable to chronic kidney disease: a prospective cohort study based on 462 293 adults in Taiwan. Lancet. 2008;371(9631):2173–2182. doi:10.1016/S0140-6736(08)60952-6
10. Gansevoort RT, Correa-Rotter R, Hemmelgarn BR, et al. Chronic kidney disease and cardiovascular risk: epidemiology, mechanisms, and prevention. Lancet. 2013;382(9889):339–352. doi:10.1016/S0140-6736(13)60595-4
11. Ma YC, Zuo L, Zhang CL, Wang M, Wang RF, Wang HY. Comparison of 99mTc-DTPA renal dynamic imaging with modified MDRD equation for glomerular filtration rate estimation in Chinese patients in different stages of chronic kidney disease. Nephrol Dial Transplant. 2007;22(2):417–423. doi:10.1093/ndt/gfl603
12. Naghibi M, Mojahedi MJ, Jarrahi L, et al. Prevalence of chronic kidney disease and its risk factors in Gonabad, Iran. Iran J Kidney Dis. 2015;9(6):449.
13. 2018 Statistics Bulletin, Statistics Department, Ministry of Interior. Available from: https://www.moi.gov.tw/stat/news_detail.aspx?sn=13742.
14. Aging timeline in 2019, Taiwan population estimate, National Development Council. Available from: https://www.ndc.gov.tw/Content_List.aspx?n=695E69E28C6AC7F3.
15. Levey AS, Coresh J, Bolton K, et al. K/DOQI clinical practice guidelines for chronic kidney disease: evaluation, classification, and stratification. Am J Kidney Dis. 2002;39(2 SUPPL. 1):i–ii.
16. Kellum JA, Lameire N, Aspelin P, et al. Kidney disease: improving global outcomes (KDIGO) acute kidney injury work group. KDIGO clinical practice guideline for acute kidney injury. Kidney Int Suppl. 2012;2(1):1–138.
17. Liang Y. Analysis of the prevalence rate and correlative risk factors of chronic kidney disease in physical checkups of adults in Henan area. Asia Pac J Public Health. 2013;25(4_suppl):15S–21S. doi:10.1177/1010539513495270
18. Brown WW, Peters RM, Ohmit SE, et al. Early detection of kidney disease in community settings: the Kidney Early Evaluation Program (KEEP). Am J Kidney Dis. 2003;42(1):22–35. doi:10.1016/S0272-6386(03)00405-0
19. Coresh J, Astor BC, Greene T, Eknoyan G, Levey AS. Prevalence of chronic kidney disease and decreased kidney function in the adult US population: Third National Health and Nutrition Examination Survey. Am J Kidney Dis. 2003;41(1):1–12. doi:10.1053/ajkd.2003.50007
20. Chadban SJ, Briganti EM, Kerr PG, et al. Prevalence of kidney damage in Australian adults: the AusDiab kidney study. J Am Soc Nephrol. 2003;14(suppl 2):S131–S138. doi:10.1097/01.ASN.0000070152.11927.4A
21. Boulware LE, Jaar BG, Tarver-Carr ME, Brancati FL, Powe NR. Screening for proteinuria in US adults: a cost-effectiveness analysis. JAMA. 2003;290(23):3101–3114. doi:10.1001/jama.290.23.3101
22. Eriksen B, Ingebretsen O. The progression of chronic kidney disease: a 10-year population-based study of the effects of gender and age. Kidney Int. 2006;69(2):375–382. doi:10.1038/sj.ki.5000058
23. Kazancioğlu R. Risk factors for chronic kidney disease: an update. Kidney Int Suppl. 2013;3(4):368–371. doi:10.1038/kisup.2013.79
24. Wang Y, Sun B, Sheng LT, et al. Association between weight status, metabolic syndrome and chronic kidney disease among middle-aged and elderly Chinese. Nutr Metab Cardiovasc Dis. 2020;30(11):2017–2026. doi:10.1016/j.numecd.2020.06.025
25. Khalilia M, Chakraborty S, Popescu M. Predicting disease risks from highly imbalanced data using random forest. BMC Med Inform Decis Mak. 2011;11(1):51. doi:10.1186/1472-6947-11-51
26. Tabaei BP, Herman WH. A multivariate logistic regression equation to screen for diabetes: development and validation. Diabetes Care. 2002;25(11):1999–2003. doi:10.2337/diacare.25.11.1999
27. Jen CH, Wang CC, Jiang BC, Chu YH, Chen MS. Application of classification techniques on development an early-warning system for chronic illnesses. Expert Syst Appl. 2012;39(10):8852–8858. doi:10.1016/j.eswa.2012.02.004
28. Ushida Y, Kato R, Niwa K, et al. Combinational risk factors of metabolic syndrome identified by fuzzy neural network analysis of health-check data. BMC Med Inform Decis Mak. 2012;12(1):80. doi:10.1186/1472-6947-12-80
29. Chen MS, Chen SH. A data-driven assessment of the metabolic syndrome criteria for adult health management in Taiwan. Int J Environ Res Public Health. 2019;16(1):92. doi:10.3390/ijerph16010092
30. Lemieux I, Poirier P, Bergeron J, et al. Hypertriglyceridemic waist: a useful screening phenotype in preventive cardiology? Can J Cardiol. 2007;23:23B–31B. doi:10.1016/S0828-282X(07)71007-3
31. Worachartcheewan A, Nantasenamat C, Isarankura-Na-Ayudhya C, Pidetcha P, Prachayasittikul V. Identification of metabolic syndrome using decision tree analysis. Diabetes Res Clin Pract. 2010;90(1):e15–e18. doi:10.1016/j.diabres.2010.06.009
32. Arsanjani R, Dey D, Khachatryan T, et al. Prediction of revascularization after myocardial perfusion SPECT by machine learning in a large population. J Nucl Cardiol. 2015;22(5):877–884. doi:10.1007/s12350-014-0027-x
33. Emamjomeh A, Goliaei B, Zahiri J, Ebrahimpour R. Predicting protein–protein interactions between human and hepatitis C virus via an ensemble learning method. Mol Biosyst. 2014;10(12):3147–3154. doi:10.1039/C4MB00410H
34. Shi J, Peng Y, Erdem E. Simulation analysis on patient visit efficiency of a typical VA primary care clinic with complex characteristics. Simul Model Pract Theory. 2014;47:165–181. doi:10.1016/j.simpat.2014.06.003
35. Kuo KM, Talley PC, Kuzuya M, Huang CH. Development of a clinical support system for identifying social frailty. Int J Med Inform. 2019;132::103979. doi:10.1016/j.ijmedinf.2019.103979
36. Sufriyana H, Husnayain A, Chen YL, et al. Comparison of multivariable logistic regression and other machine learning algorithms for prognostic prediction studies in pregnancy care: systematic review and meta-analysis. JMIR Med Inform. 2020;8(11):e16503. doi:10.2196/16503
37. Ting WC, Chang HR, Chang CC, Lu CJ. Developing a novel machine learning-based classification scheme for predicting SPCs in colorectal cancer survivors. Appl Sci. 2020;10(4):1355. doi:10.3390/app10041355
38. Wu TE, Chen HA, Jhou MJ, et al. Evaluating the effect of topical atropine use for myopia control on intraocular pressure by using machine learning. J Clin Med. 2021;10(1):111. doi:10.3390/jcm10010111
39. Xiao J, Ding R, Xu X, et al. Comparison and development of machine learning tools in the prediction of chronic kidney disease progression. J Transl Med. 2019;17(1):119. doi:10.1186/s12967-019-1860-0
40. Qin J, Chen L, Liu Y, et al. A machine learning methodology for diagnosing chronic kidney disease. IEEE Access. 2019;8:20991–21002. doi:10.1109/ACCESS.2019.2963053
41. Khan B, Naseem R, Muhammad F, et al. An empirical evaluation of machine learning techniques for chronic kidney disease prophecy. IEEE Access. 2020;8:55012–55022. doi:10.1109/ACCESS.2020.2981689
42. Hebbali A. Blorr: tools for developing binary logistic regression models. R package version 0.3.0. Available from: https://www.rdocumentation.org/packages/blorr.
43. Mehta S, Shukla D. Optimization of C5. 0 classifier using Bayesian theory.
44. Kuhn M. C5.0: C5.0 decision trees and rule-based models. R package version 0.1.3.1. Available from: https://www.rdocumentation.org/packages/C50/versions/0.1.3.1.
45. Perez-Martin A, Perez-Torregrosa A, Vaca-Lamata M, Verdu-Jover AJ. Optim classifier: create the best train for classification models. R package version 0.1.5. Available from: https://www.rdocumentation.org/packages/OptimClassifier.
46. Svetnik V, Wang T, Tong C, Liaw A, Sheridan RP, Song Q. Boosting: an ensemble learning tool for compound classification and QSAR modeling. J Chem Inf Model. 2005;45(3):786–799. doi:10.1021/ci0500379
47. Brandon G, Bradley B, Jay C. gbm: generalized boosted regression models. R package version 2.1.8. Available from: https://www.rdocumentation.org/packages/gbm/versions/2.1.8.
48. Friedman JH. Multivariate adaptive regression splines. Ann Stat. 1991;19:1–67.
49. Stephen M. Mars: multivariate adaptive regression splines. R package version 5.3.0. Available from: https://www.rdocumentation.org/packages/earth/versions/5.3.0.
50. Chen T, Guestrin C. Xgboost: a scalable tree boosting system.
51. Chen T, He T, Benesty M, Khotilovich V, Tang Y. XGboost: extreme gradient boosting. R package version 0.90.0.2. Available from: https://www.rdocumentation.org/packages/XGboost.
52. Kuhn M, Wing J, Weston S, et al. caret: classification and regression training. R package version 6.0-84. Available from: https://www.rdocumentation.org/packages/caret.
53. Matsushita K, Mahmoodi BK, Woodward M, et al. Comparison of risk prediction using the CKD-EPI equation and the MDRD study equation for estimated glomerular filtration rate. JAMA. 2012;307(18):1941–1951. doi:10.1001/jama.2012.3954
54. Lewis SL, Bucher L, Heitkemper MM, Harding MM, Kwong J, Roberts D. Medical-Surgical Nursing-E-Book: Assessment and Management of Clinical Problems, Single Volume. Elsevier Health Sciences; 2016.
55. Chang HJ, Lin KR, Lin MT, Chang JL. Association between lifestyle factors and decreased kidney function in older adults: a community-based cross-sectional analysis of the Taipei City elderly health examination database. BMC Nephrol. 2020;21:1–10. doi:10.1186/s12882-020-01838-1
56. Shoham DA, Vupputuri S, Roux AVD, et al. Kidney disease in life-course socioeconomic context: the Atherosclerosis Risk in Communities (ARIC) Study. Am J Kidney Dis. 2007;49(2):217–226. doi:10.1053/j.ajkd.2006.11.031
 © 2021 The Author(s). This work is published and licensed by Dove Medical Press Limited. The
full terms of this license are available at https://www.dovepress.com/terms
and incorporate the Creative Commons Attribution
- Non Commercial (unported, 3.0) License.
By accessing the work you hereby accept the Terms. Non-commercial uses of the work are permitted
without any further permission from Dove Medical Press Limited, provided the work is properly
attributed. For permission for commercial use of this work, please see paragraphs 4.2 and 5 of our Terms.
© 2021 The Author(s). This work is published and licensed by Dove Medical Press Limited. The
full terms of this license are available at https://www.dovepress.com/terms
and incorporate the Creative Commons Attribution
- Non Commercial (unported, 3.0) License.
By accessing the work you hereby accept the Terms. Non-commercial uses of the work are permitted
without any further permission from Dove Medical Press Limited, provided the work is properly
attributed. For permission for commercial use of this work, please see paragraphs 4.2 and 5 of our Terms.