Back to Journals » Clinical Interventions in Aging » Volume 14
Habitual sugar intake and cognitive impairment among multi-ethnic Malaysian older adults
Authors Chong CP, Shahar S, Haron H ![]() , Din NC
, Din NC ![]()
Received 8 April 2019
Accepted for publication 21 June 2019
Published 22 July 2019 Volume 2019:14 Pages 1331—1342
DOI https://doi.org/10.2147/CIA.S211534
Checked for plagiarism Yes
Review by Single anonymous peer review
Peer reviewer comments 2
Editor who approved publication: Dr Richard Walker
CP Chong,1 S Shahar,1 H Haron,1 N Che Din2
1Centre for Healthy Aging and Wellness, Faculty of Health Sciences, Universiti Kebangsaan Malaysia, Jalan Pahang, Kuala Lumpur, Malaysia; 2Psychology Program, Faculty of Health Sciences, Universiti Kebangsaan Malaysia, Jalan Pahang, Kuala Lumpur, Malaysia
Background: Sugar is widely consumed in Malaysia, and the excessive intake of sugar has been associated with cognitive functions. However, the association between sugar intake and cognitive impairment among Malaysian older adults is yet to be determined.
Purpose: The objective of this study was to evaluate the associations between types and sources of sugar intake and cognitive functions and to identify their risk in predicting cognitive impairment (MMSE score <24).
Subjects and methods: A total of 1,209 subjects aged ≥60 years were recruited through multi-stage random sampling from selected states in Malaysia. Dietary intake was derived using a 7-day dietary history questionnaire and supplemented with a quantitative food frequency questionnaire for added sugar intake.
Results: The prevalence of cognitive impairment as defined by Mini-Mental State Examination (MMSE) less than 24 was 31.9%, while the prevalence of mild cognitiveimpairment was 13.1%. The median (IQR) for total sugar intake was 44.60 g/day (26.21–68.81) or 8 tsp, and free sugar intake was 33.08 g/day (17.48–57.26) or 6 tsp. The higher intake of total sugars, free sugars, sucrose, lactose, sugar-sweetened beverages, sugar-sweetened cakes, and dessert was found to be significantly associated with a lower MMSE score, after adjusting for covariates. On the other hand, the consumption of cooked dishes and fruits was significantly associated with a better MMSE score. The adjusted OR for risk of cognitive impairment (MMSE score <24) was 3.30 (95% CI 2.15–5.08) for total sugars and 3.58 (95% CI 2.32–5.52) for free sugars, comparing the highest with the lowest intake percentiles.
Conclusion: Excessive sugar consumption among older adults showed a notable association with poor cognitive functions, but longitudinal studies and clinical trials are further needed to clarify the direction of causality and to investigate the underlying mechanism.
Keywords: sugar intake, free sugar, sucrose, cognitive functions, older adults
Background
Sugar, in the form of glucose, is the primary energy source for cognitive functions. However, excessive sugar consumption may lead to impaired memory, and link to an increased risk of dementia.1 WHO (2015) recommended “free sugar” intake of 25 g per day for an adult of normal BMI and the Malaysia dietary recommendation suggested intake of <10% of the total calories from total sugar.2 Nevertheless, the Food Balance Sheets showed that the amount of available sugar (kg per capita per year) has risen by 91% from 22.51 kg in 1963 to 42.96 kg in 2013. At this level, Malaysia ranks among the topmost countries in Asia concerning the availability of sugar.3 This dietary pattern that involves the rapid escalation of the availability of sugar is quite alarming, as it is related to an increase in the prevalence of obesity and type 2 diabetes.4,5
Sugar intake has also been linked with high blood glucose,4 high blood pressure,6 dyslipidemia,7 and a constellation of these metabolic risk factors, ie, the metabolic syndrome.8 Metabolic syndrome has been linked with cognitive impairment and type 2 diabetes is also considered to be a significant risk factor for impaired cognitive function. However, the effect of sugar consumption on cognitive health continues to be a controversial topic.
Data from animal studies have suggested that sugar intake might play a role in cognitive impairment. Studies have examined the effect of sugary diets on spatial learning and memory in the Morris Water Maze found that feeding rats with sugar solution (notable sucrose) showed impaired spatial learning and memory,9–12 while fructose-fed rats showed poorer long-term spatial memory with peripheral metabolic dysfunction (elevated serum glucose, insulin, and triglycerides).13 Accordingly, the results from animal studies provide strong evidence that sugar impairs spatial memory via damage to the hippocampus, a region known to be integral to spatial learning and memory.14
The limited human studies investigating high sugar intake also concurred that sugar consumption could have a significant impact on one’s cognitive abilities. A population-based study among Puerto-Ricans aged between 45 and 75 years old found that total sugars, added sugars, sucrose, glucose, added fructose, and sugar-sweetened beverages were each significantly inversely associated with cognitive function as assessed using Mini-Mental State Examination (MMSE).15 Additionally, in a dietary pattern study, Gustaw–Rothenberg investigated the dietary pattern of Alzheimer’s disease (AD) patients characterized as having a high intake of meat, butter, high-fat dairy products, eggs, and refined sugar as compared to the control.16 Similarly, Power et al, in a community-dwelling of an elderly Irish cohort found that the consumption of a high glycaemic diet was associated with impaired cognitive performance as assessed by the MMSE.17 Recently, a double-blind, placebo-controlled, cross-over experimental study was undertaken suggesting that the ingestion of glucose and sucrose led to lower performance of cognitive tasks, ie, simple response time, arithmetic, and Stroop interference.18 Most studies used a single test to determine the cognitive functions. Thus, the present study was conducted to determine the association between sugar intake and cognitive functions as measured by a series of cognitive tests ie digit span, Rey’s auditory verbal learning test (RAVLT), MMSE, Montreal Cognitive Assessment (MoCA), digit symbol, and visual-reproduction test (VR) among multi-ethnic Malaysian older adults.
Methods
Study design and participants
As a cross-sectional study, this was the third phase of a large-scale population-based study among older adults in Malaysia (LRGS TUA)19 involving individuals recruited from four states, ie, Johor, Perak, Kelantan, and Selangor. Briefly, data collection was carried out between March and September 2016. Inclusion criteria included individuals aged 60 years or older and who were able to communicate well either in Malay or English language with no known mental and terminal illness. The sampling frame for LRGS-TUA study was according to the National Population and Housing Census 2010. The multi-stage random sampling procedure was conducted in order to recruit the subjects. Specified areas were chosen for the study if the population of these locations comprised of at least 10% of older adults.19
The subjects were recruited through employing a house to house scouting procedure one week before the actual data collection commenced at the respective community centers. A total of 1,560 older adults participated in the interview process. After excluding participants having a low MMSE score (<15), cleansed data and complete measurements for cognitive tests and dietary sugar intake were available for 1,209 participants at the time of analysis. The present study was conducted according to the guidelines outlined in the Declaration of Helsinki, and all procedures involving human subjects were approved by the Medical Research and Ethics Committee of the University Kebangsaan Malaysia (code: NN-060–2013). Written informed consent was obtained from all participants in this study. During the interview process, data about the socio-demographic status, lifestyle, dietary intake, cognitive function, self-reported diagnosed health conditions, and medication use were collected by trained enumerators in the Malay or native language spoken by the participants.
Assessment of habitual food consumption
A dietary history questionnaire (DHQ) was used to quantify the habitual dietary intake for the past week.20 All subjects were interviewed to collect information about each meal, ie, breakfast, morning tea, lunch, afternoon tea, dinner, and supper. The portion sizes consumed by the individual were also recorded as an indication based on the household measurement and the use of pictures from the Food Exchanges and Portion Sizes Atlas in order to quantify the total nutrient intake and sugar intake of the participant. A trained researcher conducted the interviews with a degree in dietetic, given it required skills to extract precise information. Besides, the food frequency questionnaire (FFQ)21 was also used as a checklist to complete the high sugary food consumption data and to identify missing details of other sources of daily sugar intake. The nutrient intake information was calculated using the Nutritionist Pro software (Axxya System, USA).
Sugar intake was quantified from the DHQ using the database developed in Phase I of this study,22 together with the data from the USDA food composition table,23 Singapore food composition table,24 and several local studies.25–27 The intake of total sugar, free sugar, sugar from sweetened beverages, sugar from processed foods, sugar from cooked dishes, sugar from fruits, total fructose, total glucose, total glucose, total maltose, and total lactose was then calculated. Total sugar was defined as the sum of two free monosaccharides (glucose, fructose) and three free disaccharides (sucrose, lactose, and maltose). Free sugar was defined as all monosaccharides, and disaccharides added to foods by the manufacturer, cook, or consumer, plus sugars naturally present in honey, syrups, and fruit juices.28 In the current study, free sugar was calculated using the following formula:
[(total sugar (grams) – natural sugar from fruit and milk (grams)]
Assessment of cognitive function
Six cognitive tests including digit span, RAVLT, MMSE, MoCA, digit symbol, and VR were administered to each participant by a qualified enumerator. Briefly, the MMSE and MoCA were administered to assess general cognitive function.29,30 Digit span was used to assess attention and working memory;31 RAVLT was used to assess verbal memory, with subscores including immediate and delayed recall;32 digit symbols were used to assess processing speed;31 and a VR was used to assess visual memory, with a sub-score for both immediate and delayed recall.33 Higher scores on each of these six tests signified better performance in cognitive function. In the present study, the MMSE scores were used as the primary outcome because it reflects the general cognitive function. Nevertheless, this study also reported the relationship between each type of sugar and each test. Furthermore, the participants were categorized into three aging groups, ie successful aging (SA),34,35 usual aging (UA)36, and mild cognitive impairment (MCI)37,38 to determine the differences in sugar intake between each aging category.
Statistical analyses
The Statistical Package for Social Sciences (SPSS) version 22.0 was used to analyze the data in this study. A value of p<0.05 (two-sided) was considered statistically significant. Descriptive data were used to obtain frequency and the percentage of socio-demographic data, anthropometric data, sugar intake, and cognitive assessment. Normality test was performed using the Shapiro–Wilk test. Data which were not normally distributed were presented as median (IQR). The various sugar intakes were further divided into four percentiles, namely, 25th percentile, 50th percentile, 75th percentile, and 100th percentiles. One-way ANOVA test or Kruskal–Wallis test was performed to identify the significant differences between two or more than two groups of independent variables. The chi-square test was used to identify significant differences for two categorical data, and ANCOVA was used to calculate the means of cognitive scores by the percentile of sugar consumption, after controlling for age, gender, educational years, BMI, daily calorie intake, marital status, smoking status, alcohol consumption status, physical activity, and geriatric depression scale. The means scores were then compared with Tukey’s adjustment for multiple comparisons. Also, binary logistic regression models were employed to estimate OR for cognitive impairment defined by the traditional cut-off point of 24 of the MMSE score (MMSE score <24) in the 100th percentile relative to the 25th percentile of total and free sugar intake, respectively.
Results
Socio-demographic characteristic and the prevalence of SA, UA, and MCI
The prevalence of SA, UA, and MCI in the current study involving 1,209 community-dwelling older adults from four states of Peninsular Malaysia was 15.9%, 71.1%, and 13.1%, respectively (Figure 1). Older men showed a higher prevalence of SA (17.2% vs 14.5%) and MCI (14.4% vs 11.7%) but a lower prevalence of UA (68.4% vs 73.7%). However, there were no gender differences in the prevalence as assessed by the chi-square analysis (p>0.5).
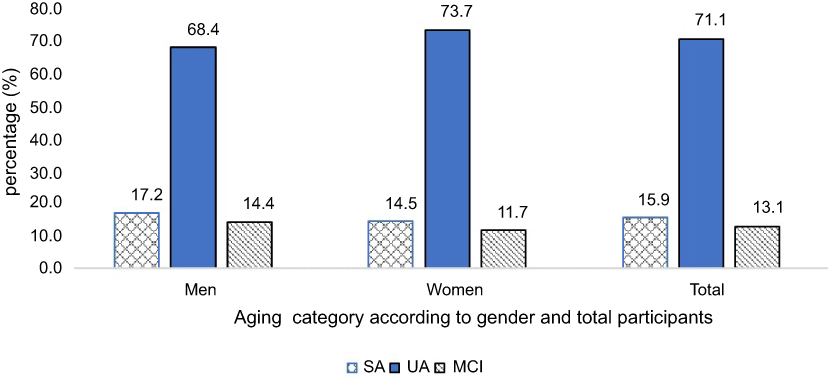 |
Figure 1 Prevalence of SA, UA, and MCI according to total population and gender. p>0.1 for chi-square analysis of the association between gender and cognitive status. Abbreviations: SA, successful aging; UA, usual aging; MCI, mild cognitive impairment. |
The mean age of the subjects in this study was 68.1±5.6 years old and, those in the SA group were the youngest (66.5±4.9 years old) as compared to UA (68.7±5.8 years old) and MCI (69.7±4.7 years old) (Table 1). Both genders in this study were equally distributed comprising of 604 men and 605 women. The ethnic distribution of the study subjects was Malay (63.8%) followed by Chinese (35.1%) and Indian (4.6%). Most of the older adults had received a minimum primary school education with mean education years of 5.54±3.94 years, those in the SA group had the highest education years (7.1±3.9) as compared to UA (5.0±3.9) and MCI (6.3±4.2). Besides that, most of the subjects were married (72.1%) and stayed with other family members (88.9%). The habit of smoking was uncommon among the subjects (18.3%), with only 4.2% consuming alcohol. Further, poorer health status was reported by subjects in the UA category reporting the highest prevalence with regard to hypertension (82.5%), diabetes mellitus (79.0%), hyperlipidaemia (74.2%), osteoarthritis (71.9%), cardiovascular diseases (79.2%), cataracts (81.6%), and constipation (78.3%) (p<0.01 for all parameters).
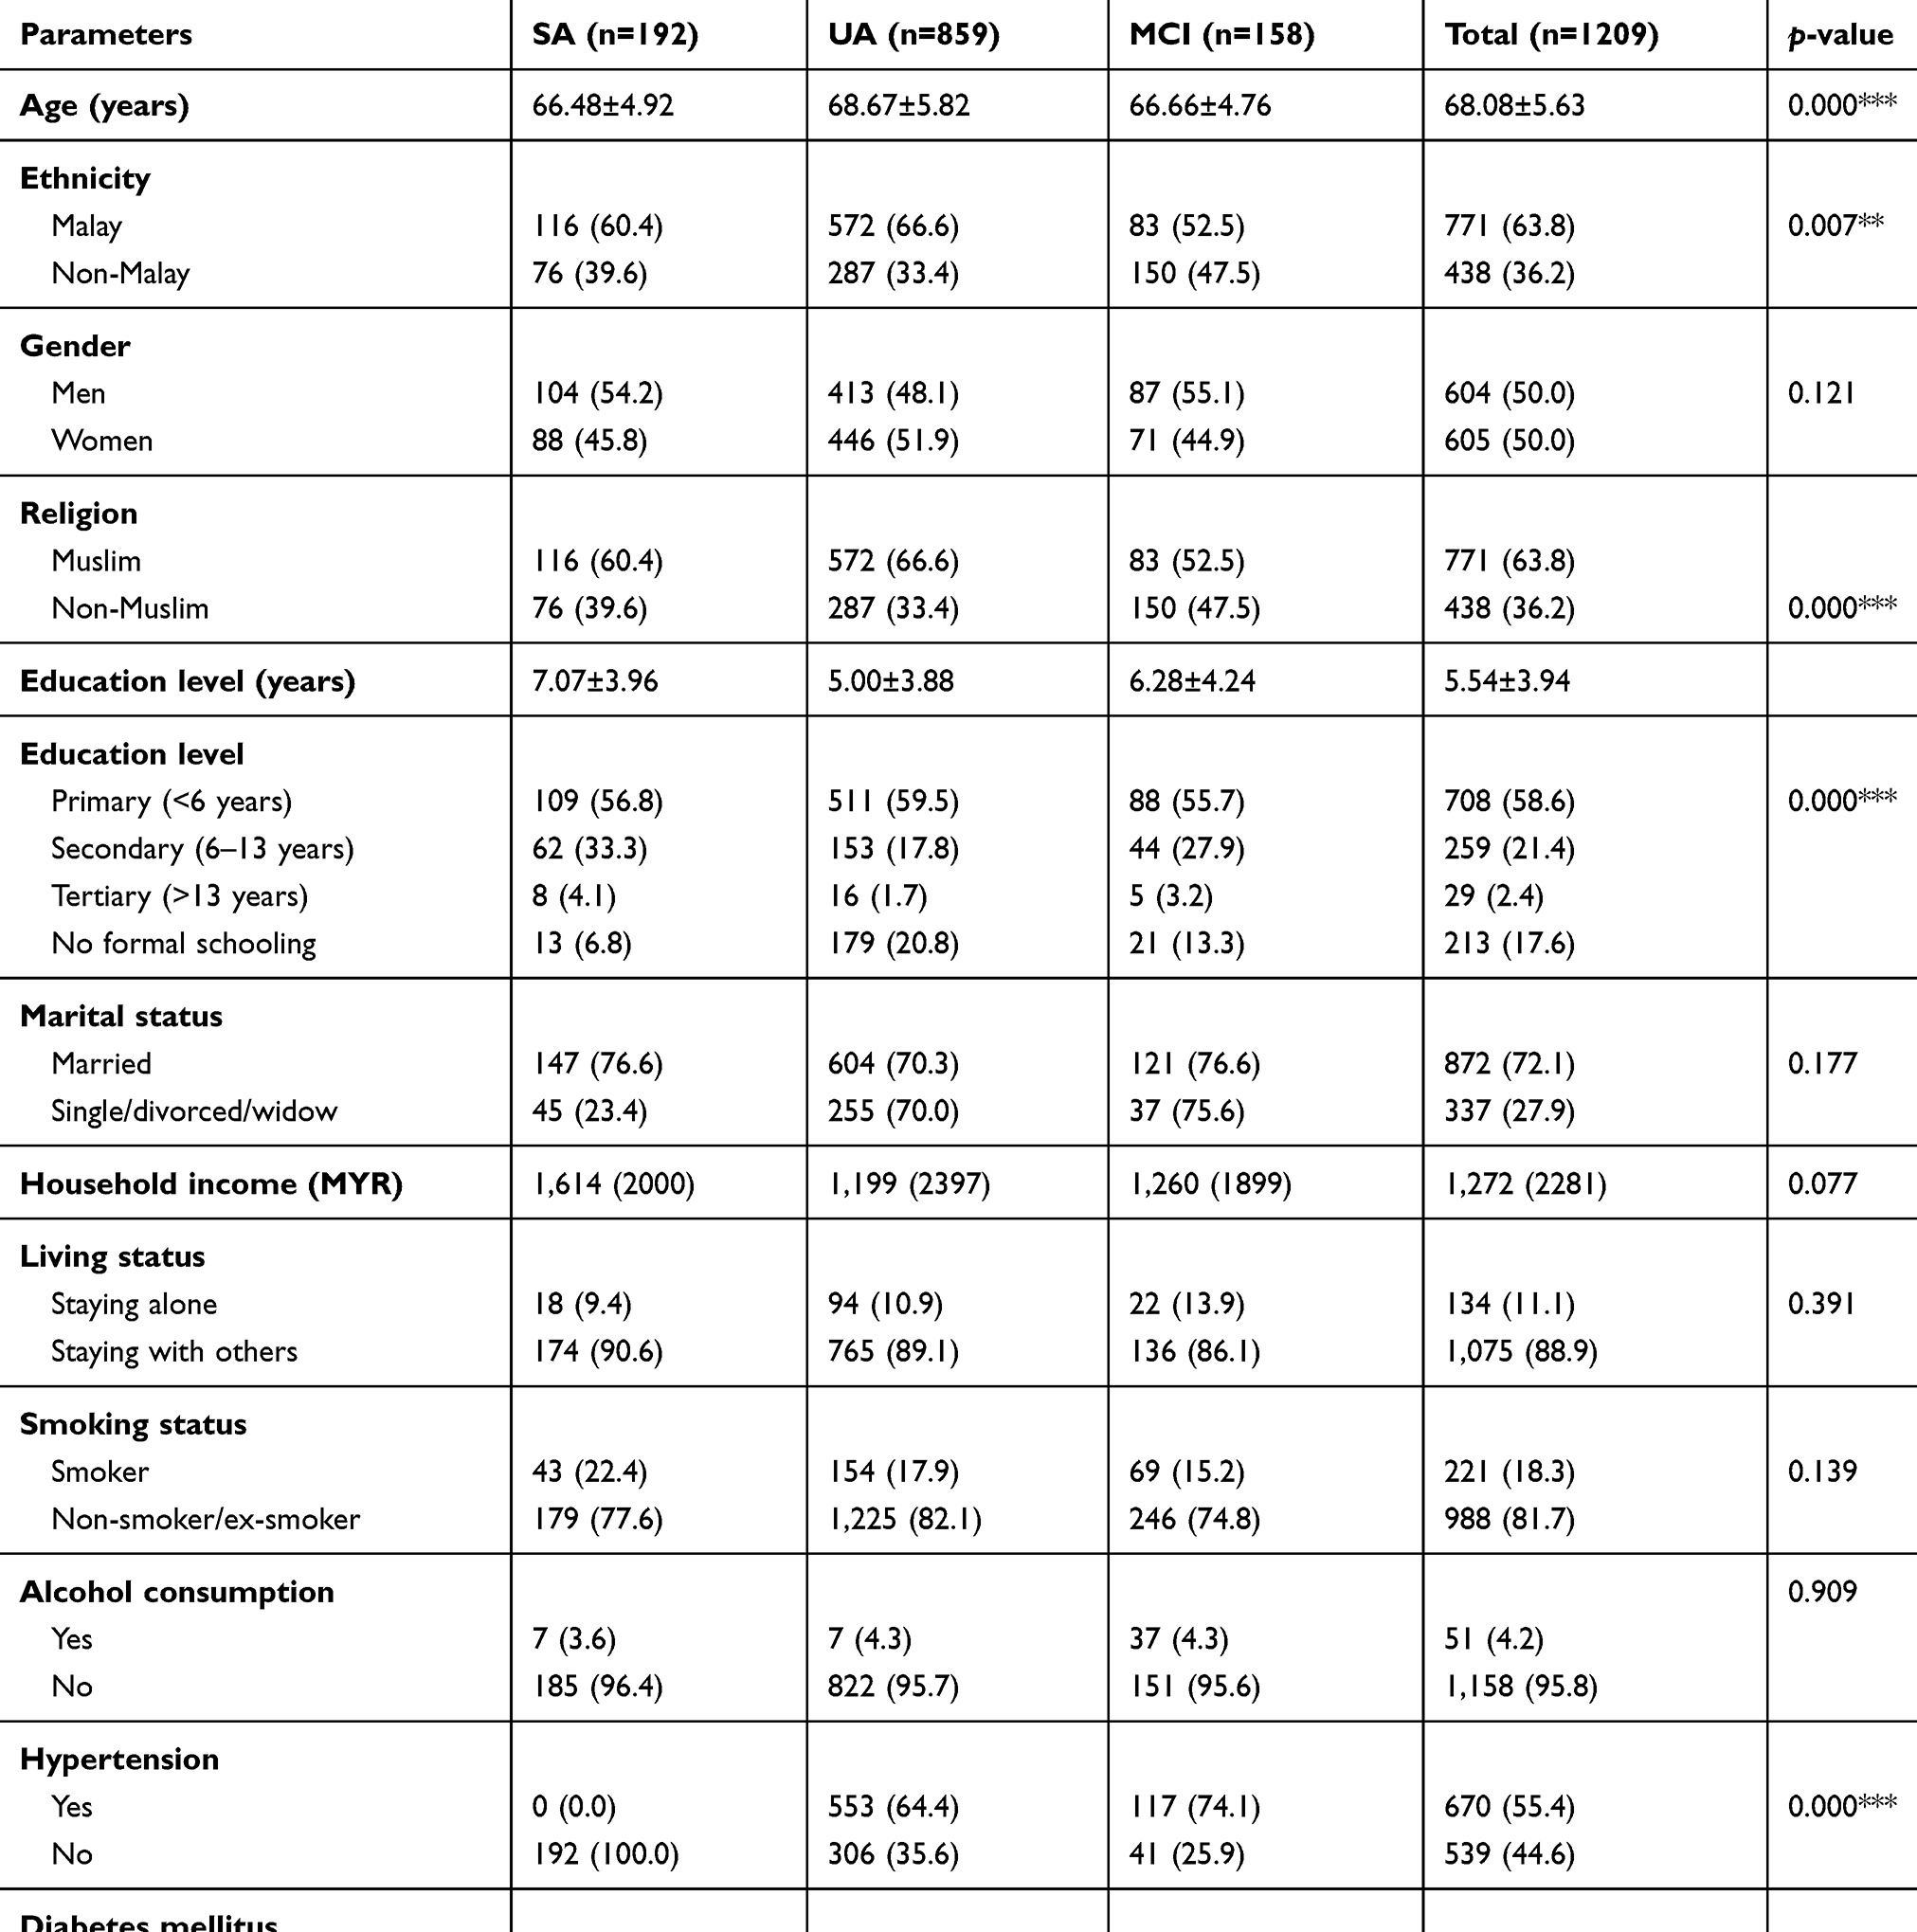 |
Table 1 Socio-demography characteristic and self-reported medical history of subjects |
Sugar intake among three aging categories
Table 2 presents the various sugar intake among the older adults according to the three aging categories: SA, UA, and MCI. Data were presented as median (interquartile range). The median for total sugar intake was 44.60 g per day (IQR 26.21-68.81), while the free sugar intake was 33.08 g per day (IQR 17.48-57.26). The sugar intake was mainly from sucrose (29.67 g/day) followed by glucose (3.16 g/day), fructose (3.12 g/day), maltose (1.41 g/day), and lactose (0.93 g/day). Total sugar intake contributed 11.51% to the total calorie intake while free sugar intake contributed 8.53%. Sugar-sweetened beverages were the main contributor to total sugar followed by fruits, cakes, and dessert, processed foods and cooked dishes. Older adults in the MCI group had significant higher fructose intake compared to those in SA (p<0.01), and significant higher glucose intake compared to UA (p<0.05). In terms of the source of sugar, participants in the MCI group had a significantly higher intake of sugar from cooked dishes (p<0.001) as compared to those in the SA and UA groups. Adversely, the MCI group noticeably took a significantly lower intake of sugar from fruits (p<0.05).
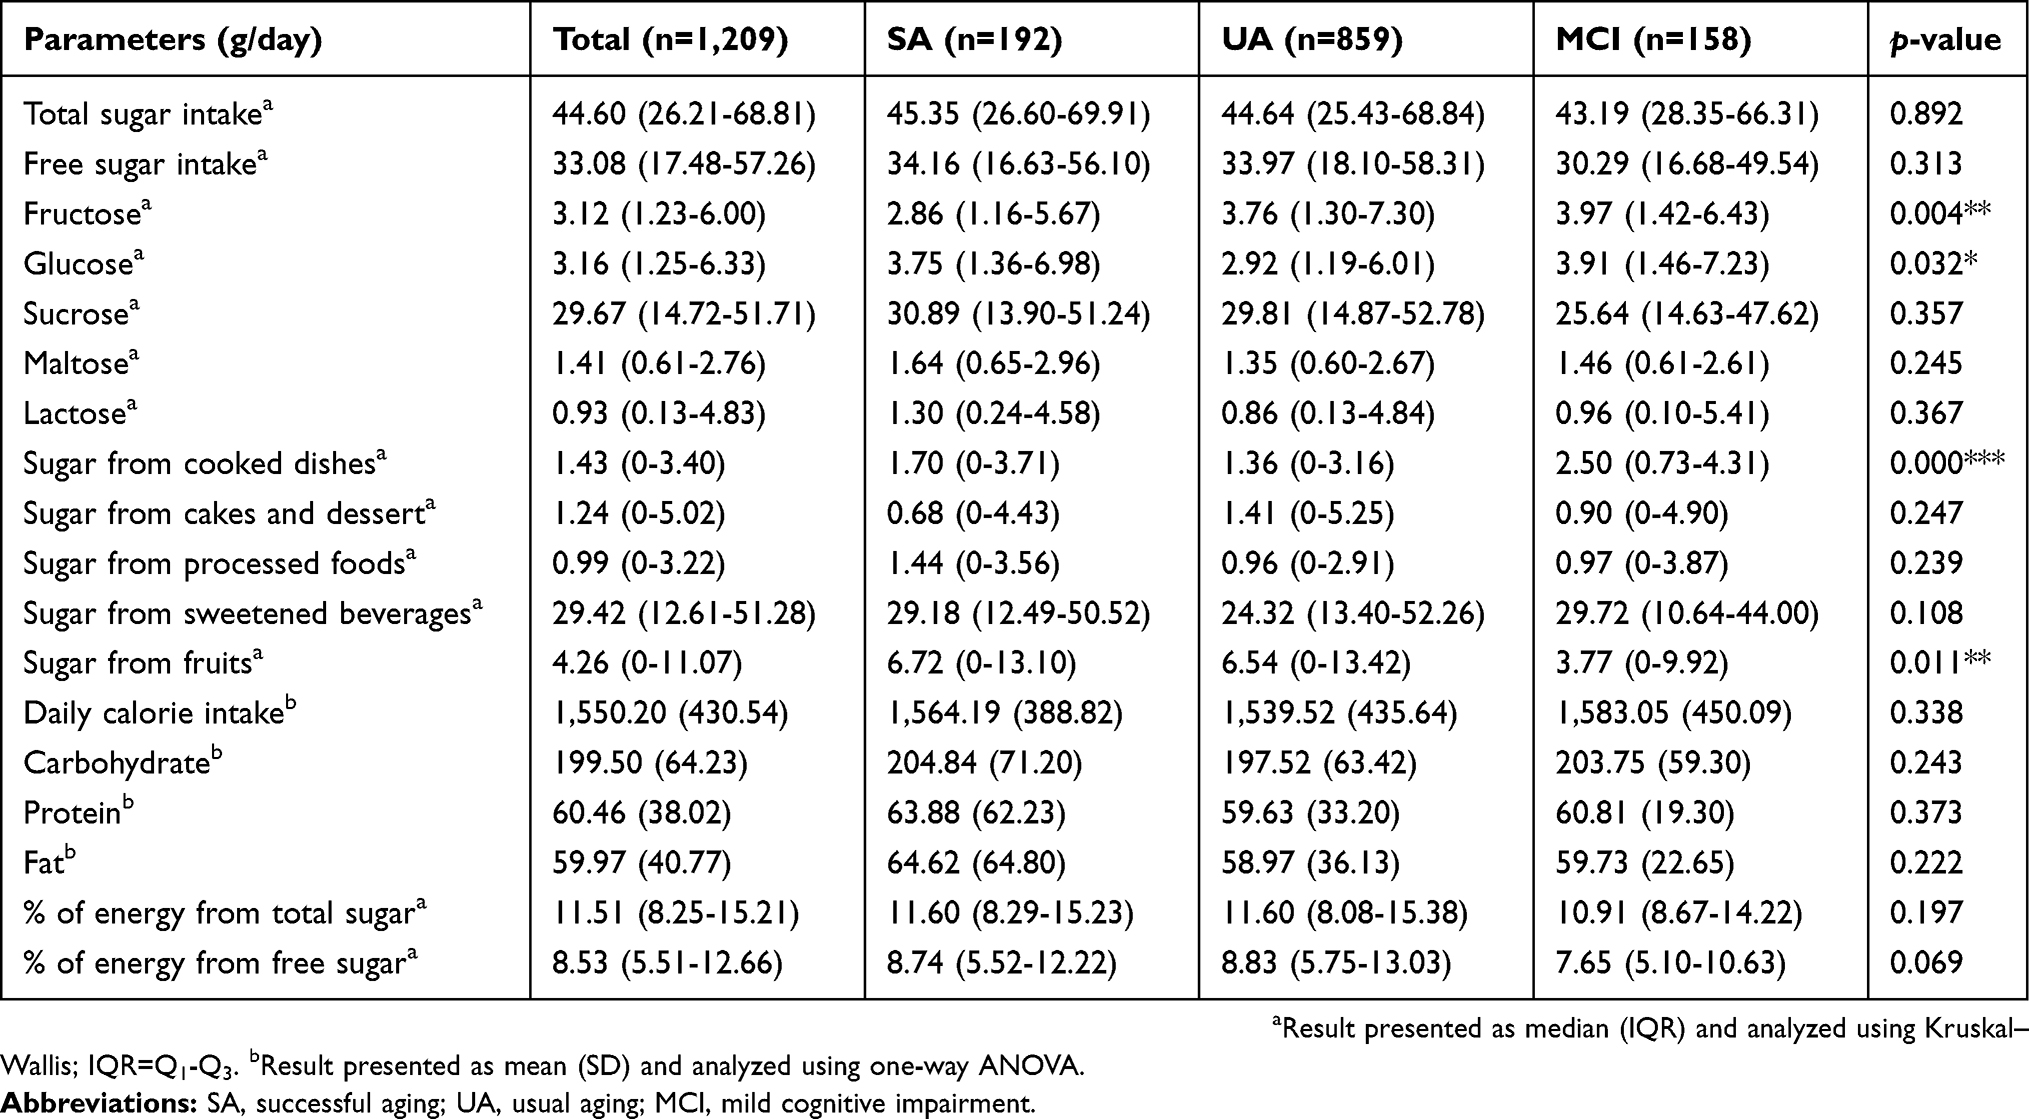 |
Table 2 Types of sugar intake and aging category |
Total sugar intake and cognitive functions
Nevertheless, the results from ordinal logistic regression indicated that there were no significant differences in the intake of total sugar, free sugar, and various types of sugar among the three aging categories excepted for sugar from cooked dishes (data not presented). Thus, further analysis was conducted using the percentile of sugar intake and a series of neurocognitive test. Table 3 presents the relationship between total sugar intake (in percentile) and cognitive functions. The scores of MMSE were found to be lowest in the highest percentile of total sugar intake as compared to another percentile. A decreasing trend in MMSE score was observed with every increment in the percentile of total sugar intake. Although the score for MoCA was found to be lower in the 100th percentile as compared to the 25th percentile (20.40±5.73 vs 21.50±5.06; p<0.001). There was no significant difference with the 50th percentile and 75th percentile (p>0.05). Similarly, the score of VR-I was found to be lower in the 100th percentile as compared to the 25th percentile (41.26±33.91 vs 48.10±34.22; p=0.006) but not significantly different with the 50th and 75th percentiles (p>0.05) as shown in the post-hoc test.
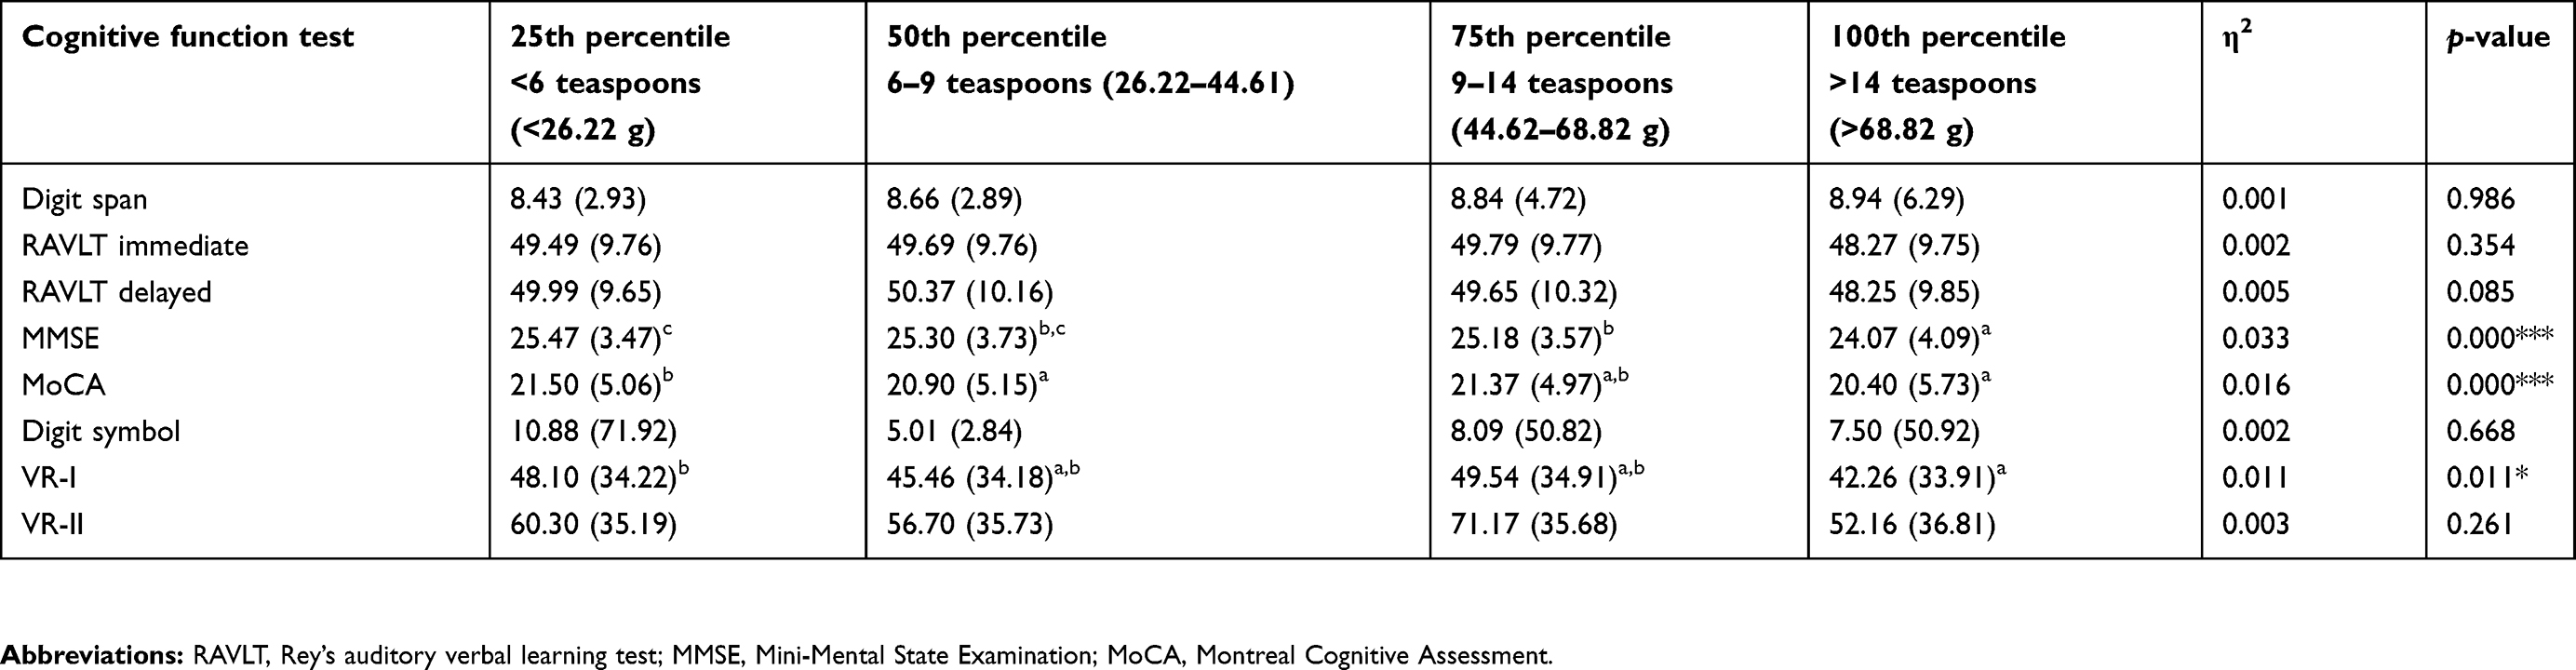 |
Table 3 Mean ± SD cognitive functions tests according to the percentile of total sugar intake |
Free sugar intake and cognitive functions
Table 4 presents the association between free sugar intake (in percentile) and cognitive functions. The score of RAVLT immediate memory, RAVLT delayed memory, MMSE, MoCA, and VR-I was found to be significantly lower with the free sugar intake at the 100th percentile (p<0.05). As for the RAVLT test, an older adult who consumed free sugar of >57.12 g at the 100th percentile had a significantly lower score in both the immediate and delayed memory test, compared to those who took <17.49 g of free sugar in the 25th percentile (p<0.05). In the RAVLT delayed memory test, a similar result was observed between the 100th percentile and 50th percentile (p<0.05). For the global functions, both the MMSE and MoCA score were significantly lower in the 100th percentile as compared to those in the 25th percentile (MMSE: 23.84±4.03 vs 25.87±3.44; MoCA: 19.97±5.54 vs 21.86±5.08). Furthermore, the Tukey post-hoc test showed that both MMSE and MoCA scores in the 100th percentile were also significantly lower compared to those in the 50th and 75th percentiles (p<0.005). Besides, a lower VR-I score was observed in the 100th percentile with the 25th percentile (39.59±34.38 vs 51.98±34.44; p<0.001) and the 75th percentile (39.59±34.38 vs 49.36±34.41; p<0.001) but not with the 50th percentile (p>0.05).
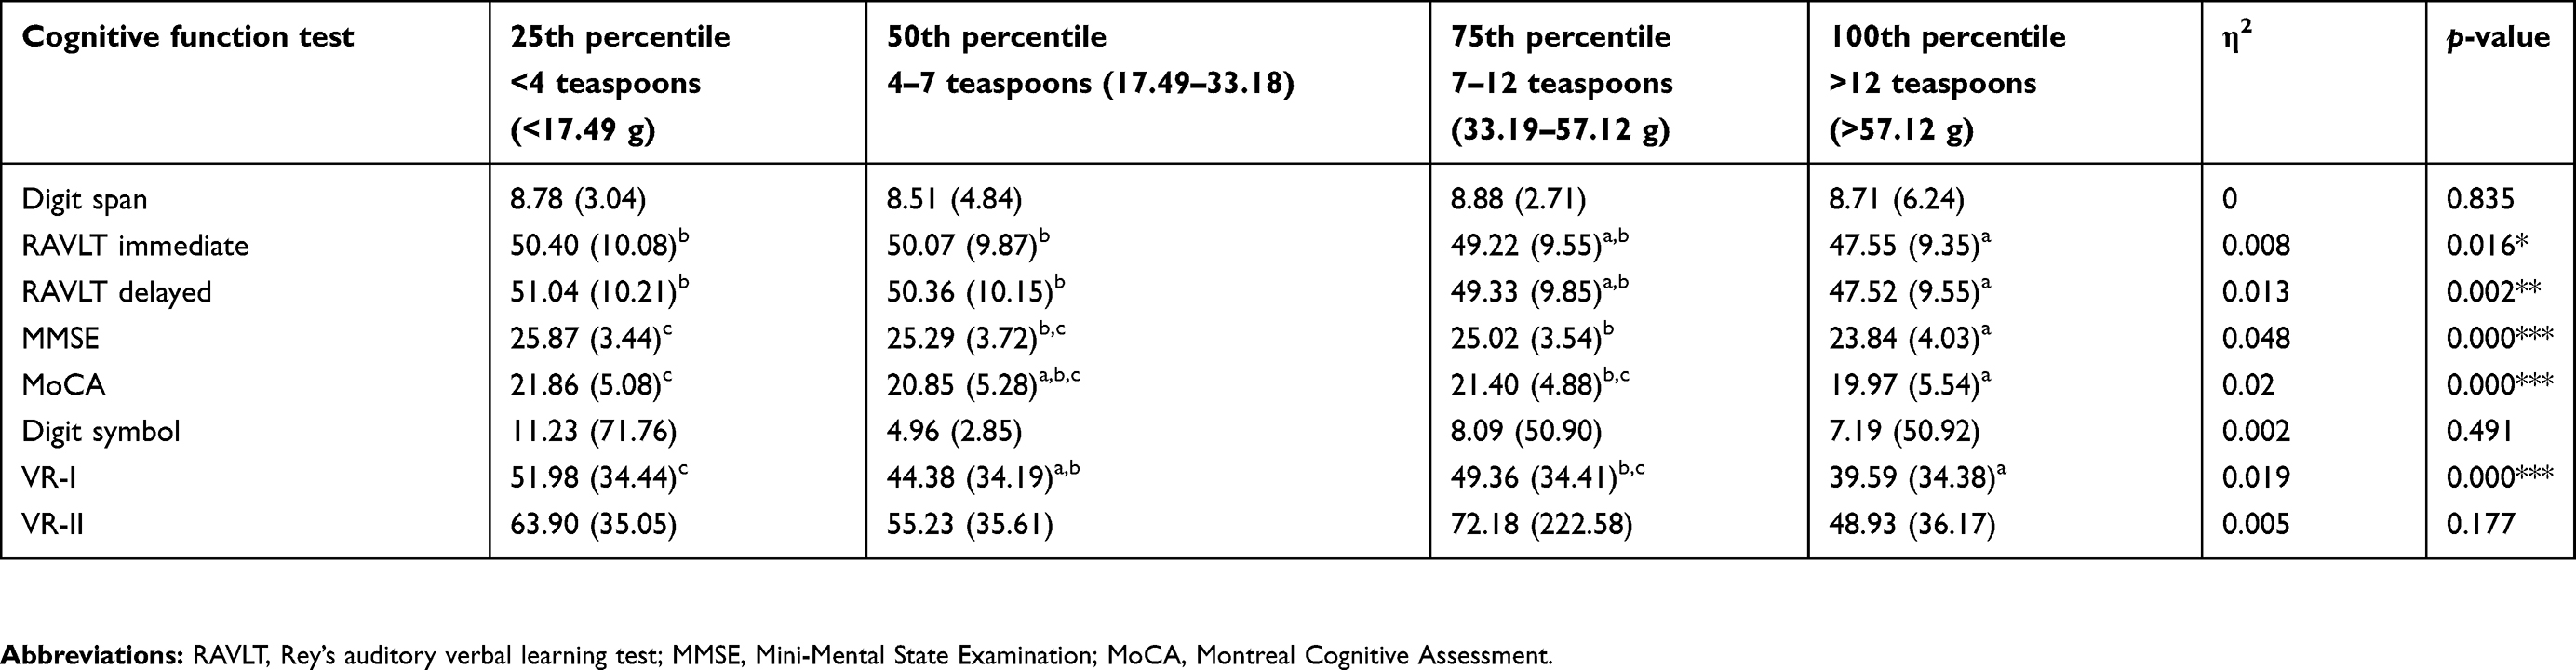 |
Table 4 Mean ± SD cognitive functions tests according to the percentile of free sugar intake |
Risk of sugar intake and cognitive impairment
The results from ANCOVA indicated that the MMSE score was from among the neurocognitive test, which highly correlated with most types of sugar intake (Tables 3 and 4). Thus, further analysis was conducted between sugar intake and cognitive impairment as defined by the MMSE score of less than 24 using binary logistic regression. Table 5 shows that the risk of cognitive impairment (MMSE <24) increased by 3.3 folds for the total sugar intake at the 100th percentile compared to the 25th percentile [adjOR 3.30 (95% CI 2.15–5.08) (p<0.001)]. Similarly, the intake of free sugar at 100th percentile also increased the risk of cognitive impairment by 3.6 folds [adjOR 3.58 (95% CI 2.32–5.52) (p<0.001)]. Among the monosaccharides, both fructose and glucose showed no significant risk for cognitive impairment (MMSE<24). Similar to total sugar and free sugar, the intake of sucrose increased the risk by 3.3 folds at the 100th percentile [adjOR 3.33 (95% CI 2.16–5.15) (p<0.001)]. Interestingly, lactose intake also showed a significantly increased risk in cognitive impairment at the 100th percentile by 1.6 folds [adjOR 1.63 (95% CI 1.09–2.43) (p<0.05)]. Also, the source of sugar showed a significant association with cognitive impairment. Sugar from sugar-sweetened beverages increased the risk by 3.7 folds [adjOR 3.69 (95% CI 2.39–5.71) (p<0.001)], while sugar from cakes and dessert increased the risk by 1.8 folds [adjOR 1.77 (95% CI 1.23–2.55) (p<0.001)].
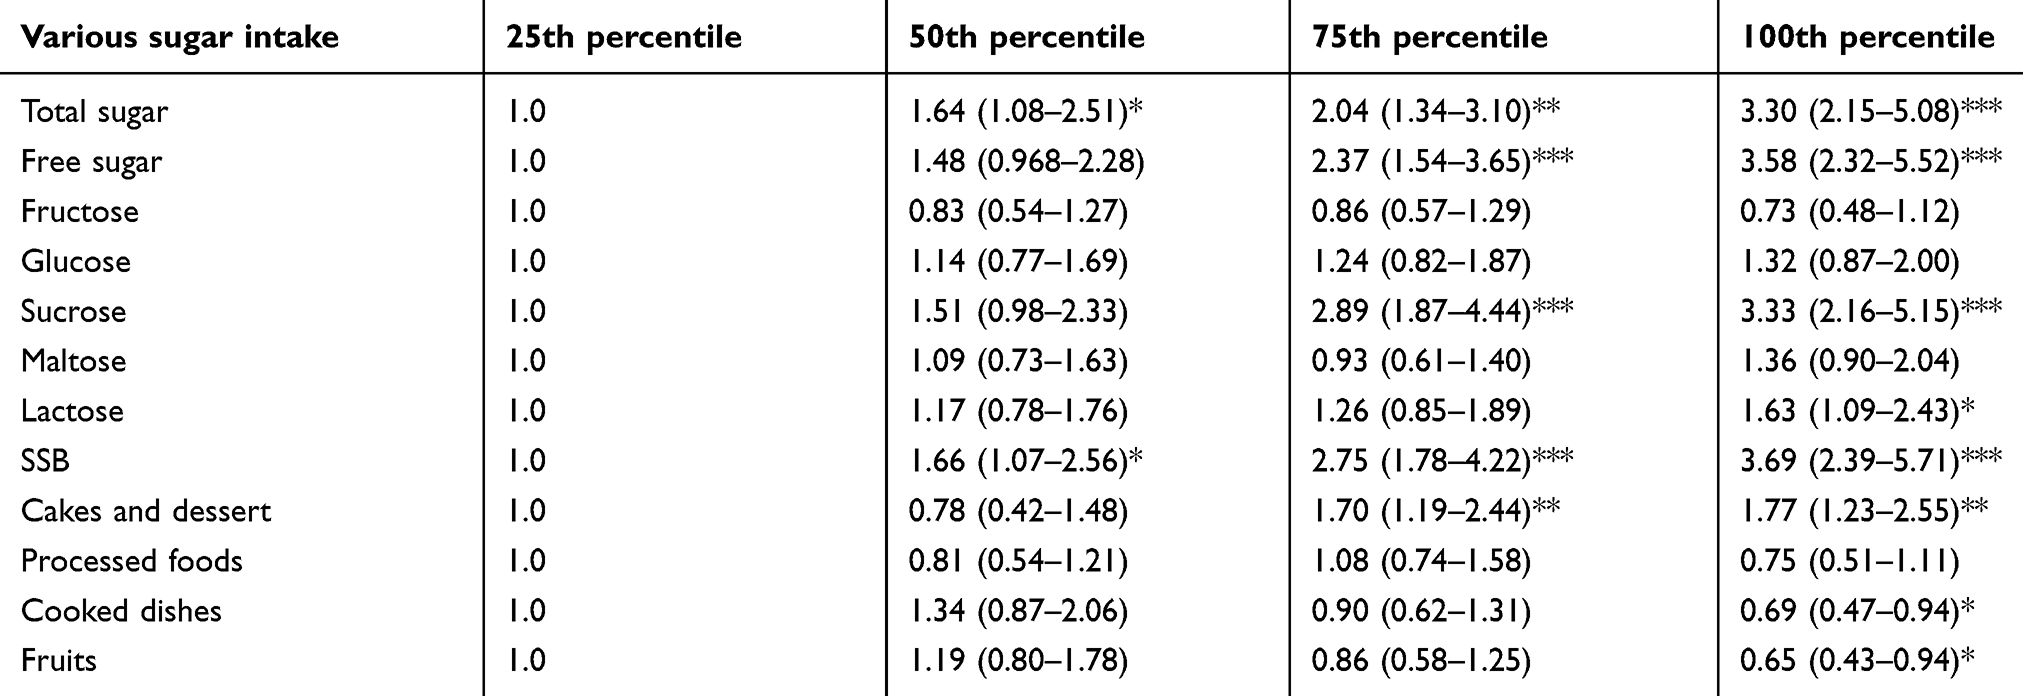 |
Table 5 Multivariate-adjusted OR and 95% CI for cognitive impairment (MMSE <24) according to quintile of various sugar intake |
Discussion
This study successfully estimated the magnitude of sugar consumption and cognitive functions among multi-ethnic Malaysian older adults. The intake of free sugar [median (IQR)] was 33.1 (39.8) or about six teaspoons per day which were similar to the MANS study among Malaysian adults (37 g or 7 tsp)39 but lower compared to a study conducted among older adults out-patients across Indonesia (40.1 g in men and 43.9 g in women).40 The discrepancy occurred given the different age groups and methods in quantifying the sugar intake. Besides, the MANS study used FFQ while the current study combined both the DHQ and FFQ. Free sugar contributed approximately 8.53% of the energy intake, which is less than 10% of the total calorie intake recommended by WHO (2014). The source of free sugar was largely contributed by sugar-sweetened beverages, followed by fruits, cooked dishes, sweetened cakes and desserts, and processed foods. The result was in line with the MANS study where the sugar-containing foods that contributed most to the energy intakes of Malaysian adults were sugar-sweetened beverages (cordial, syrup, tea, coffee, chocolate flavored beverages), condensed milk and local kuih (traditional starchy cakes). Thus, there was no difference in habitual sugar intake found among older adults and adults in Malaysia. This study provided details of sugar intake and the source of sugar intake, specifically among older adults, which has added to the limited data on sugar consumption among older adults in Malaysia and South-east Asia.3,41,42
Additionally, this study found that participants with MCI consumed more fructose and glucose but no other types of sugar. However, it is important to note that the diagnosis of mild cognitive impairment requires further examination, longer surveillance, and clinical evaluation by a physician rather than just based on a single cognitive test.
Further investigation with each cognitive test found that total sugar intake was inversely associated with the MMSE score, MoCA score, and VR. Likewise, higher intake of total sugar (in percentile) was associated with lower global cognition as measured by MMSE and MoCA. Individuals having a total sugar intake more than 68.8 g were more likely to score lower in MMSE and MoCA as compared to those with lower intake. Although there was a significant difference in the VR-I score in the four percentile of total sugar intake, post-hoc analysis indicated there was no significant trend or pattern across the four percentiles. Thus, it is inconclusive to mention that higher sugar intake correlated with visual memory.
Furthermore, as the analysis was scoped down to free sugar, the effect of higher free sugar was not only affecting MMSE, MoCA, and VR-I but also expended to RAVLT immediate and delayed memory. Free sugar intake of more than 57.1 g or 11 teaspoons per day was more likely to score lower in the MMSE, MoCA, RAVLT immediate and delayed memory tests compared to those having lower intake. The results indicated that free sugar was not only affecting global cognition, but also the visual and verbal memory, which involved both the prefrontal and hippocampal area.43
Besides, binary logistic regression indicated that higher total sugar, free sugar, sucrose, and lactose was related to cognitive impairment (MMSE<24) after being adjusted for covariates (age, gender, years of education, BMI, daily calorie intake, marital status, smoking status, alcohol consumption status, physical activity and geriatric depression scale). Nevertheless, there was no apparent effect of fructose, glucose, and maltose on the cognitive functions. As the main contributor of free sugar and total sugar in this study was from sucrose, it can be assumed that sucrose yielded adverse effects on the global cognitive functions as compared to other types of sugar. Interestingly, lactose intake was found inversely associated with a cognitive impairment, which had not been reported elsewhere. Indeed, such result could be due to the source of lactose in this study population which was from sweetened creamer and other sugar-sweetened dairy products.39,44
Concerning the source of sugar, sugar-sweetened beverages, and sugar-sweetened cakes and desserts were found to increase the risk of cognitive impairment (MMSE<24) with adjusted OR of 3.69 (95% CI 2.39–5.71) and 1.77 (95% CI 1.23–2.55), respectively. The results were similar to sucrose and free sugar as these are the primary added sugar found in Malaysian sweetened food and beverages. It is also important to note that sugar from both cooked dishes and fruits related to better cognitive functions. Cooked dishes consist of a small amount of sugar, but it is also a source of protective nutrients for cognitive functions, including complex carbohydrates, protein, fat, vitamins and minerals, therefore, neutralizing the detrimental effect of the sugar. Similarly, fruits containing a natural source of fructose, glucose, and sucrose, are also a source of antioxidants and vitamins that are important for neurocognitive protection.45–47
Notwithstanding, the results of the current study highlighted that the high intake of total sugar, free sugar, and sucrose consumption resulted in lower cognitive performance as supported by previous studies in both humans15,48–51 and animals.12,52–54 On the other hand, sugar from cooked dishes and fruits resulted in better performance as the deleterious effect of sugar could be attenuated by other protective nutrients in both cooked dishes and fruits.
It is possible that high sugar consumption, likely reflecting lifelong habitual intake, may adversely affect cognitive performance through chronic elevations in blood sugar,55,56 insulin resistance,57–59 neuroinflammation,60,61 and oxidative stress responses,62,63 which have been shown to inhibit synaptic plasticity that results with a cognitive deficit. Additionally, it is possible that the development of AGEs, which have been found in AD brains64,65 could have been an underlying process involved in the observed relation between total sugar intake and cognitive deficits.
Sugar intake and cognitive function may also be connected through other mechanisms. The Brain-derived neurotrophic factor (BDNF), which plays a vital role in regulating survival, growth, and maintenance of neurons, may play a role in learning and memory.66 For example, hippocampal samples from AD donors show decreased BDNF expression,67 and individuals with AD have low plasma levels of BDNF.68 Diets high in fat and sugar also reduce BDNF expression, which has been correlated with memory deficits as reported in rats fed with high fat and sucrose diet.69 Whereas, the high intake of fruits could improve the BDNF level, which in turn prevents the cognitive decline.70,71
The present study has several strengths. Analyses were conducted among older adults in four states of Peninsular Malaysia, controlled for critical confounding factors. A series of cognitive function tests that allowed the assessment of different domains of cognitive function were used. Sugar intake was assessed for total sugar, and various other sugars included the source from different food categories. Several limitations of the study include the cross-sectional design, which precludes conclusion regarding the direction of causality; sugar intake estimation using DHQ and FFQ, which may be subject to recall bias and further, it is impossible to exclude the possibility of residual confounding despite controlling for few confounders. To our knowledge, this study is the first to provide evidence suggesting that dietary sugar detrimentally affects cognitive functioning among older adults in Malaysia.
Conclusion
This study confirmed the hypothesis that high sugar intake would be significantly related to overall lower cognitive performance across verbal and visual memory. The findings of this study contribute to the existing knowledge in this field, indicating that diets high in sugars, notably free sugar or sucrose produce cognitive deficits and impairments in brain functioning. Excessive sugar intake, especially free sugar, is not only attributed to global cognitive functions but also specifically affects verbal memory and visual memory. The data are in accord with emerging evidence highlighting a prominent role of sugar intake in preventing cognitive decline among older adults.
Acknowledgments
The authors thank the Ministry of Education Malaysia for funding this review through the Fundamental Research Grant Scheme (FRGS) (FRGS/1/2016/SKK06/UKM/01/1). We appreciate the contribution and hard work of all co-researchers, staffs, and field workers.
Disclosure
The authors report no conflicts of interest in this work.
References
1. Pase MP, Himali JJ, Jacques PF, et al. Sugary beverage intake and preclinical Alzheimer’s disease in the community. Alzheimer’s Dement. 2017;13(9):955–964. doi:10.1016/j.jalz.2017.01.024
2. World Health Organization. Guideline: Sugars Intake for Adults and Children. Geneva: WHO; 2015. Available from: https://www.who.int/nutrition/publications/guidelines/sugars_intake/en/. Accessed July 5, 2019.
3. Amarra MSV, Khor GL, Chan P. Intake of added sugar in Malaysia a review. Asia Pac J Clin Nutr. 2016;25(2):227–240. doi:10.6133/apjcn.2016.25.2.13
4. Malik VS, Popkin BM, Bray GA, Després JP, Hu FB. Sugar sweetened beverages, obesity, type 2 diabetes and cardiovascular disease risk. Circulation. 2010;121(11):1356–1364. doi:10.1161/CIRCULATIONAHA.109.876185.Sugar
5. Stanhope KL. Sugar consumption, metabolic disease and obesity: the state of the controversy. Crit Rev Clin Lab Sci. 2016;53(1):52–67. doi:10.3109/10408363.2015.1084990
6. Johnson RK, Appel LJ, Brands M, et al. Dietary sugars intake and cardiovascular health: a scientific statement from the American Heart Association. Circulation. 2009;120(11):1011–1020. doi:10.1161/CIRCULATIONAHA.109.192627
7. Fried SK, Rao SP. Sugars, hypertriglyceridemia, and cardiovascular disease 1 – 4. Am J Clin Nutr. 2003;78(suppl):873S–880S.
8. Lutsey PL, Steffen LM, Stevens J. Dietary intake and the development of the metabolic syndrome: the atherosclerosis risk in communities study. Circulation. 2008;117(6):754–761. doi:10.1161/CIRCULATIOsNAHA.107.716159
9. Jurdak N, Lichtenstein AH, Kanarek RB. Diet-induced obesity and spatial cognition in young male rats. Nutr Neurosci. 2008;11(2):48–54. doi:10.1179/147683008X301333
10. Soares E, Prediger RD, Nunes S, et al. Spatial memory impairments in a prediabetic rat model. Neuroscience. 2013;250:565–577. doi:10.1016/j.neuroscience.2013.07.055
11. Kendig MD, Boakes RA, Rooney KB, Corbit LH. Chronic restricted access to 10% sucrose solution in adolescent and young adult rats impairs spatial memory and alters sensitivity to outcome devaluation. Physiol Behav. 2013;120:164–172. doi:10.1016/j.physbeh.2013.08.012
12. Kendig MD. Cognitive and behavioural effects of sugar consumption in rodents. A review. Appetite. 2014;80(MAY 2014):41–54. doi:10.1016/j.appet.2014.04.028
13. Agrawal R, Gomez-Pinilla F. “Metabolic syndrome” in the brain: deficiency in omega-3 fatty acid exacerbates dysfunctions in insulin receptor signalling and cognition. J Physiol. 2012;590(10):2485–2499. doi:10.1113/jphysiol.2012.230078
14. Murray AM, Barzilay JI, Lovato JF, et al. Biomarkers of renal function and cognitive impairment in patients with diabetes. Diabetes Care. 2011;34(8):1827–1832. doi:10.2337/dc11-0186
15. Ye X, Gao X, Scott T, Tucker KL. Habitual sugar intake and cognitive function among middle-aged and older Puerto Ricans without diabetes. Br J Nutr. 2011;106:1423–1432. doi:10.1017/S0007114511001760
16. Gustaw-Rothenberg K. Dietary patterns associated with Alzheimer’s disease: population based study. Int J Environ Res Public Health. 2009;6(4):1335–1340. doi:10.3390/ijerph6041335
17. Power SE, O’Connor EM, Ross RP, et al. Dietary glycaemic load associated with cognitive performance in elderly subjects. Eur J Nutr. 2015;54(4):557–568. doi:10.1007/s00394-014-0737-5
18. Ginieis R, Franz EA, Oey I, Peng M. The “sweet” effect: comparative assessments of dietary sugars on cognitive performance. Physiol Behav. 2018;184(December 2017):242–247. doi:10.1016/j.physbeh.2017.12.010
19. Shahar S, Omar A, Vanoh D, et al. Approaches in methodology for population-based longitudinal study on neuroprotective model for healthy longevity (TUA) among Malaysian older adults. Aging Clin Exp Res. 2015. doi:10.1007/s40520-015-0511-4
20. Shahar S, Earland J, Rahman SA. Validation of a dietary history questionnaire against a 7-D weighed record for estimating nutrient intake among rural elderly Malays. Mal J Nutr. 2000;6:33–44.
21. Nik Shanita S, Norimah AK, Abu Hanifah S. Development and validation of a food frequency questionnaire (FFQ) for assessing sugar consumption among adults in Klang Valley, Malaysia. Malays J Nutr. 2012;18(3):283–293.
22. Chong CP, Haron H, Shahar S, Md Noh MF. Individual sugars contents in cooked dishes, processed foods, fruits and beverages commonly consumed by Malaysian. J Food Compos Anal. 2019;80:
23. USDA. USDA Food Composition Databases. https://ndb.nal.usda.gov/ndb/search/list. Published 2015. Accessed December 10, 2018.
24. Ministry of Health Singapore. The Composition of Foods Commonly Eaten in Singapore. Singapore: Department of Department of Nutrition, Ministry of Health; 2000.
25. Sharifah Azizah TN, Nik Shanita S, Hasnah H. Amount and types of sugars in selected commercial and traditional kuih in Klang Valley, Malaysia. Int Food Res J. 2015;22(6):2642–2649.
26. Nik Shanita S Development and identification of glycemic index and types of carbohydrates in selected foods consumed by athletes in high intensity sports. PhD Thesis (unpublished) 2005.
27. Norhayati MK, Mohd Fairulnizal MN, Mohd Naeem MN, et al. Individual and total sugar contents of 83 Malaysian foods. J Food Res. 2018;7(3):58. doi:10.5539/jfr.v7n3p58
28. World Health Organization. Diet, nutrition and the prevention of chronic diseases. Geneva: WHO; 2003. Available from: https://www.who.int/dietphysicalactivity/publications/trs916/en/. Accessed July 5, 2019.
29. Normah CD, Shahar S, Zulkifli BH, Razali R, Vyrn CA, Omar A. Validation and optimal cut-off scores of the bahasa Malaysia version of the Montreal Cognitive Assessment (MoCA-BM) for mild cognitive impairment among community-dwelling older adults in Malaysia (Keesahan dan Skor Titik Potong Optimum Versi Bahasa Malays. Sains Malaysiana. 2016;45(9):1337–1343.
30. Folstein MF, Folstein SE, McHugh PR. “Mini-mental state”. A practical method for grading the cognitive state of patients for the clinician. J Psychiatr Res. 1975;12(3):189–198. 0022-3956(75)90026-6 [pii].
31. Wechsler D. WAIS–III: Wechsler Adult Intelligence Scale—Third Edition Administration and Scoring Manual. San Antonio, TX: Psychological Corporation; 1997.
32. Rey A. L’examen Clinique En Psychologie (the Clinical Psychological Examination). Paris: Presses Universitaires de France; 1964.
33. Wechsler D. Wechsler Memory Scale-Revised. San Antonio: The Psychological Corporation; 1987.
34. Rowe JW, Kahn RL. Successful aging. Gerontologist. 1997;37(4):433–440. doi:10.1093/geront/37.4.433
35. Hamid TA, Momtaz YA, Ibrahim R. Predictors and prevalence of successful aging among older Malaysians. Gerontology. 2012;58(4):366–370. doi:10.1159/000334671
36. Vanoh D, Shahar S, Din NC, et al. Predictors of poor cognitive status among older Malaysian adults: baseline findings from the LRGS TUA cohort study. Aging Clin Exp Res. 2016:1–10. doi:10.1007/s40520-016-0553-2
37. Petersen RC, Caracciolo B, Brayne C, Gauthier S, Jelic V, Fratiglioni L. Mild cognitive impairment: a concept in evolution. J Intern Med. 2014;275(3):214–228. doi:10.1111/joim.12190
38. Lee LK, Shahar S, Chin A-V, Mohd Yusoff NA, Rajab N, Aziz SA. Prevalence of gender disparities and predictors affecting the occurrence of mild cognitive impairment (MCI). Arch Gerontol Geriatr. 2012;54(1):185–191. doi:10.1016/j.archger.2011.03.015
39. Norimah AK, Safiah M, Jamal K, et al. Food consumption patterns: findings from the Malaysian Adult Nutrition Survey (MANS). Malays J Nutr. 2008;14(1):25–39.
40. Setiati S, Harimurti K, Dewiasty E, et al. Profile of food and nutrient intake among Indonesian elderly population and factors associated with energy intake: a multi-centre study. Acta Med Indones. 2013;45(4):265–274. doi:10.1017/S0305004100065038
41. Atmarita IN, Jahari AB, Permaesih ID, Chan P, Amarra MS. Consumption and sources of added sugar in Indonesia: a review. Asia Pac J Clin Nutr. 2018;27(1):47–64. doi:10.6133/apjcn.042017.07
42. Kriengsinyos W, Chan P, Amarra MSV. Consumption and sources of added sugar in Thailand: a review. Asia Pac J Clin Nutr. 2018;27(2):262–283. doi:10.6133/apjcn.042017.08
43. Reichelt AC, Killcross S, Hambly LD, Morris MJ, Westbrook RF. Impact of adolescent sucrose access on cognitive control, recognition memory, and parvalbumin immunoreactivity. Learn Mem. 2015;22(4):215–224. doi:10.1101/lm.038000.114
44. Boniface B, Umberger WJ Factors influencing Malaysian consumers ’ consumption of dairy products. In:
45. Loef M, Walach H. Fruit, vegetables and prevention of cognitive decline or dementia: a systematic review of cohort studies. J Nutr Heal Aging. 2012;16(7):626–630. doi:10.1007/s12603-012-0097-x
46. Mottaghi T, Amirabdollahian F, Haghighatdoost F. Fruit and vegetable intake and cognitive impairment: a systematic review and meta-analysis of observational studies. Eur J Clin Nutr. 2017;1. doi:10.1038/s41430-017-0005-x
47. Polidori MC, Praticó D, Mangialasche F, et al. High fruit and vegetable intake is positively correlated with antioxidant status and cognitive performance in healthy subjects. J Alzheimers Dis. 2009;17:921–927. doi:10.3233/JAD-2009-1114
48. van der Zwaluw NL, van de Rest O, Kessels RPC, de Groot LCPGM. Short-term effects of glucose and sucrose on cognitive performance and mood in elderly people. J Clin Exp Neuropsychol. 2014;36(5):517–527. doi:10.1080/13803395.2014.912613
49. Papanikolaou Y, Palmer H, Binns MA, Jenkins DJA, Greenwood CE. Better cognitive performance following a low-glycaemic-index compared with a high-glycaemic-index carbohydrate meal in adults with type 2 diabetes. Diabetologia. 2006;49(5):855–862. doi:10.1007/s00125-006-0183-x
50. Nabb SL, Benton D. The effect of the interaction between glucose tolerance and breakfasts varying in carbohydrate and fibre on mood and cognition. Nutr Neurosci. 2006;9(3–4):161–168. doi:10.1080/10284150600955099
51. Roberts RO, Roberts LA, Geda YE, et al. Relative intake of macronutrients impacts risk of mild cognitive impairment or dementia. J Alzheimer’s Dis. 2012;32(2):329–339. doi:10.3233/JAD-2012-120862
52. Jurdak N, Kanarek RB. Sucrose-induced obesity impairs novel object recognition learning in young rats. Physiol Behav. 2009;96(1):1–5. doi:10.1016/j.physbeh.2008.07.023
53. Cao D, Lu H, Lewis TL, Li L. Intake of sucrose-sweetened water induces insulin resistance and exacerbates memory deficits and amyloidosis in a transgenic mouse model of alzheimer disease. J Biol Chem. 2007;282(50):36275–36282. doi:10.1074/jbc.M703561200
54. Chepulis LM, Starkey NJ, Waas JR, Molan PC. The effects of long-term honey, sucrose or sugar-free diets on memory and anxiety in rats. Physiol Behav. 2009;97(3–4):359–368. doi:10.1016/j.physbeh.2009.03.001
55. Messier C, Gagnon M. Glucose regulation and cognitive functions: relation to Alzheimer’s disease and diabetes. Behav Brain Res. 1996;1–11. doi:10.1016/0166-4328(95)00153-0
56. Morris JK, Vidoni ED, Honea RA, Burns JM. Impaired glycemia increases disease progression in mild cognitive impairment. Neurobiol Aging. 2014;35(3):585–589. doi:10.1016/j.neurobiolaging.2013.09.033
57. Biessels GJ, Reagan LP. Hippocampal insulin resistance and cognitive dysfunction. Nat Rev Neurosci. 2015;16(11):660–671. doi:10.1038/nrn4019
58. Young SE, Mainous AG, Carnemolla M. Hyperinsulinemia and cognitive decline in a middle-aged cohort. Diabetes Care. 2006;29(12):2688–2693. doi:10.2337/dc06-0915
59. Kong SH, Park YJ, Lee JY, Cho NH, Moon MK. Insulin resistance is associated with cognitive decline among older koreans with normal baseline cognitive function: a prospective community-based cohort study. Sci Rep. 2018;8(1):1–9. doi:10.1038/s41598-017-18998-0
60. Simen AA, Bordner KA, Martin MP, Moy LA, Barry LC. Cognitive dysfunction with aging and the role of inflammation. Ther Adv Chronic Dis. 2011;2(3):175–195. DOI:10.1177/2040622311399145
61. Eikelenboom P, Veerhuis R, Scheper W, Rozemuller AJM, Van Gool WA, Hoozemans JJM. The significance of neuroinflammation in understanding Alzheimer’s disease. J Neural Transm. 2006;113(11):1685–1695. doi:10.1007/s00702-006-0575-6
62. Mecocci P. Oxidative stress in mild cognitive impairment and Alzheimer disease: a continuum. J Alzheimer’s Dis. 2004;6(2):159–163. doi:10.3233/JAD-2004-6207
63. Adebola PA, Akindele AJ, Olayemi SO. Evaluation of oxidative stress and cognitive function status of elderly hypertensive patients. J Clin Sci. 2017;14(4):193–199. doi:10.4103/jcls.jcls_3_17
64. Srikanth V, Maczurek A, Phan T, et al. Advanced glycation endproducts and their receptor RAGE in Alzheimer’s disease. Neurobiol Aging. 2011;32(5):763–777. doi:10.1016/j.neurobiolaging.2009.04.016
65. Uribarri J, Woodruff S, Goodman S, et al. Advanced glycation end products in foods and a practical guide to their reduction in the diet. J Am Diet Assoc. 2010;110(6):911–916.e12. doi:10.1016/j.jada.2010.03.018
66. Tyler WJ. From acquisition to consolidation: on the role of brain-derived neurotrophic factor signaling in hippocampal-dependent learning. Learn Mem. 2002;9(5):224–237. doi:10.1101/lm.51202
67. Connor B, Young D, Yan Q, Faull RLM, Synek B, Dragunow M. Brain-derived neurotrophic factor is reduced in Alzheimer’s disease. Mol Brain Res. 1997;49:71–81. doi:10.1016/S0169-328X(97)00125-3
68. Laske C, Stransky E, Leyhe T, et al. Stage-dependent BDNF serum concentrations in Alzheimer’s disease. J Neural Transm. 2006;113(9):1217–1224. doi:10.1007/s00702-005-0397-y
69. Molteni R, Barnard R, Ying Z, Roberts C, Gómez-Pinilla F. A high-fat, refined sugar diet reduces hippocampal brain-derived neurotrophic factor, neuronal plasticity, and learning. Neuroscience. 2002;112(4):803–814. doi:10.1016/S0306-4522(02)00123-9
70. Chan KL, Tong KY, Yip SP. Relationship of serum brain-derived neurotrophic factor (BDNF) and health-related lifestyle in healthy human subjects. Neurosci Lett. 2008;447(2–3):124–128. doi:10.1016/j.neulet.2008.10.013
71. Neshatdoust S, Saunders C, Castle SM, et al. High-flavonoid intake induces cognitive improvements linked to changes in serum brain-derived neurotrophic factor: two randomised, controlled trials. Nutr Heal Aging. 2016;4(1):81–93. doi:10.3233/NHA-1615
 © 2019 The Author(s). This work is published and licensed by Dove Medical Press Limited. The
full terms of this license are available at https://www.dovepress.com/terms
and incorporate the Creative Commons Attribution
- Non Commercial (unported, 3.0) License.
By accessing the work you hereby accept the Terms. Non-commercial uses of the work are permitted
without any further permission from Dove Medical Press Limited, provided the work is properly
attributed. For permission for commercial use of this work, please see paragraphs 4.2 and 5 of our Terms.
© 2019 The Author(s). This work is published and licensed by Dove Medical Press Limited. The
full terms of this license are available at https://www.dovepress.com/terms
and incorporate the Creative Commons Attribution
- Non Commercial (unported, 3.0) License.
By accessing the work you hereby accept the Terms. Non-commercial uses of the work are permitted
without any further permission from Dove Medical Press Limited, provided the work is properly
attributed. For permission for commercial use of this work, please see paragraphs 4.2 and 5 of our Terms.