Back to Journals » International Journal of Nanomedicine » Volume 21
Graphene Oxide Potentiates Induction Efficiency and Functional Maturation of Induced Mammary Epithelial Cells
Authors Lei Z, Sun Z, Deng S, Wang G, Liu Q, Huang B, Zhang D
Received 14 August 2025
Accepted for publication 29 January 2026
Published 5 March 2026 Volume 2026:21 560553
DOI https://doi.org/10.2147/IJN.S560553
Checked for plagiarism Yes
Review by Single anonymous peer review
Peer reviewer comments 3
Editor who approved publication: Professor Eng San Thian
Zhigang Lei,* Zhe Sun,* Shan Deng, Guodong Wang, Quanhui Liu, Ben Huang, Dandan Zhang
Department of Technical Support, the People’s Hospital of Guangxi Zhuang Autonomous Region, Nanning, 530021, People’s Republic of China
*These authors contributed equally to this work
Correspondence: Dandan Zhang, Email [email protected] Ben Huang, Email [email protected]
Purpose: This study aims to explore the effects of graphene oxide (GO) particles on the RepSox-mediated transdifferentiation of fibroblasts into mammary epithelial cells.
Methods: GO was synthesized using the Hummers method, and its structure was characterized by Fourier transform infrared spectroscopy (FTIR) and Raman spectroscopy. Its biocompatibility was verified through CCK - 8 and EdU assays. The effects of the GO/RepSox composite system on the transdifferentiation process of fibroblasts and the potential regulatory mechanisms were comprehensively evaluated using morphological observation, immunofluorescent staining, Western blot analysis, real - time quantitative PCR (qRT - PCR), and RNA sequencing techniques.
Results: The synthesized GO not only had good biocompatibility but also promoted cell proliferation. GO significantly improved the efficiency of RepSox-mediated transdifferentiation of fibroblasts into mammary epithelial cells and enhanced the lactation function of mammary epithelial cells. Mechanistically, GO may create favorable conditions for transdifferentiation by coordinately regulating mitochondrial energy metabolism (the ATP level was significantly increased in the R + GO group) and cell cycle progression (the proportion of cells in the G1 phase was significantly increased).
Conclusion: This study first elucidates the regulatory role of GO in cell fate determination and provides innovative research ideas and experimental evidence for the application of nanomaterials in cell reprogramming and transdifferentiation.
Keywords: nanomaterials, fibroblasts reprogramming, mitochondrial energy, cell cycle
Introduction
Pluripotent stem cells (PSCs) boast unlimited proliferative potential and robust self-renewal capacity, readily differentiating into diverse cell types across all three germ layers. The landmark advent of induced pluripotent stem cell (iPSC) technology in 2006 heralded a paradigm shift in somatic cell reprogramming, igniting intense research into direct lineage conversion. This strategy transdifferentiates somatic cells into alternative lineages, crucially bypassing the pluripotent intermediate state.1 Compared to iPSC-based approaches, direct reprogramming offers distinct advantages: accelerated kinetics, markedly higher efficiency, and the unique capability for in situ tissue conversion, eliminating the need for ex vivo cell expansion and transplantation. Although reprogramming of several cell types has been achieved, formidable challenges persist for clinical translation—notably low conversion efficiency, functional immaturity of reprogrammed cells in vitro, a critical lack of safe delivery vehicles, and imprecise targeting of specific cellular subtypes.2 To overcome these hurdles, innovative strategies—including vitamin B supplementation,3 combinatorial small-molecule cocktails,4 and nanomaterial-enhanced reprogramming5—have been developed, yielding significant strides toward viable regenerative medicine applications.6–9
Graphene oxide (GO) demonstrates a significant promoting effect on tissue regeneration and repair.10–12 Research indicates that polycarbonate diol/isosorbide polyurethane-based GO-doped nanofiber scaffolds significantly improve myoblast adhesion and spreading while upregulating myosin heavy chain (MHC) expression, making them excellent for skeletal muscle tissue engineering.13 In myocardial tissue repair, polylactic acid/graphene nanocomposites are promising scaffold materials.14 Additionally, aminated graphene nanosheets can promote maturation and differentiation of human induced pluripotent stem cell (hiPSC)-derived cardiomyocytes in vitro, enhancing their survival in vivo—offering a novel strategy for myocardial regeneration therapy.15 In cancer treatment, the drug delivery capabilities of GO provide new opportunities for targeted therapy due to its unique physicochemical properties as an ideal drug carrier platform.16 Furthermore, GO demonstrates remarkable effectiveness in tendon-bone healing and skin injury repair. GO-enhanced autologous platelet-rich plasma gel not only improves structural integrity but also accelerates healing at the tendon-bone interface by modulating the repair microenvironment. Furthermore, GO powerfully enhances the biocompatibility, potent antimicrobial activity, and robust mechanical properties of dermal wound dressings, effectively stimulating endothelial migration, neovascularization, and re-epithelialization.17,18
Regenerative medicine critically depends on sufficient functional cells for tissue replenishment,19 yet low reprogramming efficiency poses a persistent challenge. Building upon our 2021 breakthrough achieving 3.7% yield with RepSox-induced caprine fibroblast reprogramming,20 this study demonstrates that GO nanoparticle supplementation dramatically enhances reprogramming efficiency. This enhancement is evidenced by strikingly elevated expression of mammary epithelial markers within the identical induction period. Furthermore, RNA-seq analysis revealed significantly enriched pathways—mitochondrial function and cell cycle regulation—underlying this improvement. Consequently, our findings provide both a novel strategy and a robust experimental foundation for optimizing reprogramming efficiency in regenerative medicine. This approach holds significant potential for further refinement through adjustments to induction parameters and material design.
Materials and Methods
Materials and Reagents
Fetal bovine serum (FBS), Dulbecco’s Modified Eagle Medium (DMEM; high glucose), GlutaMAX™, KnockOut™ Serum Replacement (KSR), phosphate-buffered saline (PBS), penicillin-streptomycin (Pen-Strep), Neurobasal™ Medium, KnockOut™ DMEM/F12, N2 Supplement, and B27™ Supplement were sourced from Gibco (Thermo Fisher Scientific, USA); trypsin-EDTA (0.25%), dimethyl sulfoxide (DMSO), 4% paraformaldehyde (PFA), and VPA were obtained from Sigma-Aldrich (Merck KGaA, Germany); RepSox was sourced from Selleck Chemicals (USA); the cDNA synthesis kit and Hoechst 33342 nuclear stain were acquired from Beyotime Biotechnology (China); graphite powder, potassium permanganate (KMnO4), sodium nitrate (NaNO3), and hydrogen peroxide (H2O2) for GO synthesis were procured from Beyotime Biotechnology (China). ATP Chemiluminescence Assay Kit were sourced from Elabscience.
GO Synthesis and Solution Preparation
Graphite oxide was synthesized via an improved Hummers’ method. Briefly, 2.5 g graphite powder and 1.5 g NaNO3 were meticulously blended in an ice bath. Concentrated H2SO4 (100 mL) was then introduced dropwise under continuous stirring for 30 minutes. Subsequently, 8.0 g KMnO4 was cautiously added over 30 minutes, with the temperature meticulously maintained below 20°C, and the reaction vigorously agitated for 6 hours. The mixture was then carefully diluted with 800 mL ice-cold deionized water, treated with 20 mL H2O2 until gas evolution ceased, and repeatedly centrifuged until the supernatant achieved a neutral pH. The resultant precipitate was freeze-dried, yielding GO flakes. For biological applications, GO flakes underwent UV sterilization. They were then aseptically dispersed in sterile PBS at 1 mg/mL and homogenized into monodisperse nanoparticles via probe sonication (40% amplitude, 2 hours in pulse mode: 5 seconds on / 2 seconds off). The colloidal suspension was aliquoted into sterile vials and stored at 4°C for further use.
Characterization of GO
The lamellar structure and dimensions of graphene oxide (GO) were characterized employing scanning electron microscopy (SEM) and transmission electron microscopy (TEM). Specifically, the synthesized GO flakes underwent mechanical fragmentation, were subsequently mounted on a metallic stage, and imaged at an accelerating voltage of 15 kV. The particle size distribution within the GO suspensions was determined through nanoparticle tracking analysis (NTA). Three independent replicates were analyzed for each experiment, with each measurement lasting for 60 seconds.
Preparation of the GO-Cy5 Complex
A suspension containing 1 mg/mL graphene oxide (GO) in MES buffer (0.05 mol/L, pH 6.0) was combined with a dimethyl sulfoxide (DMSO) solution of Cy5-NHS ester at a mass ratio of 10:1 and stirred in the dark at room temperature for 2 hours. The reaction mixture was then dialyzed using a dialysis bag with a molecular weight cutoff of 10 kDa for a duration of 48 hours, followed by centrifugation at 8000 rpm for 10 minutes. The supernatant obtained was identified as the final product.
Biocompatibility Assessment
The biosafety of synthesized GO was rigorously assessed via CCK-8 cell viability assays. Primary caprine fibroblasts were cultured adherently and subsequently treated with 5 μg/mL or 10 μg/mL GO dispersions. Cell viability was determined at 0, 24, and 48 h by measuring absorbance at 450 nm, strictly adhering to the manufacturer’s protocol. Each experimental group incorporated five technical replicates. Viability percentage was calculated using the formula:
Viability (%) = [A(GO) - A(material blank)] / [A(no material) - A(blank)] × 100%
Cell proliferation was further evaluated employing an EdU kit (Beyotime). Following treatment with 5 μg/mL or 10 μg/mL GO dispersions for 0, 24, or 48 h, cells were incubated with EdU detection reagents. DNA-labeled samples underwent analysis using the Cytation 5 system. The ratio of green fluorescence (indicating proliferating nuclei) to blue fluorescence (marking total nuclei) precisely quantified the material’s effects on cellular activity.
Cell Culture
Guanzhong dairy goats (2–3 months old, both sexes) were sourced from the Guangxi Animal Husbandry Research Institute. Goat fibroblasts were seeded into sterile 60-mm dishes at a density of 5 × 10⁵ cells per dish and cultured in a humidified 5% CO2 incubator. Once the cells adhered (approximately (−8 hours post-passaging), the fibroblast medium was carefully replaced with induction medium containing RepSox and 5 μg/mL GO particles. Throughout the ensuing 8-day induction period, the medium was refreshed every two days. Careful observation of cell morphological changes occurred during each medium change, with alterations meticulously documented.
Quantitative PCR
Cells were washed with PBS, and total RNA was isolated using TRIzol reagent (Vazyme). cDNA synthesis was performed with a Vazyme reverse transcription kit. Quantitative PCR employed SYBR Green Premix (Vazyme) for cDNA amplification. Primer sequences can be found in Table 1. Data were normalized to GAPDH expression.
 |
Table 1 Primers for qRT-PCR |
Western Blotting
Cell lysates were prepared using ice-cold lysis buffer supplemented with protease inhibitors for 30 minutes. Protein concentration was quantified, and 30 μg aliquots were separated via 12% SDS-PAGE. Following electrophoresis, proteins were transferred onto nitrocellulose membranes, blocked thoroughly with 5% non-fat milk for 2 hours, and then incubated overnight at 4°C with primary antibodies: anti-CSN2 (1:3000, ab205301, Abcam) and anti-GAPDH (1:5000, HRP-60004, Proteintech). Membranes were subsequently incubated with HRP-conjugated Affinipure Goat Anti-Rabbit IgG (H+L) (1:10,000, SA00001-2, Proteintech) for 2 hours at room temperature. After three thorough TBST washes, protein bands were detected using an ECL kit (Epizyme) following a 2-minute exposure.
Immunofluorescence
Cells were seeded in 48-well plates for 8 hours, then induced with RepSox or RepSox combined with 5 μg/mL GO medium over 4 or 8 days. After fixation using 4% PFA (15 min, RT), samples were gently washed thrice with blocking solution (PBS containing 100 mmol/L glycine and 0.3% BSA), permeabilized with 1% Triton X-100 (15 min, RT), and blocked with 5% BSA (Beyotime, 2 h, RT). Following three thorough TBP (Triton-BSA-PBS) washes, primary antibodies were incubated overnight at 4°C: anti-CK14 (1:1000, ab181595, Abcam), anti-CDH1 (1:200, #3195, CST), anti-ITGA6 (1:100, ab95703, Abcam), and anti-VIM (1:100, 60330, Proteintech). Secondary antibodies—anti-rabbit IgG Alexa Fluor® 488 [1:250, ab150073], anti-mouse IgG Alexa Fluor® 488 [1:200, ab150109], and anti-rabbit IgG Alexa Fluor® 555 [1:250, ab150074] (all Abcam)—diluted in TBP, were applied for 2 hours at RT. Nuclei were then stained with Hoechst 33342 (15 min), and images were captured using a Cytation 5 system.
Quantitative and Statistical Analysis
For EdU proliferation and immunofluorescence quantification, fluorescence intensity was quantified using ImageJ 1.36a. Reprogramming efficiency was assessed following 4–5 days of induction with RepSox or RepSox + 5 μg/mL GO, calculated by enumerating cell colonies across eight fields per group (three biological replicates). Efficiency (%) = (Number of colonies / Number of seeded fibroblasts) × 100%. Statistical significance was evaluated using t-tests or one-way ANOVA in GraphPad Prism 8.0. Data are presented as mean ± SEM; *p < 0.05, **p < 0.01, ***p < 0.001.
RNA Sequencing
Total RNA was extracted from cell samples, with eukaryotic mRNA selectively enriched using Oligo(dT) magnetic beads. This enriched mRNA was then fragmented into segments of approximately 300 bp. Subsequently, the fragmented mRNA underwent reverse transcription into complementary DNA (cDNA), followed by ligation with specific sequencing adapters. After PCR amplification and rigorous Qubit quality control, the constructed libraries underwent a 15-cycle PCR amplification step on Illumina platforms. These amplified libraries were then purified using agarose gel electrophoresis. Quantification proceeded via Picogreen dye fluorescence. Cluster generation was achieved through bridge PCR amplification within the cBot system. Finally, high-quality paired-end (PE) sequence data, featuring a read length of 2×150 bp, was generated by sequencing on Illumina platforms.
ATP Energy Detection
Chemiluminescence Method Kit Detection. Cells from each group were collected and adjusted to a concentration of 1×10⁶ cells/mL. A volume of 100 μL was added to each well of a 96-well plate (with three replicates per group), along with blank control wells (containing only medium) and ATP standard groups. Subsequently, 100 μL of lysis buffer was introduced into each well, and the cells were lysed at room temperature for 10 minutes. After shaking for 30 seconds, 50 μL of the supernatant was transferred to a chemiluminescence plate. Following this, an equal volume (50 μL) of luminescent substrate was added, and the relative light unit (RLU) value was measured immediately. A standard curve was constructed using standard concentrations versus RLU values, allowing for the calculation of ATP concentration in micromoles (μmol). The results are presented as mean ± standard deviation based on the replicates.
Cell Cycle Detection
Cells were harvested and washed with pre-cooled PBS, followed by centrifugation at 1000 r/min for 5 minutes. Subsequently, 1 mL of pre-cooled 70% ethanol was added to fix the cells at 4°C overnight. After discarding the ethanol, the cells were washed again. Next, PBS containing 50 μg/mL RNase A was added and incubated at 37°C for 30 minutes. Finally, a propidium iodide (PI) staining solution with a final concentration of 50 μg/mL was introduced and incubated in the dark for an additional 30 minutes. Flow cytometry (excitation wavelength of 488 nm; emission signal collected at 610 nm) was employed to analyze samples containing approximately 1×10⁴ cells each, allowing for the determination of cell proportions in G0/G1 phase, S phase, and G2/M phase using FlowJo software.
Results
Synthesis and Characterization of GO
Graphene oxide (GO) was synthesized via Hummers’ method.21 GO films were prepared by vacuum filtration and subsequently mechanically fragmented to obtain homogeneous powder (Figure 1A). SEM imaging revealed distinct wrinkled lamellar structures at the edges of GO sheets (Figure 1B). TEM images revealed that the as-prepared graphene oxide sheets exhibit a typical transparent lamellar structure with slight surface wrinkles (Figure 1C). Following sonication, GO particles dispersed uniformly throughout the solution (Figure 1D), The particle size distribution is primarily concentrated around 100 nm and 800 nm, exhibiting a polydispersity index (PDI) of 0.3. (Figure 1E). FTIR spectroscopy confirmed the presence of characteristic oxygen-containing functional groups: a broad O-H stretching band centered at 3203 cm−1, C=O carbonyl stretching peaks at 1717 cm−1 and 1624 cm−1, along with C-O stretching observed at 1033 cm−1 (Figure 1F). The Raman spectrum of GO exhibits two characteristic peaks: the D peak at approximately 1340 cm−1 and the G peak at around 1580 cm−1. The intensity ratio ID/IG is approximately 1.0248, indicating a high defect density and extensive oxidation (Figure 1G). After co-culturing GO with a concentration of 5 μg/mL and GEFs for 24 hours, TEM observation showed that GO could be internalized by cells (Figure 1H). In conclusion, these findings confirmed the successful preparation of GO and its stable dispersion.
 |
Figure 1 Synthesis, Characterization and Cellular Phagocytosis of Graphene Oxide (A) A photographic image depicts GO sheets under normal light. Scale bar represents 0.5 cm. (B) A scanning electron microscopy (SEM) image reveals the structure of GO (i) GO at 50 μm scale. (ii) GO at 200 μm scale. (C) A Transmission electron microscopy (TEM) images reveal the structure GO. Scale bar represents 100 nm. (D) A photographic image shows a 1 mg/mL GO dispersion under normal light. Scale bar represents 1 cm. (E) The nanoparticle size distribution characterizes the 1 mg/mL GO dispersion. PDI=0.3. (F) The Fourier transform infrared (FTIR) spectrum provides insights into GO’s chemical composition. (G) Raman spectroscopy was employed to detect the D band at 1352 cm−1 and the G band at 1586 cm−1 for GO.Intensity ratio ID/IGwas approximately 1.0248, with a correlation coefficient R2 of 0.9984.n=3. (H) TEM microscopic observation of GO internalization by cells. The scale bar represents 5 micrometers. |
Graphene Oxide Promotes Cell Proliferation
Next, we investigated the effects of different concentrations of GO on the viability of GEFs and L929 cells. The results from assays conducted at 0 h, 24 h, and 48 h demonstrated that treatment with 5 μg/mL and 10 μg/mL GO nanoparticles led to increased cell viability. Notably, GO at a concentration of 5 μg/mL exhibited a more pronounced enhancement in cell viability compared to other tested conditions (Figure 2A and B).
 |
Figure 2 Graphene oxide promotes cell proliferation. The proliferation activity of GEFs (A) and L929 (B) cells cultured with GO was assessed using the CCK-8 assay. n=3. Data are presented as mean ± standard error of the mean (SEM). ns = not significant, *p < 0.05, **p < 0.01 (one-way ANOVA) (C) Proliferation efficiency of GEFs and L929 cells cultured with GO was determined via EdU incorporation assay (Scale bar = 200 μm). (D) Quantitative analysis of fluorescence intensity, based on EdU staining, normalized the negative NC group to 1. Data represent mean ± standard error of the mean (SEM); n = 3. ns = not significant, *p < 0.05, (one-way ANOVA). |
To further evaluate the impact of 5 μg/mL GO on cell proliferation, EdU staining was employed to assess DNA synthesis activity during the proliferative phase. Statistical analysis revealed that, relative to the control group, GO treatment significantly promoted cellular proliferation (Figure 2C and D). Collectively, these results indicate that GO possesses favorable biocompatibility and is capable of significantly enhancing cell viability and stimulating cell proliferation.
GO Enhances R-CiMECs Reprogramming
Previous studies conducted by our research group have demonstrated that the small-molecule compound RepSox (R) is capable of inducing the transdifferentiation of goat fibroblasts into mammary epithelial cells; however, the efficiency of this transdifferentiation was found to be relatively low. To further investigate the impact of GO on the transdifferentiation process in R-CiMECs, we introduced 5 μg/mL of GO (R + 5 μg/mL GO) during the RepSox culture phase aimed at inducing fibroblast transformation. The results indicated that, akin to RepSox induction, the R + 5 μg/mL GO treatment successfully induced the transdifferentiation of fibroblasts, leading to the formation of epithelial-like aggregates (Figure 3A). Importantly, the clone formation rate for the R + 5 μg/mL GO group ranged from 4.7066% to 4.8185%, which represents a significant increase compared to a rate of 3.8641% observed in the R group (Figure 3B). This suggests that within an equivalent timeframe, the R + 5 μg/mL GO condition facilitates a greater yield of epithelial-like aggregates.
 |
Figure 3 Efficiency of GO in promoting R-induced transdifferentiation into mammary epithelial cells. (A) Morphological transformations observed in induced cells throughout transdifferentiation (Days 0 to 8) under R + 5 μg/mL GO, R alone, or N2B27 medium conditions. n = 3 biological replicates. All photographs were captured at identical magnification. Scale bar represents 400 μm. (B) Transdifferentiation efficiency achieved in R + 5 μg/mL GO, R, and N2B27 medium. Efficiency (%) = (Number of primary colonies / Number of seeded Day 0 cells (GEFs)) × 100%. n = 3. Data are presented as mean ± standard error of the mean (SEM). **p < 0.01, *** p < 0.001, (one-way ANOVA). |
Next, we conducted further verification of the biological characteristics and functions of the epithelial cell-like aggregates induced by R + 5 μg/mL GO. Immunofluorescence detection results revealed that both the R + 5 μg/mL GO group and the R group expressed mammary epithelial cell marker antigens CK14, CDH1, and ITGA6; however, they did not express the fibroblast marker antigen VIM (Figure 4A). Furthermore, compared to the R group, the R + 5 μg/mL GO group exhibited higher fluorescence intensities for CK14, CDH1, and ITGA6 expression (Figures 4B). On day eight of induction, CSN2 protein levels in the R + 5 μg/mL GO group were significantly elevated relative to those in the R group (Figures 4C and D).
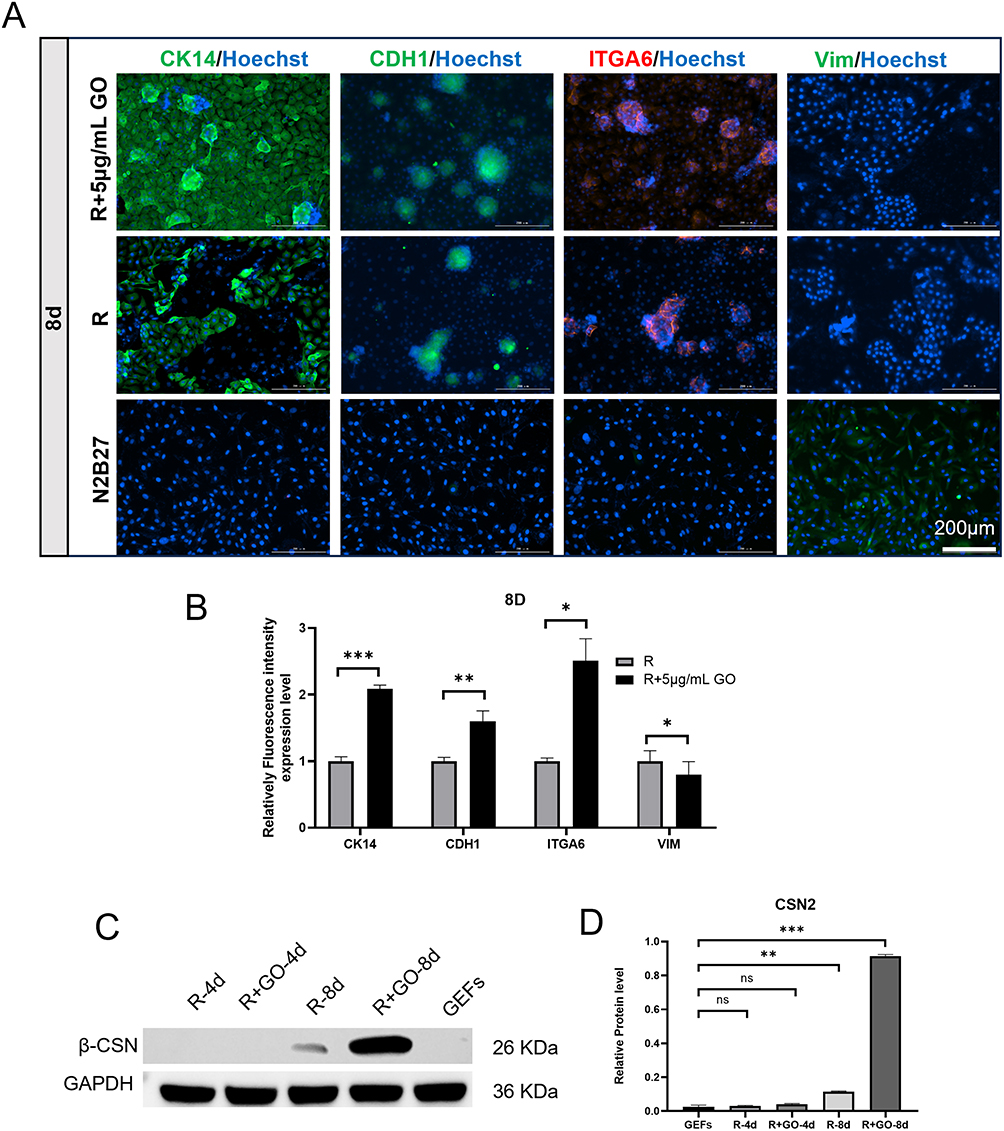 |
Figure 4 Immunofluorescence (IF) and Western Blot (WB) Analysis of Protein Expression in R+GO-Induced Mammary Epithelial Cells. (A) IF reveals CK14, CDH1, ITGA6, and VIM expression patterns under R+5μg/mL GO, R-only, and N2B27 culture conditions at day 8 of transdifferentiation. n = 3 biological replicates. Scale bar: 200 μm (consistent magnification). (B) Quantification of relative CK14, CDH1, ITGA6, and VIM expression levels at day 4 and day 8, determined from IF fluorescence intensity using ImageJ. n = 3 biological replicates. Data represent mean ± SEM. ns = not significant, *p < 0.05, **p < 0.01, ***p < 0.001 (one-way ANOVA). (C) WB detection demonstrates CSN2 expression in R-4d, R+GO-4d, R-8d, R+GO-8d cells, but not GEFs. (D) Quantification of relative CSN2 expression, derived from WB band intensity analysis (ImageJ). n = 3 biological replicates. Data represent mean ± SEM. ns = not significant. **p < 0.01, ***p < 0.001 (one-way ANOVA). |
RT-PCR analysis revealed that, compared to the R group, there was a significant upregulation in the expression of mammary epithelial cell-related genes, including EPCAM, CK19, GATA3, and CSN2 in the R + 5 μg/mL GO group. Conversely, the expression level of the fibroblast marker gene VIM was markedly downregulated (Figures 5A and B). Notably, when compared to the Repsox group at equivalent induction time points, gene expressions associated with epithelial cells as well as mammary gland development and lactation were significantly enhanced in the R + 5 μg/mL GO group (Figures 5C and D).
 |
Figure 5 qRT-PCR analysis of lipid metabolism genes and Oil Red O staining for lipid droplet accumulation in R+GO-treated breast epithelial cells. (A) Relative expression levels of EPCAM, CK19, VIM, CSN2, and GATA3 under N2B27, R, and R+5 μg/mL GO culture conditions at day 4 of transdifferentiation. n= 3 biological replicates. Data represent mean ± SEM. ns = not significant, *p < 0.05, **p < 0.01, ***p < 0.001 (one-way ANOVA). (B) Relative expression levels of EPCAM, CK19, VIM, CSN2, and GATA3 under N2B27, R, and R+5 μg/mL GO culture conditions at day 8 of transdifferentiation. n= 3 biological replicates. Data represent mean ± SEM. *p < 0.05, **p < 0.01, (one-way ANOVA). (C) Relative expression levels of EPCAM, CK19, VIM, CSN2, and GATA3 under R, and R+5 μg/mL GO culture conditions at day 4 of transdifferentiation. n= 3 biological replicates. Data represent mean ± SEM. ns = not significant, *p < 0.05, **p < 0.01 (one-way ANOVA). (D) Relative expression levels of EPCAM, CK19, VIM, CSN2, and GATA3 under R, and R+5 μg/mL GO culture conditions at day 8 of transdifferentiation. n= 3 biological replicates. Data represent mean ± SEM. *p < 0.05, **p < 0.01 (one-way ANOVA). (E) Oil Red O staining was used to detect the accumulation of lipid droplets in mammary epithelial cells of the R group after 8 days of induction. Scale bar represents 200 μm. (F) Oil Red O staining was used to detect the accumulation of lipid droplets in mammary epithelial cells of the R+GO group after 8 days of induction. Scale bar represents 200 μm. |
After eight days of induction culture, results from Oil Red O staining indicated that only a few scattered red lipid droplets were observed in the cells of the R group. In contrast, the R + 5 μg/mL GO group exhibited a substantial increase in both the number and volume of red lipid droplets; these droplets were notably enlarged and displayed an aggregated distribution pattern (Figures 5E and F).
The above results indicate that after adding GO to the Repsox induction system, it can not only induce the formation of mammary epithelial cells but also promote the increase in the expression levels of mammary epithelial cell marker genes and marker proteins.
RNA Sequencing Reveals GO Promotes R-CiMECs Maturation
To elucidate the molecular mechanism through which GO enhances mammary epithelial cell reprogramming, mRNA-seq analysis was conducted across fibroblasts (0d), R-induced cells at 2 days (R-2d), 4 days (R-4d), 8 days (R-8d), and R+5 μg/mL GO-induced cells at 2 days (R+GO-2d), 4 days (R+GO-4d), and 8 days (R+GO-8d). Principal Component Analysis (PCA) robustly assessed inter-group differences and intra-group reproducibility. Findings revealed remarkably tight clustering of biological replicates within each group, unequivocally confirming high data quality and experimental reproducibility (Figure 6A). Compared to 0d, R+GO groups exhibited a progressive downregulation of key fibroblast markers (COL11A1, FBN1, FIBIN, TGFβR1) while powerfully activating critical mammary development and lactation-related genes (IGF1R, KRT19, ELF5, LTF, GATA3, AGR2) throughout the induction period (Figure 6B). Differential expression analysis (|Fold change| > 2, *p*< 0.05) identified a substantial 1,749 upregulated and 1,133 downregulated genes in R+GO-4d cells versus 0d, whereas R+GO-8d cells displayed 1,499 upregulated and 1,427 downregulated genes (Figure 6C and D). Striking functional enrichment demonstrated R+GO-4d was strongly associated with epithelial tube formation, epithelial bud development, and mammary gland development (Figure 6E), while R+GO-8d was significantly enriched for estrogen receptor signaling, vesicle secretion, and lipid droplet secretion processes (Figure 6F). KEGG pathway analysis further highlighted prominent enrichment of AMPK, MAPK, Insulin, Adipocytokine, and p53 signaling pathways (Figure 6G). These data further demonstrate that the fate of mammary epithelial cells is indeed activated.
 |
Figure 6 RNA-Seq Validation of R+GO-Induced Transdifferentiation into Mammary Epithelial Cells from Goat Embryonic Fibroblasts (GEFs). (A) t-SNE projection of 0d, R-2d, R+GO-2d, R-4d, R+GO-4d, R-8d, and R+GO-8d groups. (B) Heatmap of differentially expressed genes (DEGs) between fibroblasts and mammary epithelial cells. (C) Volcano plot of DEGs in R+GO-4d versus 0d. (D) Volcano plot of DEGs in R+GO-8d versus 0d. (E) GO biological process enrichment of upregulated DEGs at R+GO-4d. (F) GO biological process enrichment of upregulated DEGs at R+GO-8d. (G) KEGG pathway enrichment of upregulated DEGs at R+GO-4d and R+GO-8d. |
To deeply explore the genomic differences between the mammary epithelial cells obtained from the R + GO group and the R group, we analyzed the differentially expressed genes (DEGs) between the two groups at the same time points (days 2, 4, and 8), and screened out the genes that were significantly up - regulated and down - regulated in the R + GO group compared with the R group (at least 2 - fold changes, p < 0.05) (Figure 7A–C). Compared with R - 2d, R + GO - 2d was enriched with more functions related to cell growth and development, establishment and maintenance of epithelial cells, and epithelial cell development and proliferation (Figure 7D); compared with R - 4d, R + GO - 4d was enriched with more functions related to gland development, phospholipid metabolism, glycerophospholipid synthesis, epithelial tube formation, and mammary epithelial cell development (Figure 7E); compared with the R - 8d group, the R + GO - 8d group was enriched with more functions related to mammary gland development, vesicle organization, estrogen receptor signaling pathway, lactation, etc. (Figure 7F). Single - gene expression analysis showed that the expression of EPCAM, IGFIR, CDH1, KRT19, ELF5, and GATA3 was significantly up - regulated in the R + GO group (Figure 7G). In summary, the analysis based on gene transcriptome data showed that both R + GO and R could effectively induce the transdifferentiation of fibroblasts into mammary epithelial cells with lactation function; more importantly, the addition of GO further enhanced the maturity - related characteristics of the transdifferentiated mammary epithelial cells.
 |
Figure 7 RNA-Seq Analysis of GO-Enhanced Mammary Epithelial Cell Reprogramming from GEFs. (A) Heatmap of DEGs in R+GO-2d versus R-2d. (B) GO enrichment terms for upregulated DEGs at day 2. (C) Heatmap of DEGs in R+GO-4d versus R-4d. (D) GO enrichment terms for upregulated DEGs at day 4. (E) Heatmap of DEGs in R+GO-8d versus R-8d. (F) GO enrichment terms for upregulated DEGs at day 8. (G) Line graph of mammary epithelial signature gene expression dynamics. |
GO Enhances Reprogramming via Mitochondrial Energy and Cell Cycle Pathways
To investigate the mechanism of GO, Gene Ontology enrichment analysis revealed that supplementing the RepSox induction system with GO significantly enhanced mitochondrial energy metabolism and cell cycle regulation pathway activities during reprogramming (Figure 8A and B). Along with the enrichment of these core functions, the functions related to epithelialization also show significant advantages. From induction day 4 onward, mammary development, lipid synthesis, and estrogen signaling pathways were progressively activated. Single-gene expression analysis identified markedly elevated levels of mitochondrial and energy markers (NDUFA2, NDUFA5, MRPL9, SDHD) and cell cycle markers (CDK1, CDK2, CCND1, CCNY) in R+GO groups (Figure 8C and D).
 |
Figure 8 GO Enrichment Analysis Reveals Molecular Mechanisms Underlying GO-Enhanced Transdifferentiation. (A) GO enrichment dot plot for Mitochondria and Energy, Cell Cycle, Epithelialization, Breast development, Lipid synthesis, and Estrogen signaling pathways in R+GO-2d vs R-2d, R+GO-4d vs R-4d, and R+GO-8d vs R-8d comparisons. (B) Line graphs showing expression trends of signature genes for Mitochondria and Energy, Cell Cycle, Epithelialization, Breast development, Lipid synthesis, and Estrogen signaling.(C) Line graphs of Mitochondria and Energy signature genes (NDUFA2, NDUFA5, MRPL9, SDHD). (D) Line graphs of Cell Cycle signature genes (CDK1, CDK2, CCND1, CCNY). |
The results of ATP detection related to mitochondrial energy metabolism indicated that the intracellular ATP levels in the R+GO group were significantly elevated compared to those in the control group at three specific time points: the 2nd, 4th, and 8th days of culture. This finding suggests an enhancement in mitochondrial energy generation capacity within the R+GO group (Figure 9A). Additionally, cell cycle assessment conducted through flow cytometry revealed a significant increase in the proportion of cells in the G1 phase for the R+GO group across all three time points (the 2nd, 4th, and 8th days of culture), effectively regulating cell cycle progression (Figure 9B). Subsequent qRT-PCR analysis further corroborated a marked upregulation of mitochondrial energy and cell cycle marker genes in the R+GO groups (Figure 9C).
 |
Figure 9 Mitochondrial energy metabolism and the cell cycle facilitate transdifferentiation. (A) ATP content levels in R and R+GO groups at 2 d, 4 d, and 8 d post-induction.n = 3 biological replicates. Data represent mean ± SEM. **p < 0.01, ***p < 0.001, (one-way ANOVA). (B) Cell cycle distribution in the R and R+GO groups on days 2, 4, and 8 post-induction. n = 3 biological replicates. (C) qRT-PCR validation of Mitochondria and Energy and Cell Cycle gene expression. n = 3 biological replicates. Data represent mean ± SEM. *p < 0.05, **p < 0.01, (one-way ANOVA). |
Discussion
Nanomaterials can induce changes in the epigenetics of cells, such as changes in DNA methylation levels, histone acetylation levels, and microRNAs, thereby regulating gene expression.22 Previous studies have found that using small molecule compounds can induce the transdifferentiation of fibroblasts into mammary epithelial cells, but the transdifferentiation efficiency is relatively low. In this study, during the process of using small molecule compounds to induce the transdifferentiation of fibroblasts into mammary epithelial cells, we added graphene oxide (GO) particles, which significantly promoted the transdifferentiation efficiency and enhanced the functionality of mammary epithelial cells within the same period of time.
The highly oxidized structure of GO endows it with better biocompatibility and permeability in the aqueous environment common in the human body, and it has the effect of promoting cell proliferation and enhancing cell viability.23,24 Our current research shows that GO at a concentration of 5 μg/mL can maximize the promotion of cell viability, and adding GO to the RepSox culture medium can also obtain trans - differentiated mammary epithelial cells. It is worth noting that GO can further promote the trans - differentiation efficiency and enhance the biological functions of trans - differentiated mammary epithelial cells.
Cell development and growth play an important role in cell transdifferentiation.25 In the early stage of transdifferentiation, when 5 μg/mL GO was added to the ReoSox induction medium, functions such as cell growth and development, establishment and maintenance of epithelial cells, and development and proliferation of epithelial cells were significantly enriched. In the middle and late stages, the R + 5 μg/mL GO group significantly activated the enrichment related to functions such as the fate determination of mammary epithelial cells and milk secretion, such as mammary gland development, phospholipid metabolism, glycerophospholipid synthesis, and estrogen receptors. Further analysis by RNA - seq revealed that this might be due to the activation of mitochondrial function and the cell cycle by GO. The cell cycle not only affects cell proliferation and differentiation but also directly participates in the regulation of somatic cell transdifferentiation and pluripotency maintenance.26 A GO concentration of 5 μg/mL can promote cell viability23 and cell proliferation, further promoting the positive development of the cell cycle.26 Changes in energy metabolism during transdifferentiation significantly promote mitochondrial function.26,27 After the addition of GO, mitochondrial function was significantly enhanced, indicating that GO may improve transdifferentiation efficiency by optimizing the energy metabolism pathway and promoting mitochondrial function.
Chemical reprogramming has great potential in disease treatment.28 Currently, it has been widely applied in fields such as tissue and organ regeneration, autologous cell transplantation, exploration of disease mechanisms, and drug toxicity evaluation, showing unprecedented potential in regenerative medicine and personalized patient treatment. Nanobiotechnology and nanomaterials have broad application prospects in the field of cell trans - differentiation. They are expected to play an important role in the medical and biomedical fields, promote innovation in tissue engineering and disease treatment, and bring new breakthroughs in clinical treatment.
Conclusion
Overall, this study found that graphene oxide (GO) can promote the RepSox-mediated cell reprogramming process by regulating mitochondrial energy metabolism and the cell cycle. This discovery greatly enhances the potential and practicality of nanomaterial assistance in cell fate regulation, regenerative medicine, and tissue engineering applications.
Ethical Statement
All animal procedures complied with the Code of Experimental Animal Welfare and Ethics of Guangxi University (Approval No. GXU-2023-111).
Author Contributions
All authors made a significant contribution to the work reported, whether that is in the conception, study design, execution, acquisition of data, analysis and interpretation, or in all these areas; took part in drafting, revising or critically reviewing the article; gave final approval of the version to be published; have agreed on the journal to which the article has been submitted; and agree to be accountable for all aspects of the work.
Funding
This research supported by the grants from the Natural Science Foundation of Guangxi (Grant No. 2023GXNSFBA026023, 2024GXNSFBA010021) and the National Natural Science Foundation of China (Grant No. 32160171).
Disclosure
The authors report no conflicts of interest in this work.
References
1. Takahashi K, Yamanaka S. Induction of pluripotent stem cells from mouse embryonic and adult fibroblast cultures by defined factors. Cell. 2006;126(4):663–17. doi:10.1016/j.cell.2006.07.024
2. Jin Y, Kim H, Min S, et al. Three-dimensional heart extracellular matrix enhances chemically induced direct cardiac reprogramming. Sci Adv. 2022;8(50):eabn5768. doi:10.1126/sciadv.abn5768
3. Kovatcheva M, Melendez E, Chondronasiou D, et al. Vitamin B12 is a limiting factor for induced cellular plasticity and tissue repair. Nat Metab. 2023;5(11):1911–1930. doi:10.1038/s42255-023-00916-6
4. Chen G, Guo Y, Li C, Li S, Wan X. Small molecules that promote self-renewal of stem cells and somatic cell reprogramming. Stem Cell Rev Rep. 2020;16(3):511–523. doi:10.1007/s12015-020-09965-w
5. Dayem AA, Choi HY, Yang G-M, et al. The potential of nanoparticles in stem cell differentiation and further therapeutic applications. Biotechnol J. 2016;11(12):1550–1560. doi:10.1002/biot.201600453
6. Malcor J-D, Hunter EJ, Davidenko N, et al. Collagen scaffolds functionalized with triple-helical peptides support 3D HUVEC culture. Regen Biomater. 2020;7(5):471–482. doi:10.1093/rb/rbaa025
7. Cheng C-M, KC-W W. Nanomaterials and nanofabrication for biomedical applications. Sci Technol Adv Mater. 2013;14(4):040301. doi:10.1088/1468-6996/14/4/040301
8. Faghihi F, Eslaminejad MB. The effect of nano-scale topography on osteogenic differentiation of mesenchymal stem cells. Biomed Pap Med Fac Univ Palacky Olomouc Czech Repub. 2014;158(1).
9. Banerjee AN. Graphene and its derivatives as biomedical materials: future prospects and challenges. Interface Focus. 2018;8(3):20170056. doi:10.1098/rsfs.2017.0056
10. Deng X, Liang H, Yang W, Shao Z. Polarization and function of tumor-associated macrophages mediate graphene oxide-induced photothermal cancer therapy. J Photochem Photobiol B Biol. 2020;208:111913. doi:10.1016/j.jphotobiol.2020.111913
11. Daniyal M, Liu B, Wang W. Comprehensive review on graphene oxide for use in drug delivery system. Curr Med Chem. 2020;27(22):3665–3685. doi:10.2174/13816128256661902011296290
12. Di Carlo R, Di Crescenzo A, Pilato S, et al. Osteoblastic differentiation on graphene oxide-functionalized titanium surfaces: an in vitro study. Nanomaterials. 2020;10(4):654. doi:10.3390/nano10040654
13. Jo SB, Erdenebileg U, Dashnyam K, et al. Nano-graphene oxide/polyurethane nanofibers: mechanically flexible and myogenic stimulating matrix for skeletal tissue engineering. J Tissue Eng. 2020;11:2041731419900424. doi:10.1177/2041731419900424
14. Adekoya GJ, Ezika AC, Adekoya OC, Sadiku ER, Hamam Y, Ray SS. Recent advancements in biomedical application of polylactic acid/graphene nanocomposites: an overview. BMEMat. 2023;1(4):e12042. doi:10.1002/bmm2.12042
15. Xu Y, Wang X, Wang Z, et al. Aminated graphene nanosheet stimulates the maturation of hiPSCs-derived cardiomyocytes in vitro and enhances their survival in vivo. BMEMat. 2025;3(3):e70005. doi:10.1002/bmm2.70005
16. Das S, Mazumdar H, Khondakar KR, Kaushik A. Machine learning integrated graphene oxide-based diagnostics, drug delivery, analytical approaches to empower cancer diagnosis. BMEMat. 2025;3(1):e12117. doi:10.1002/bmm2.12117
17. Bao D, Sun J, Gong M, et al. Combination of graphene oxide and platelet-rich plasma improves tendon–bone healing in a rabbit model of supraspinatus tendon reconstruction. Regenerat Biomater. 2021;8(6):rbab045. doi:10.1093/rb/rbab045
18. Ding M, Zhao D, Wei R, et al. Multifunctional elastomeric composites based on 3D graphene porous materials. Exploration. 2024;4(2):20230057. doi:10.1002/EXP.20230057
19. Romano M, Elgueta R, McCluskey D, et al. Pluripotent stem cell-derived hepatocytes inhibit T cell proliferation in vitro through tryptophan starvation. Cells. 2021;11(1):24. doi:10.3390/cells11010024
20. Zhang D, Wang G, Qin L, et al. Restoring mammary gland structures and functions with autogenous cell therapy. Biomaterials. 2021;277:121075. doi:10.1016/j.biomaterials.2021.121075
21. Xu W, Zhu W, Shen J, et al. Stepwise rapid electrolytic synthesis of graphene oxide for efficient adsorption of organic pollutants. Nanoscale. 2023;15(12):5919–5926. doi:10.1039/d2nr06617c
22. Duran N, Martinez D, Silveira PC, et al. Graphene oxide: a carrier for pharmaceuticals and a scaffold for cell interactions. Curr Topics Med Chem. 2015;15(4):309–327. doi:10.2174/1568026615666150108144217
23. Wang J, Wu Y, Wang Y, et al. Graphene oxide-coated patterned silk fibroin films promote cell adhesion and induce cardiomyogenic differentiation of human mesenchymal stem cells. Biomolecules. 2023;13(6):990. doi:10.3390/biom13060990
24. Podolska MJ, Barras A, Alexiou C, et al. Graphene oxide nanosheets for localized hyperthermia-physicochemical characterization, biocompatibility, and induction of tumor cell death. Cells. 2020;9(3):776. doi:10.3390/cells9030776
25. Guilbault GG, Kauffmann JM. Enzyme-based electrodes as analytical tools. Biotechnol Appl Biochem. 1987;9(2):95–113. doi:10.1111/j.1470-8744.1987.tb00466.x
26. Liu L, Michowski W, Kolodziejczyk A, Sicinski P. The cell cycle in stem cell proliferation, pluripotency and differentiation. Nat Cell Biol. 2019;21(9):1060–1067. doi:10.1038/s41556-019-0384-4
27. Bukowiecki R, Adjaye J, Prigione A. Mitochondrial function in pluripotent stem cells and cellular reprogramming. Gerontology. 2014;60(2):174–182. doi:10.1159/000355050
28. Harati J, Wang PY. Leveraging integrative technologies to translate stem cell and cell reprogramming potential for neurodegenerative diseases. Eur Cells Mater. 2024;48(2):151–155. doi:10.22203/eCM.v048a09
 © 2026 The Author(s). This work is published and licensed by Dove Medical Press Limited. The
full terms of this license are available at https://www.dovepress.com/terms
and incorporate the Creative Commons Attribution
- Non Commercial (unported, 4.0) License.
By accessing the work you hereby accept the Terms. Non-commercial uses of the work are permitted
without any further permission from Dove Medical Press Limited, provided the work is properly
attributed. For permission for commercial use of this work, please see paragraphs 4.2 and 5 of our Terms.
© 2026 The Author(s). This work is published and licensed by Dove Medical Press Limited. The
full terms of this license are available at https://www.dovepress.com/terms
and incorporate the Creative Commons Attribution
- Non Commercial (unported, 4.0) License.
By accessing the work you hereby accept the Terms. Non-commercial uses of the work are permitted
without any further permission from Dove Medical Press Limited, provided the work is properly
attributed. For permission for commercial use of this work, please see paragraphs 4.2 and 5 of our Terms.