Back to Journals » International Journal of Nanomedicine » Volume 10 » Supplement 1 Challenges in biomaterials research
Gold nanoparticles-immobilized, hierarchically ordered, porous TiO2 nanotubes for biosensing of glutathione
Authors Mers SV, Kumar ET, Ganesh V
Received 6 January 2015
Accepted for publication 18 March 2015
Published 1 October 2015 Volume 2015:10(Supplement 1 Challenges in biomaterials research) Pages 171—182
DOI https://doi.org/10.2147/IJN.S80054
Checked for plagiarism Yes
Review by Single anonymous peer review
Peer reviewer comments 2
Editor who approved publication: Dr Thomas Webster
SV Sheen Mers,1,2 Elumalai Thambuswamy Deva Kumar,1 V Ganesh1,2
1Electrodics and Electrocatalysis (EEC) Division, Council of Scientific and Industrial Research–Central Electrochemical Research Institute (CSIR–CECRI), Karaikudi, Tamil Nadu, India; 2Academy of Scientific and Innovative Research (AcSIR), New Delhi, India
Abstract: Glutathione (GSH) is vital for several functions of our human body such as neutralization of free radicals and reactive oxygen compounds, maintaining the active forms of vitamin C and E, regulation of nitric oxide cycle, iron metabolism, etc. It is also an endogenous antioxidant in most of the biological reactions. Given the importance of GSH, a simple strategy is proposed in this work to develop a biosensor for quantitative detection of GSH. This particular biosensor comprises of gold nanoparticles (Au NPs)-immobilized, hierarchically ordered titanium dioxide (TiO2) porous nanotubes. Hexagonally arranged, honeycomb-like nanoporous tubular TiO2 electrodes are prepared by using a simple electrochemical anodization process by applying a constant potential of 30 V for 24 hours using ethylene glycol consisting of ammonium fluoride as an electrolytic medium. Structural morphology and crystalline nature of such TiO2 nanotubes are analyzed using field emission scanning electron microscope (FESEM) and X-ray diffraction (XRD). Interestingly, nanocomposites of TiO2 with Au NPs is prepared in an effort to alter the intrinsic properties of TiO2, especially tuning of its band gap. Au NPs are prepared by a well-known Brust and Schiffrin method and are immobilized onto TiO2 electrodes which act as a perfect electrochemical sensing platform for GSH detection. Structural characterization and analysis of these modified electrodes are performed using FESEM, XRD, and UV-visible spectroscopic studies. GSH binding events on Au NPs-immobilized porous TiO2 electrodes are monitored by electrochemical techniques, namely, cyclic voltammetry (CV) and chronoamperometry (CA). Several parameters such as sensitivity, selectivity, stability, limit of detection, etc are investigated. In addition, Au NPs dispersed in aqueous medium are also explored for naked-eye detection of GSH using UV-visible spectroscopy in order to compare the performance of the proposed sensor. Our studies clearly indicate that these materials could potentially be used for GSH sensing applications.
Keywords: biosensor, electrochemistry, glutathione, gold nanoparticles, TiO2 nanotubes
Introduction
Glutathione (GSH), chemically described as γ-L-glutamyl-L-cysteinylglycine is one of the most important intracellular components in living organisms. Basically, it is an abundant nonprotein tripeptide amino acid compound consisting of a peptide linkage between the amine group of cysteine and the carboxylate group of glutamate side chains.1 In addition, it also possesses a thiol group which acts as a reducing functionality and serves as a targeting group for not only this compound but also for many biological thiol compounds. It exists in both oxidized (GSSG) and reduced (GSH) forms.1 This thiol-containing compound is crucial for many important biological functions in our body, such as performing oxidation–reduction cycles, synthesis of proteins, transportation of biological compounds, metabolism reactions, maintaining the active forms of vitamin C and E, regulation of nitric oxide cycle, etc.2,3 Detoxification of poisonous heavy metals including Hg, Pb, and cyanide in living cells is the primary and vital function of GSH.4 Moreover, this also helps in integration of red blood cells (RBC).5 Predominantly, GSH is employed as an antioxidant as it scavenges the free radicals generated within our human body and plays a key role as an anticancer agent. Imbalance of GSH levels in the cell causes several diseases such as vascular diseases, diabetes, strokes, anemia, etc.6–9 Usually, GSH prevents the cell from undergoing oxidative damage by scavenging the free radicals, which are particularly damaging to DNA and RNA, with the aid of maintaining the redox homeostasis thereby helping in the repair of DNA and RNA damages.10 Thus the molar ratio of oxidized and reduced forms of glutathione is vital in monitoring the functions of cells.11 Hence, there is an increasing demand to monitor the levels of GSH concentration for the betterment of human life.
Numerous methods have been reported for the detection of GSH that include colorimetric, electrochemical, and assay based sensing methods.12–16 Among these methods, very few reports specifically focused on the quantitative determination of GSH in addition to the usual qualitative detection. In general, electrochemical detection methods offer several advantages when compared with other methods in terms of sensing, with a particular emphasis on specificity, minimal response time, low cost, and ease of fabricating and handling the sensors. In these methods, mostly carbon-based electrodes were employed due to their specific characteristics like high surface area, good conduction ability for electron mobility, low cost, and few others.12–16 These carbon-based electrodes were chemically modified to meet the specificity of the target analyte, tune the electron transport across the electrode-electrolyte interface, and promote compatibility with the electrochemical measurement techniques. Usually, amine compounds, aryl acetates, and aliphatic alcohols were used for the chemical modification of such carbon electrodes.17,18 For some specific electrodes, diazonium salts were also employed for film formation, and this had been performed by carrying out electrochemical potential cycling process over the electrode surface.19 In other cases, conducting polymer20 coated electrodes such as poly-m-aminophenol modified glassy carbon electrodes21 and ferrocene-immobilized carbon paste electrodes were also utilized for electrochemical sensing of GSH. As far as TiO2 is concerned, to the best of our knowledge, only one paper by Raoof et al22 reported the use of where nano-TiO2/ferrocene carboxylic acid-modified carbon paste electrode for GSH detection. Apart from this, most of the colorimetric sensors of GSH are essentially based on gold nanoparticles (Au NPs) and their interaction with GSH resulting in specific color change.23–28 Nevertheless, an affordable and easy-to-monitor electrochemical-sensing platform for GSH detection is still a challenge and at exploratory level that opens up a new area for modulating the electron transport across the interface.
In this work, a new and alternative material is proposed for the electrochemical detection of GSH. This material is basically a composite material comprising a semiconducting titanium dioxide (TiO2) and metallic Au NPs. The main advantage of this composite material is the one-dimensional electron transport across the interface facilitated by the formation of uniform nanotubular structures of TiO2 and immobilization of Au NPs on these fascinating structures, which eventually leads to considerable increase in conductivity and, in turn, the sensing limits. TiO2 electrodes consisting of hierarchically ordered, nanoporous, tubular structures are prepared by a simple electrochemical anodization process. Field emission scanning electron microscope (FESEM) and X-ray diffraction (XRD) studies are employed for structural and morphological characterizations. Later, Au NPs are immobilized over these electrodes by following a simple physical adsorption process with an aim of tuning the band gap values. UV-visible (UV-vis) spectroscopy performed in diffuse reflectance mode is used for the determination of band gap values using Kubelka–Munk function. Further, these electrodes are explored for the electrochemical detection of GSH. Electrochemical techniques, namely, cyclic voltammetry (CV) and chronoamperometry (CA) are used to monitor the sensing events by measuring the changes associated with current values for each incremental addition of GSH. Moreover, Au NPs dispersed in aqueous solvent are also explored for the possibility of naked-eye detection of GSH. Preliminary experiments indicate that these nanoparticles help in distinguishing GSH from an amino acid cysteine through a measurable and visible color change. UV-vis spectroscopy is used for analyzing the color changes quantitatively. Our results clearly indicate that these materials could potentially be used for the quantitative determination and visual detection of GSH. These experiments are carried out for comparison of the sensor performance using both electrochemical and naked-eye detection methods.
Materials and methods
Chemicals
Ethylene glycol (SRL Chemicals, Mumbai, India), ammonium fluoride (Merck, Whitehouse Station, NJ, USA), GSH (Hi-Media, Mumbai, India), hydrogen tetrachloroaurate(III) trihydrate (Alfa Aesar, Ward Hill, MA, USA), and sodium borohydride (Sigma Aldrich, St Louis, MO, USA) were purchased and used without further purification. Millipore water having a resistivity of 18.2 MΩ cm obtained from a quartz distillation unit was used for making all the aqueous solutions and for the electrochemical experiments. Titanium plates (0.127 mm thick) possessing 99.7% metal purity were purchased from Sigma Aldrich and employed for the electrochemical anodization process to prepare TiO2 electrodes. These plates were cut into small pieces with a geometric area of 1×1 cm2 for further characterization and analyses.
Electrode processing
Titanium plates were cut into small pieces of predefined geometric area and sonicated with water and acetone sequentially for about 5 minutes each in order to clean the surface. Then the precleaned plates were developed as electrodes by connecting them with a copper wire using teflon and parafilm to cover the rest of area and have a predefined geometric area. Further, such electrodes were used as a working electrode. Platinum coil was used as a counter electrode. Prior to use, this electrode was washed by sonication with 1:1 ratio of concentrated nitric acid and millipore water. Saturated calomel electrode (SCE) was used as a reference electrode, and it was cleaned by rinsing with millipore water.
Electrochemical anodization
Nanoporous TiO2 electrode was prepared by a simple electrochemical anodization using a two-electrode system where the fabricated titanium plate was used as a working electrode (anode) and a platinum coil was used as a counter electrode (cathode). Anodization was carried out using ethylene glycol electrolytic medium containing 0.3 wt% ammonium fluoride and 2 vol% millipore water. The anodization process was continued for about 24 hours with a constant DC voltage of 30 V. After the anodization process, the anodized plate was taken out and sonicated for 1–3 minutes to remove any loosely bound TiO2 nanotubes, known as debris, and other impurities. Then, this plate was annealed at 450°C in the presence of air for about 6 hours to obtain pure, crystalline TiO2 nanotubes.
Preparation of gold nanoparticles (Au NPs)
Au NPs were prepared by the famous Brust and Schiffrin method by employing the reduction of a gold salt with sodium borohydride. Initially, 100 mL of 0.3 mM hydrogen tetrachloroaurate(III) trihydrate solution was prepared by dissolving 12 mg of this salt in 100 mL of millipore water. Later, 60 mM sodium borohydride solution was freshly prepared by dissolving 2.5 mg of this substance in 1 mL of millipore water. Then, Au NPs were obtained by adding fixed amount of sodium borohydride to 15 mL of gold solution. The effect of varying the amounts of sodium borohydride on the resultant Au NPs was analyzed by using different volumes viz 30, 40, 50, 60, and 70 μL. From this study, the optimum amount of sodium borohydride for obtaining uniform size of Au NPs was estimated to be 50 μL. The higher concentrations of sodium borohydride result in immediate coagulation of gold nanosolution leading to formation of a precipitate. The resultant Au NPs solution appears pale pink in color and was further analyzed and characterized using UV-vis absorption spectroscopy.
Immobilization of Au NPs onto nanoporous TiO2 electrodes
Further these Au NPs were immobilized onto TiO2 electrodes using a simple physical adsorption process, where the nanoporous TiO2 electrode was dipped into the Au NPs solution for about 12–14 hours. After immobilization, the electrode was taken out and washed thoroughly with millipore water. Interestingly, Au NPs anchored TiO2 electrodes exhibit a color change from its initial blue color to pale pink color after the immobilization. UV-vis spectroscopy obtained in diffuse reflection mode was utilized for the analysis and characterization of such modified electrodes. This particular process is crucial to obtain a good performance of the proposed sensor. Since the amount of Au NPs coated onto TiO2 is expected to affect several parameters of the sensor, it is very important to load an optimum amount of Au NPs. In this work, we adopted a simple physical adsorption process in which controlling the amount of loading is generally difficult. So, every time after the deposition of Au NPs onto TiO2 electrode, we measured the surface area of such modified electrodes using CV. Basically, we recorded CV in an aqueous solution of 0.5 M perchloric acid at a fixed scan rate of 50 mV/s. This CV displays a specific stripping peak corresponding to the Au deposit on the electrode surface. By integrating the charge associated with the peak formation, it is possible to determine the surface coverage and, in turn, the amount of loading of Au NPs. It is worth mentioning here that we estimated a surface coverage value that indicates almost 90%–95% of surface coverage of Au NPs onto TiO2 electrode. For repeated measurements using different electrodes, the deviation associated with the surface coverage value is calculated to be within 2%–3%, suggesting a good reproducibility of the proposed method for the sensor fabrication. In fact the method proposed for sensor fabrication is simple and possibly applicable for detection of a specific target analyte, in this case, GSH.
Electrochemical analysis of Au NPs anchored TiO2 electrodes for the detection of glutathione
Two well-known and popular electrochemical techniques, namely, CV and CA were used for the electrochemical analysis of Au NPs-immobilized TiO2 electrodes and, concomitantly, for the detection of GSH. A three-electrode setup was used for the studies in which the Pt coil was used as a counter electrode and SCE was employed as a reference electrode along with Au NPs-anchored TiO2 as a working electrode respectively. CV was recorded in an aqueous solution of phosphate buffered saline (PBS) of pH=7.0 under N2 atmosphere at a scan rate of 50 mV/s over a potential range from -0.6 to +0.2 V. For GSH-sensing experiments, a stock solution of a fixed concentration of GSH in PBS buffer solution was prepared, and the concentration was varied by incremental additions of 100 μL. For each and every addition, the corresponding CVs were recorded at a fixed scan rate. For CA studies, two different experiments were carried out by varying the concentration range of GSH. In one, primarily micromolar concentration and in another millimolar concentration of GSH were analyzed. Similar to CV, a fixed higher concentration of GSH stock solution was prepared, and for sensing experiments incremental addition of GSH was performed. CA studies were done by measuring the change in reduction current at a fixed potential of −0.45 V vs SCE with respect to time for increasing concentration of GSH in a stirred PBS buffer solution. Later, the measured current values were plotted against the added concentration of GSH and from that plot several parameters including sensitivity and limit of detection were determined. Further, Au NPs modified TiO2 electrodes were preserved in PBS aqueous buffer solution of pH=7.0 when not in use. For comparison, similar sensing experiments were also performed using TiO2 electrodes without Au NPs and Ti electrodes before anodization under similar conditions. All these experiments were carried out at room temperature.
Instrumentation
FESEM studies were performed using Hitachi model S3000H (Hitachi Ltd, Tokyo, Japan) which also has an EDAX facility attached. XRD studies were carried out using XPERTPRO multipurpose X-ray diffractometer procured from the Netherlands, using Cu Kα radiation with a wavelength of 1.540 Å. UV-vis analysis in both absorption mode and diffuse reflectance mode was performed using Perkin Elmer Lambda 650 with Infinite M200MPC model UV-Vis spectrophotometer (Perkin Elmer, Waltham, MA, USA). For diffuse reflectance measurements, a similar instrument attached with 60 mm integrated sphere detector module was used. These spectra were recorded over a wavelength range of 200–800 nm. Electrochemical studies were carried out using Electrochemical Impedance Analyzer model 6310, EG&G instruments obtained from Princeton Applied Research, Oak Ridge, TN, USA, and the echem software provided by them was used for the data collection and analysis. All the other parameters were shown in the respective diagram.
Results and discussion
Structural and morphological analysis of TiO2 and Au NPs immobilized TiO2 electrodes
Figure 1 shows FESEM images of bare Ti (Figure 1A) and anodized Ti (Figure 1B and C) plates using ethylene glycol electrolytic medium containing ammonium fluoride as an additive, leading to the formation of nanoporous TiO2. Anodization was carried out at an optimized voltage of 30 V for about 24 hours. It can be seen from the images that bare Ti (Figure 1A) shows no distinguishable structural features and the entire surface looks very smooth and homogeneous. On the contrary, anodized Ti plate (Figure 1B and C) depicts the formation of uniform porous structures with an array of nanotubes. These images display the structure of anodized Ti plates at different scales. The top surface of the as-prepared anodized plates was found to be covered with the broken nanotubes and other debris (Figure 1B). It is worth mentioning here that a simple sonication process in acetone or ethanol is employed to remove those loosely bound broken nanotubes and results in the formation of a more uniform and homogeneous array of nanotubes. Nevertheless, the formation of the honeycomb structure with ordered hexagonal arrangement of porous nanotubes is characteristic of this type of anodization process. These images clearly show the formation of beautiful ripples across the growth of the nanotubes (Figure 1C). These nanotubes are about 14-15 μm long, and the outer diameter of the tubes is ~150 nm with a wall thickness of about 15-20 nm. Detailed analysis of these images indicates that some of the pores seem to be a combination of two or three nanotubes (Figure 1B), suggesting the variation of current density distribution during anodization. In fact, during the initial stage of anodization, formation of hairy fiber-like structures was observed. Due to the fluctuations in current density arising out of conductivity associated with the electrolyte employed, thickness of the oxide layer formed, and the potential drop across the electrode–electrolyte interface, it eventually results in the formation of homogeneous, highly ordered hexagonal arrangement of arrays of porous nanotubes, leading to a honeycomb-like structure possessing an average pore diameter of ~100-120 nm, as is clearly evident from these images. Moreover, elemental mapping analysis of these anodized samples indicates the presence of Ti and oxygen suggesting the formation of pure TiO2 nanotubes during anodization. Furthermore, SEM image of Au NPs immobilized TiO2 electrode is also shown in Figure 1D. It can be noticed from the image that Au NPs are beautifully anchored onto TiO2 electrodes. These Au NPs are immobilized by simply dipping TiO2 electrodes in the Au NPs aqueous solution. Also, the average size of these immobilized Au NPs is determined to be ~200–400 nm. SEM analysis clearly indicates the formation of hierarchically ordered, porous nanotubular structures of TiO2 electrodes and the anchoring of Au NPs on top of these electrodes.
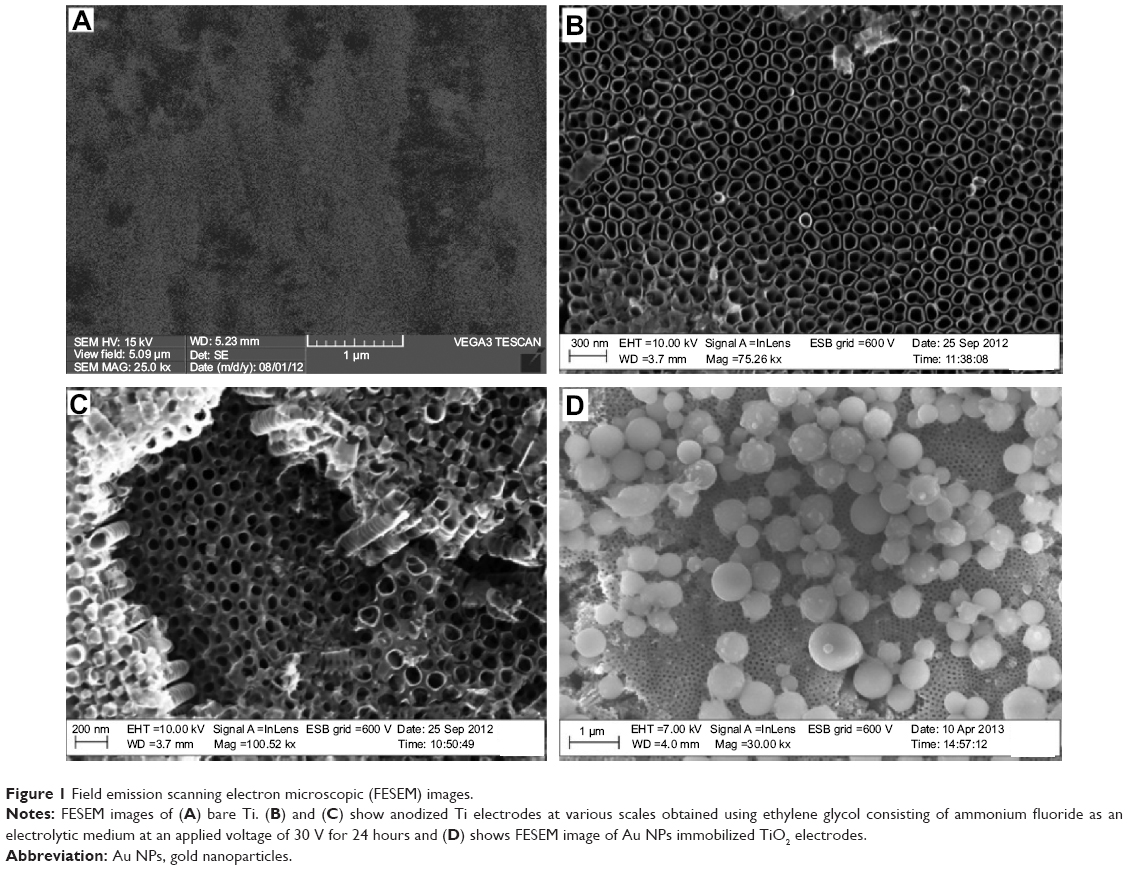 | Figure 1 Field emission scanning electron microscopic (FESEM) images. |
XRD studies
Phase purity and crystalline structure of the anodized Ti plates were characterized using XRD studies. Figure 2 shows the XRD pattern of bare Ti (before anodization; Figure 2A), anodized Ti (TiO2; Figure 2B) plates along with Au NPs immobilized TiO2 electrodes (Figure 2C). It can be noted from the picture that bare Ti (Figure 2A) displays a distinct prominent peak at 38.87° corresponding to the (002) plane and the other peaks at 35.65°, 40.65°, 53.39°, and 71.05° represent the existence of (100), (101), (102), and (103) planes of Ti respectively.29–32 On the other hand, anodized plates (Figure 2B) after annealing show the peaks at 25.89° and 63.41° corresponding to (101) and (110) planes associated with the anatase phase of TiO2 respectively,29–32 in addition to the peaks of underlying Ti substrate. Since TiO2 film formed after anodization was so thin when compared to base Ti metal, the peaks due to Ti were apparent and clearly visible. But, nevertheless these studies clearly demonstrate the formation of close-packing hexagonal arrangement of porous TiO2 nanotubes arrays that are crystalline anatase phase. Similarly, the formation of peaks at 38°, 44°, and 77° corresponding to (111), (200), and (311) planes of crystalline Au indicate the immobilization of Au NPs onto TiO2 electrodes (Figure 2C). Formation of the anatase phase of TiO2 is represented by “*”, and, similarly, the Au peaks are denoted by “▴” in Figure 2. These studies reveal that the resultant electrodes are of pure and crystalline nature.
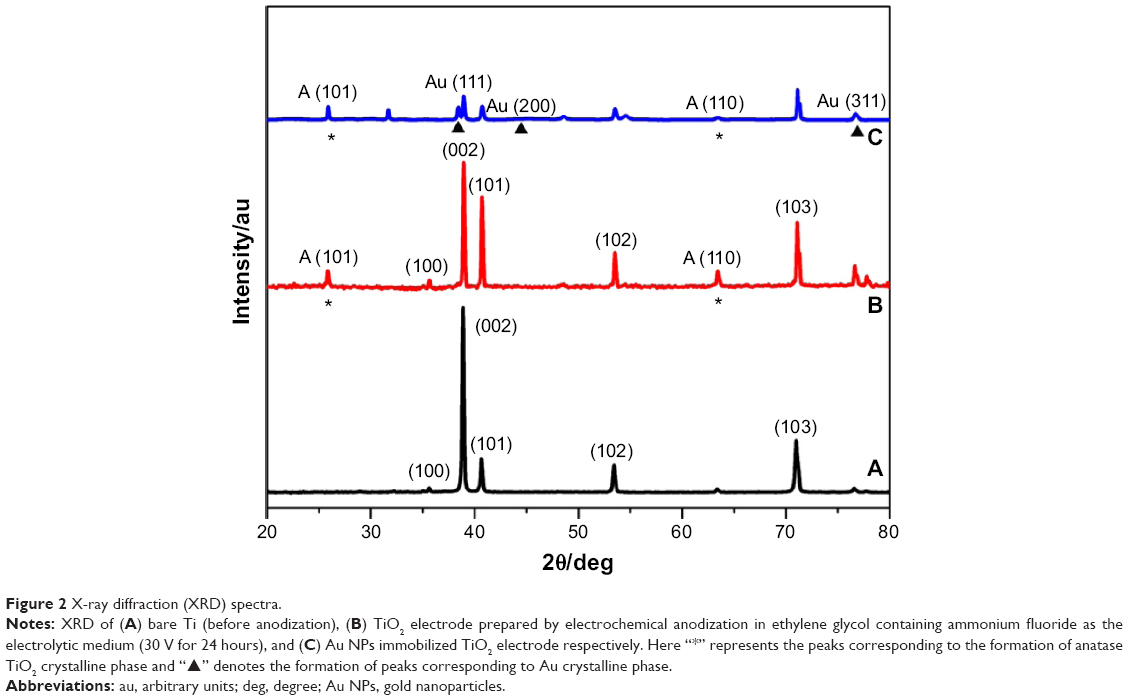 | Figure 2 X-ray diffraction (XRD) spectra. |
UV-vis spectroscopic analysis
From SEM and XRD analyses, it is understood that a simple electrochemical anodization of bare Ti results in the formation of hexagonally ordered, honeycomb-like, porous, nanotubular structures of TiO2 which are crystalline after annealing at 450°C and are in the anatase phase of TiO2. It is important to understand that these are electrodes made of Ti plates and TiO2 layer is formed as a thin film after anodization. UV-vis spectroscopy is used for further characterization and determination of band gap values of these electrodes since TiO2 is semiconductor in nature. These spectra are recorded in diffuse reflectance mode by measuring reflectance and not the usual absorption values. Figure 3 shows the UV-vis diffuse reflectance spectra of bare Ti, before anodization (Figure 3A), TiO2 produced by electrochemical anodization (Figure 3B), and Au NPs immobilized TiO2 electrodes (Figure 3C) respectively. It is clearly visible from these spectra that the TiO2 electrode (Figure 3B) does not show any characteristic peak; instead it shows a broad reflection almost covering the entire visible region from 300 to 800 nm. In contrast, bare Ti (Figure 3A) displayed a clear peak at 297 nm and a small kink at 250 nm due to reflections of Ti metal. Deeper analysis of these spectra suggests that the relative reflectance (R) value is very much lower, indicating the maximum absorption of light over a wide wavelength region in the case of TiO2 electrodes. This peculiar phenomenon can be employed for biosensing applications where the molecules that absorb in the visible region could be easily detected with enhanced absorption without the addition of any dopants or sensitizers. Band gap values of these porous TiO2 nanotubes were determined from this spectrum by converting the absolute reflection values to Kubelka–Munk function,33–35 and the value is determined to be 3.2 eV, which is very similar to semiconductive TiO2 material. Similarly, the corresponding spectrum for Au NPs-immobilized TiO2 electrode is also shown in Figure 3C. Compared to TiO2, these electrodes display slightly higher reflection values and an additional peak at 530 nm due to the presence of Au NPs. Band gap value in this case is determined to be 2.23 eV. It is interesting to note that on adding GSH to Au NPs anchored TiO2 electrodes, the peak at 530 nm is observed to decrease with increasing concentration of GSH. It is well-known that sulfur present in GSH has a higher binding affinity to gold, and on increasing the concentration of GSH, the activity of gold may be prevented due to enhanced binding, eventually leading to disappearance of Au peak. This phenomenon is further investigated using electrochemical technique.
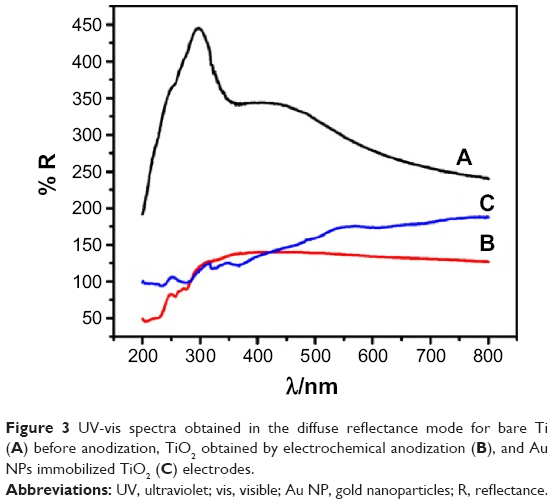 | Figure 3 UV-vis spectra obtained in the diffuse reflectance mode for bare Ti (A) before anodization, TiO2 obtained by electrochemical anodization (B), and Au NPs immobilized TiO2 (C) electrodes. |
It is well known in literature that Au NPs solution is mostly used for the development of colorimetric sensor for GSH.23–28 In this work, we also explored the possibility of developing colorimetric GSH sensor using Au NPs prepared by the Brust–Schiffrin method in order to compare the performance of the proposed sensor. Usually, the naked-eye detection of GSH based on the color change works at a higher concentration (in the range of millimolar concentrations). Also, this method suffers from several disadvantages, including the ability of the observer to distinguish the color variation and the tedious procedure associated with the protocol, etc. In order to overcome these problems, in this work we proposed an electrochemical method for the detection of GSH. For comparison, in this work, aqueous solution-based absorption mode for GSH sensing is also analyzed using UV-vis spectroscopy and the corresponding spectra are shown in Figure 4. In this figure, UV-vis spectra of as-prepared Au NPs (Figure 4A) using sodium borohydride reduction method, GSH added Au NPs solution (Figure 4B), and cysteine added Au NPs solution (Figure 4C), respectively, were displayed. Formation of a sharp peak at 503 nm in the case of as-prepared Au NPs which is pink in color is due to the presence of surface plasmon resonance of Au NPs. Interestingly, addition of 1 mM GSH results in a clear color change from pink to colorless, ultimately leading to the formation of a settling black precipitate (Figure 4, Inset c). This also results in a significant shift in the absorption peak to a higher wavelength at 570 nm due to the higher binding affinity of sulfur to gold, leading to the aggregation of particles that settle as a black precipitate. Similarly, cysteine, an amino acid, is also added to Au NPs solution and the corresponding spectrum is shown in Figure 4C. In this case, the color changes from pink to blue upon adding 1 mM of cysteine. It can also be noted that there is a very little shift in the absorption peak to 530 nm. The inset in Figure 4 shows the photographs indicating the color of the original Au NPs solution and the color change due to the addition of GSH and cysteine. It can clearly be seen that the as-prepared Au NPs are pink (Figure 4, Inset a) in color and upon adding GSH it becomes colorless with the formation of a black precipitate (Figure 4, Inset b) in contrast to the addition of cysteine where it results in formation of blue color (Figure 4, Inset c). Keeping this in mind, a naked-eye detection method for GSH sensing is demonstrated. By varying the concentrations of GSH and cysteine added to Au NPs solution, the absorbance spectra were analyzed. The corresponding UV-vis spectra for addition of different concentrations of cysteine and GSH are shown in Figure 5A and B respectively. The concentrations were varied from 1 to 7 mM, and, for comparison, UV-vis spectrum of Au NPs before adding either cysteine or GSH is also shown. In these figures, arrows indicate the direction of increasing concentrations of the added analyte. In the case of cysteine (Figure 5A), increasing concentrations result in decrease of absorbance values with a very small shift. On the contrary, addition of GSH (Figure 5B) leads to a clear shift in the absorption peaks, and further increase in concentration results in significant decrease in the peak intensity values. In order to quantify these results, a plot of change in intensity with respect to increasing concentration of analyte was determined and analyzed. The corresponding plots for cysteine and GSH additions are shown in Figure 5C and D respectively. A linear decrease in absorbance with increasing concentrations of added analyte is observed. From these plots, a sensitivity value of 1.1024 abs/mM and 1.4837 abs/mM was calculated for cysteine and GSH respectively. Although the limit of detection is estimated to be 0.04 mM for cysteine and 0.07 mM for GSH, a color change was visible to naked eye only at 1 mM concentration. These studies clearly indicate that Au NPs are immobilized onto TiO2 electrodes and that solution-based analysis could be used for naked-eye detection of higher concentrations of GSH and cysteine. Further, a quantitative detection is explored with Au NPs-anchored TiO2 electrodes using the electrochemical method with the aim to enhance sensitivity and to bring down the detection limit. Moreover, a sensor should work over a wide range of concentrations, and the electrochemical detection method offers such a possibility.
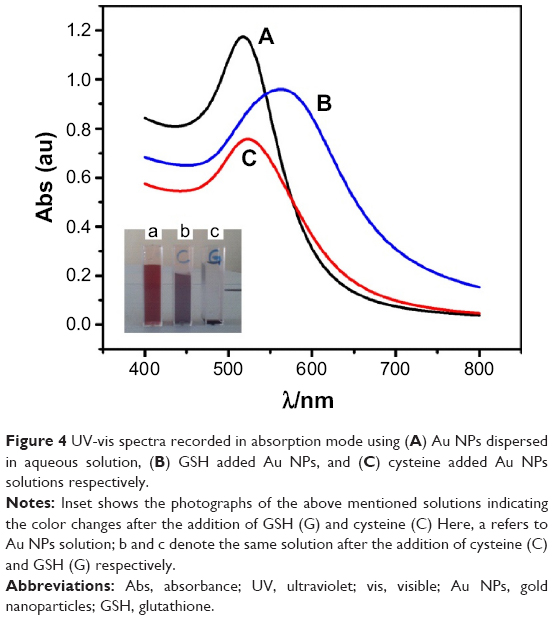 | Figure 4 UV-vis spectra recorded in absorption mode using (A) Au NPs dispersed in aqueous solution, (B) GSH added Au NPs, and (C) cysteine added Au NPs solutions respectively. |
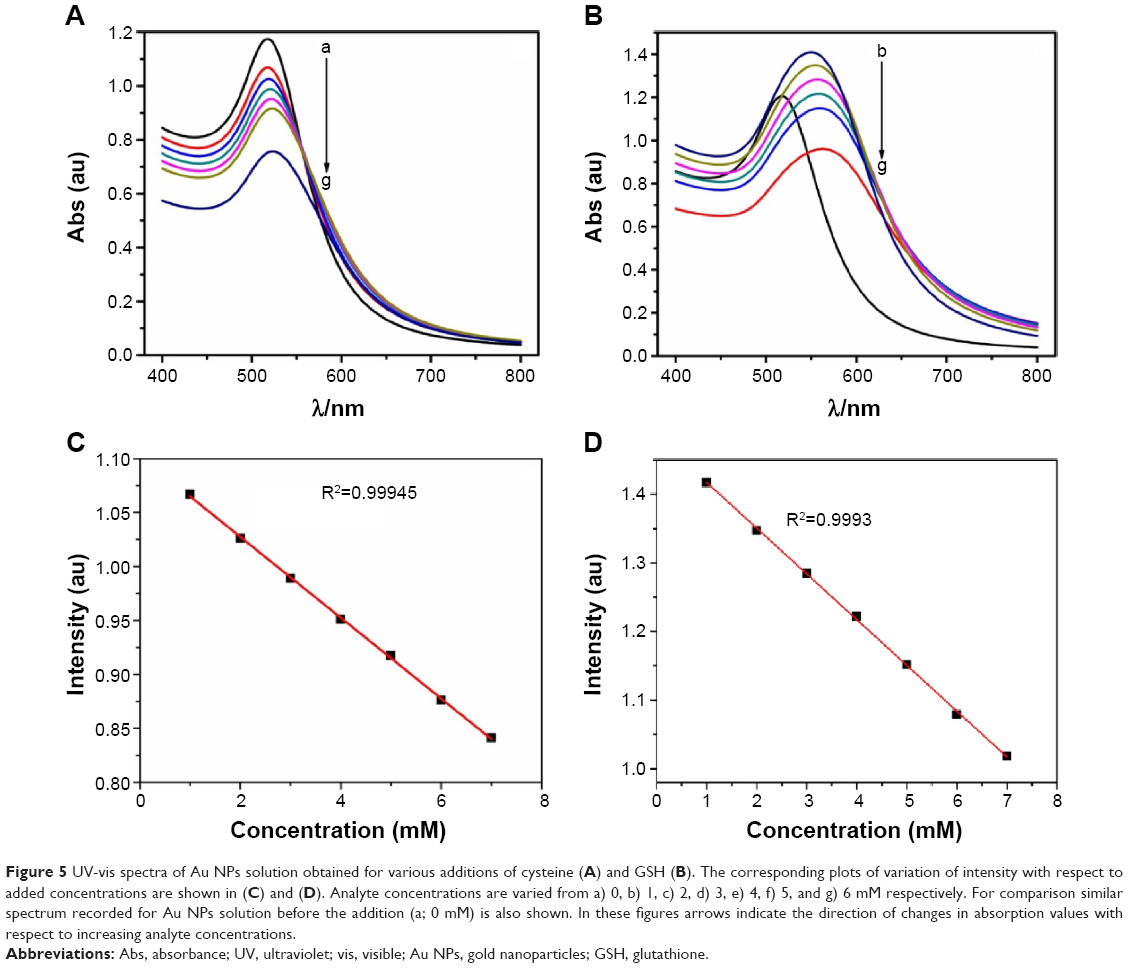 | Figure 5 UV-vis spectra of Au NPs solution obtained for various additions of cysteine (A) and GSH (B). The corresponding plots of variation of intensity with respect to added concentrations are shown in (C) and (D). Analyte concentrations are varied from a) 0, b) 1, c) 2, d) 3, e) 4, f) 5, and g) 6 mM respectively. For comparison similar spectrum recorded for Au NPs solution before the addition (a; 0 mM) is also shown. In these figures arrows indicate the direction of changes in absorption values with respect to increasing analyte concentrations. |
Electrochemical characterization of Au NPs-immobilized TiO2 electrodes and detection of GSH using CV and CA techniques
Electrochemical techniques, namely, CV and CA were used for the electrochemical characterization and detection of GSH using Au NPs-anchored TiO2 electrodes. CV studies were carried out in an aqueous solution of PBS buffer having pH=7.0 at a fixed scan rate of 50 mV/s over a potential ranging from -0.6 V to +0.2 V vs SCE, and the corresponding voltammograms are displayed in Figure 6. Initially, Au NPs-immobilized TiO2 electrode was analyzed before adding any GSH in order to understand the electrochemical behavior of the electrode. The CV recorded for such an electrode is shown in Figure 6 as A. This CV clearly exhibits a redox peak formation corresponding to Au suggesting the formation of oxide during the forward scan and the stripping peak during the reverse scan. Appearance of the anodic peak at -0.05 V and the reduction peak at -0.385 V due to the redox property of gold in PBS buffer is apparent, suggesting the formation of Au NPs film onto TiO2 electrodes. On adding GSH, the redox current is decreased due to the binding of GSH to Au NPs. Each and every addition of GSH results in a systematic decrease of redox current in the case of both anodic and cathodic peaks. The corresponding CVs with respect to increasing concentrations of GSH are shown in Figure 6. It can be noted that the redox current due to Au NPs decreased after incremental addition of GSH starting from 1 mM GSH. It was observed using CV studies that the addition of lower concentration of GSH in terms of micromolar concentrations results in no measurable current change. This reveals the inability of CV to distinguish a minor current change with respect to addition of minimum concentration of GSH. Furthermore, a superior sensitive technique such as CA is employed for investigating the binding events of GSH to Au NPs-immobilized TiO2 electrodes.
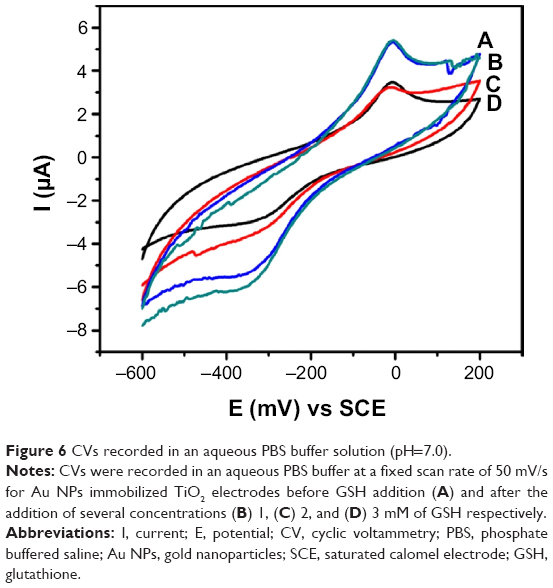 | Figure 6 CVs recorded in an aqueous PBS buffer solution (pH=7.0). |
Basically, in CA technique the change in current value is measured with respect to time at a fixed potential for varying analyte concentrations. In this work, CA studies related to GSH sensing experiments were carried out at a fixed potential of -0.45 V vs SCE, and the corresponding chronoamperograms are shown in Figure 7. We have analyzed a wide concentration of GSH ranging from μM to mM concentrations. Figure 7A displays the chronoamperometric plot corresponding to lower concentrations (in the range of μM) of GSH, and, similarly, Figure 7B depicts the same plot for higher concentrations (in the range of mM) of GSH, respectively. The corresponding GSH concentration values are displayed in the figure. It can be clearly seen from these figures that the current values change systematically with respect to increasing concentrations of GSH. In fact, in the lower concentration range, since the change in current value is very small, the resultant plot is somewhat noisy. Nevertheless, the changes in current values are evident. Similarly, higher concentrations of GSH lead to a clear and obvious change in current value, and in this case, particularly, the signal-to-noise ratio is quite significant, resulting in a systematic change. Another interesting feature is that the addition of higher concentration of GSH beyond 7 mM leads to a kind of saturation in the current values suggesting the possible occupation of all the active sites by the analyte GSH molecule on the sensor matrix. Moreover, the respective plots of change in current values with respect to added GSH concentrations are shown in Figure 7C and D. A linear variation of current with respect to concentration is noted for μM concentrations of GSH. On the contrary, for higher concentrations, viz, mM GSH, an initial linear region (Figure 7D, Inset) followed by saturation in the current values beyond 7 mM GSH concentration is noted. From this plot, several parameters, namely sensitivity, limit of detection, etc were determined. For lower concentrations, a sensitivity of 5.6497 μA/μM and a limit of detection of 1.3 μM was estimated. Similarly for higher concentrations, a sensitivity of 1.4117 μA/mM and a detection limit of 0.15 mM was determined. Noticeably, these values are very good when compared to the similar values determined using the UV-vis spectroscopy studies described earlier. A significant improvement in terms of sensitivity and detection limit is achieved through electrochemical studies. These values are also quite impressive in comparison to other electrochemical GSH sensors reported.1,12,15,20–22 Importantly, the response time is estimated to be less than 5 seconds, and this particular sensor works for a wide range of GSH concentrations, from the μM to mM range. This is agreeable because GSH concentration varies from place to place in our human body. For example, in the extracellular region the concentration of GSH is in the order of μM, and in liver cells it is in the order of mM. Also, it is worth mentioning here that neither bare Ti nor TiO2 is sensitive to GSH additions and no redox peaks were observed in those studies. This clearly suggests that Au NPs are essential for GSH sensing and facilitate the electron transfer across the interface, which is critical for developing sensors.
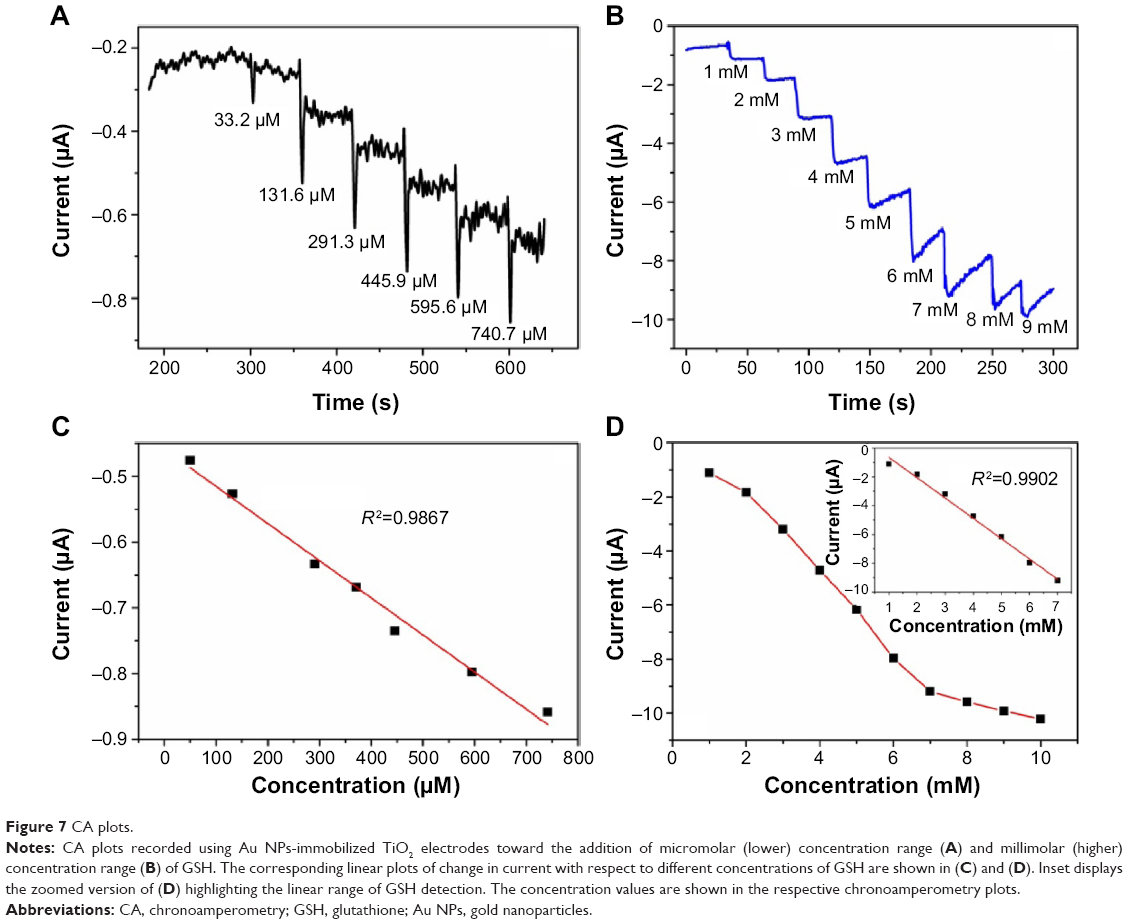 | Figure 7 CA plots. |
Reproducibility, stability, and selectivity analyses
From our experimental results, it is understood that the proposed electrochemical sensor works well for the detection of GSH. Furthermore, several other critical parameters namely stability, selectivity, and reproducibility were also investigated using electrochemical studies. Even after repeated measurements with a time period of once in 7 days over a period of 45 days, this particular electrode displayed only 3%–5% reduction in current values for GSH detection suggesting a good stability of the electrode material. Similarly, the values reported above are an average value of three different measurements. Reproducibility of Au NPs-immobilized TiO2 electrodes was analyzed by recording CA plots for three different electrodes for three independent measurements. It was observed that there was retention of 95%–98% reduction current value indicating the reliable reproducibility of the proposed sensor. Moreover, we analyzed the selectivity of this sensor by studying with other possible potential interferents namely glucose, uric acid, ascorbic acid, dopamine, etc. The results clearly reveal that this sensor is selective to GSH only since the mechanism of detection in this case is based on the reduction current change at a negative potential of -0.45 V, which is close to the E1/2 potential of enzymatic reaction for GSH detection. Interestingly, all these interferent molecules are usually detected by oxidation process and did not interfere in GSH sensing method. These studies suggest the potential use of Au NPs-immobilized TiO2 electrode as a selective electrochemical biosensor for GSH.
Based on our experimental observation, we postulated a possible mechanism for GSH detection using Au NPs-immobilized nanoporous TiO2 electrodes. Due to the higher binding affinity of thiols to the Au surface, as soon as the GSH is added, it binds to Au NPs through thiolate linkage forming a strong, polar Au-S bond. During the electrochemical cycling, this adsorbed layer prevents the striping of Au oxide resulting in the reduction of current values. Further addition of GSH completely covers the surface of Au NPs. During CA studies, at a fixed potential, the reduction cycling results in the cleavage of the bond formed earlier during the adsorption of GSH, leading to increase in the reduction current values. This is clearly evident from the systematic change in current values for the higher concentrations of GSH. Overall, this work highlights and demonstrates a simple strategy to fabricate an electrochemical biosensor for GSH detection using Au NPs-anchored nanoporous, tubular TiO2 electrode.
Conclusion
An electrochemical biosensor for GSH is proposed in this work. This sensor essentially comprises of nanoporous, tubular TiO2 electrodes coated with Au NPs. Hexagonally ordered, honeycomb-like arrangement of porous, nanotubular structures of TiO2 are prepared easily by a simple electrochemical anodization in ethylene glycol containing ammonium fluoride as an electrolytic medium. Structural and morphological analyses of such TiO2 electrodes are carried out using FESEM and XRD studies. Interestingly, the possibility of employing such a highly nanoporous, tubular, semiconductive TiO2 electrode for electrochemical biosensor application is explored by anchoring Au NPs over these electrodes. Basically, Au NPs provide a good electron transport across the electrode-electrolyte interface and facilitate the redox reaction associated with GSH detection. Electrochemical techniques, namely, CV and CA are used for monitoring the sensing process. In addition, naked-eye detection of GSH using Au NPs based on the color change is also explored by distinguishing it from other well-known amino acid like cysteine. This particular electrochemical biosensor for GSH works in a wide range of GSH concentration ranging from μM to mM and possesses a rapid response time of less than 5 seconds.
Acknowledgments
The authors acknowledge the funding for this research work from Council of Scientific and Industrial Research (CSIR), India, through the 12th 5-year plan network project (Molecules to Materials to Devices [M2D]) with a project number CSC 0134 and from Department of Science and Technology (DST), India, through Fast Track Scheme for Young Scientists having a project number GAP 16/10. The authors are also thankful to Central Instrumentation Facility (CIF) of CSIR–CECRI (Central Electrochemical Research Institute), Karaikudi, for providing the characterization facilities.
Disclosure
The abstract of this paper was presented at the National Conference on Challenges in Biomaterials Research (NCCBMR’13) held at Vellore Institute of Technology (VIT), India, as a poster presentation with interim findings. The poster’s abstract was published as a book of abstracts provided in the conference. The actual paper, however, has never been published. The authors report no other conflicts of interest.
References
Raoof JB, Ojani R, Kolbadinezhad M. Voltammetric sensor for glutathione determination based on ferrocene-modified carbon paste electrode. J Solid State Electrochem. 2009;13:1411–1416. | ||
Meiser A, Anderson M. Glutathione. Annu Rev Biochem. 1983;52:711–760. | ||
Hrbac J, Kohen R. Biological redox activity: its importance, methods for its quantification and implication for health and disease. Drug Dev Res. 2000;50:516–527. | ||
Boyland E, Chasseaud LF. The role of glutathione and glutathione S-transferases in mercapturic acid biosynthesis. Adv Enzymol. 1969;32:173–219. | ||
Chen J, He Z, Liu H, Cha C. Electrochemical determination of reduced glutathione (GSH) by applying the powder microelectrode technique. J Electoanal Chem. 2006;588:324–330. | ||
Roederer M, Ela SW, Staal FJT, Herzenberg LA. N-acetylcysteine: a new approach to anti-HIV therapy. AIDS Res Hum Retrovir. 1992;8:209–217. | ||
Meister A. Glutathione, ascorbate, and cellular protection. Cancer Res. 1994;54:1969s–1975s. | ||
Staal FJT, Ela SW, Roederer M, Anderson MT, Herzenberg LA. Glutathione deficiency and human immunodeficiency virus infection. Lancet. 1992;339:909–912. | ||
Cerutti PA. Prooxidant states and tumor promotion. Science. 1985;227:375–381. | ||
Yan L, Ping W, Hu X, Hua Z, Xinhua Z. Anti-aggregation of gold nanoparticle-based colorimetric sensor for glutathione with excellent selectivity and sensitivity. Analyst. 2011;136:196–200. | ||
Monostori P, Wittmann G, Karg E, Turi S. Determination of glutathione and glutathione disulfide in biological samples: an in-depth review. J Chromatogr B Anal Technol Biomed Life Sci. 2009;877:3331–3346. | ||
Kausaite A, Ramanaviciene A, Ramanavicius A. Application of immobilized citrate lyase in a bioanalytical system for determination of citrates. Chemija. 2008;19:9–12. | ||
Gorton L, Lindgren A, Larsson T, Munteanu FD, Ruzgas T, Gazargan I. Direct electron transfer between heme-containing enzymes and electrodes as basis for third generation biosensors. Anal Chim Acta. 1999;400:91–108. | ||
Jacobs CB, Peairs MJ, Venton B. Carbon nanotube based electrochemical sensors for biomolecules. Anal Chim Acta. 2010;662:105–127. | ||
Oztekin Y, Krikstolaityte V, Ramanaviciene A, Yazicigil Z, Ramanavicius A. 1,10-Phenanthroline derivatives as mediators for glucose oxidase. Biosens Bioelectron. 2010;26:267–270. | ||
Zhao C, Meng Y, Shao C, Wan L, Jiao K. Unadulterated glucose biosensor based on direct electron transfer of glucose oxidase encapsulated chitosan modified glassy carbon electrode. Electroanalysis. 2008;20:520–526. | ||
Buriez O, Labbe E, Pigeon P, Jaouen G, Amatore C. Electrochemical attachment of a conjugated amino–ferrocifen complex onto carbon and metal surfaces. J Electroanal Chem. 2008;619:169–175. | ||
Oztekin Y, Yazicigil Z, Sollak AO, Kilic Z, Bilge S. Surface modification and characterization of phenanthroline nanofilms on carbon substrate. Surf Interface Anal. 2010;43:923–930. | ||
Ustundag Z, Solak AO. EDTA modified glassy carbon electrode: preparation and characterization. Electrochim Acta. 2009;54:6426–6432. | ||
Ramanavicius A, Ramanaviciene A, Malinauskas A. Electrochemical sensors based on conducting polymer – polypyrrole. Electrochim Acta. 2006;51:6025–6037. | ||
Oztekin Y, Ramanaviciene A, Ramanavicius A. Electrochemical glutathione sensor based on electrochemically deposited poly-m-aminophenol. Electroanalysis. 2011;23:701–709. | ||
Raoof JB, Ojani R, Baghayeri M. Simultaneous electrochemical determination of glutathione and tryptophan on a nano-TiO2/ferrocene carboxylic acid modified carbon paste electrode. Sens Actuators B Chem. 2009;143:261–269. | ||
Li Y, Wu P, Xu H, Zhang H, Zhong X. Anti-aggregation of gold nanoparticle-based colorimetric sensor for glutathione with excellent selectivity and sensitivity. Analyst. 2011;136:196–200. | ||
Lim IS, Mott D, Ip W, et al. Interparticle interactions in glutathione mediated assembly of gold nanoparticles. Langmuir. 2008;24:8857–8863. | ||
Zhang FX, Han L, Israel LB, et al. Colorimetric detection of thiol-containing amino acids using gold nanoparticles. Analyst. 2002;127:462–465. | ||
Sudeep PK, Joseph ST, Thomas KG. Selective detection of cysteine and glutathione using gold nanorods. J Am Chem Soc. 2005;127:6516–6517. | ||
Uehara N, Ookubo K, Shimizu T. Colorimetric assay of glutathione based on the spontaneous disassembly of aggregated gold nanocomposites conjugated with water-soluble polymer. Langmuir. 2010;26:6818–6825. | ||
Xu H, Wang Y, Huang X, Li Y, Zhang H, Zhong X. Hg2+ mediated aggregation of gold nanoparticles for colorimetric screening of biothiols. Analyst. 2012;137:924–931. | ||
Pauloose M, Prakasam HE, Varghese OK, et al. TiO2 nanotube arrays of 1,000 μm length by anodization of titanium foil:phenol red diffusion. J Phys Chem C. 2007;111:14992–14997. | ||
Yoriya S, Grimes CA. Self-assembled anodic TiO2 arrays: electrolyte properties and their effect on resulting morphologies. J Mater Chem. 2011;21:102–108. | ||
Hanzu I, Djenizian T, Knauth P. Electrical and point defect properties of TiO2 nanotubes fabricated by electrochemical anodization. J Phys Chem C. 2011;115:5989–5996. | ||
Baram N, Ein-Eli Y. Electrochemical impedance spectroscopy of porous TiO2 for photocatalytic applications. J Phys Chem C. 2010;114:9781–9790. | ||
Murphy AB. Band-gap determination from diffuse reflectance measurements of semiconductor films and application to photoelectrochemical water-splitting. Solar Energy Mater Solar Cells. 2007;91:1326–1337. | ||
Anderson C, Bard AJ. Improved photocatalytic activity and characterization of mixed TiO2/SiO2 and TiO2/Al2O3 materials. J Phys Chem B. 1997;101:2611–2616. | ||
Yu J, Yu X. Hydrothermal synthesis and photocatalytic activity of zinc oxide hollow spheres. Environ Sci Technol. 2008;42:4902–4907. |
 © 2015 The Author(s). This work is published and licensed by Dove Medical Press Limited. The
full terms of this license are available at https://www.dovepress.com/terms
and incorporate the Creative Commons Attribution
- Non Commercial (unported, 3.0) License.
By accessing the work you hereby accept the Terms. Non-commercial uses of the work are permitted
without any further permission from Dove Medical Press Limited, provided the work is properly
attributed. For permission for commercial use of this work, please see paragraphs 4.2 and 5 of our Terms.
© 2015 The Author(s). This work is published and licensed by Dove Medical Press Limited. The
full terms of this license are available at https://www.dovepress.com/terms
and incorporate the Creative Commons Attribution
- Non Commercial (unported, 3.0) License.
By accessing the work you hereby accept the Terms. Non-commercial uses of the work are permitted
without any further permission from Dove Medical Press Limited, provided the work is properly
attributed. For permission for commercial use of this work, please see paragraphs 4.2 and 5 of our Terms.