Back to Journals » OncoTargets and Therapy » Volume 13
Gluconokinase IDNK Promotes Cell Proliferation and Inhibits Apoptosis in Hepatocellular Carcinoma
Authors Wu XM, Jin C, Gu YL, Chen WQ, Zhu MQ, Zhang S, Zhang Z
Received 10 October 2019
Accepted for publication 13 February 2020
Published 26 February 2020 Volume 2020:13 Pages 1767—1776
DOI https://doi.org/10.2147/OTT.S234055
Checked for plagiarism Yes
Review by Single anonymous peer review
Peer reviewer comments 2
Editor who approved publication: Dr Arseniy Yuzhalin
Xiao-Min Wu,1,* Cheng Jin,2,* Yuan-Long Gu,2 Wu-Qiang Chen,2 Mao-Qun Zhu,2 Shuo Zhang,2 Zhen Zhang1
1Department of Integrated Traditional Chinese and Western Medicine Oncology, Affiliated Hospital of Jiangnan University, Wuxi, Jiangsu 214062, People’s Republic of China; 2Department of Hepatobiliary Surgery, Affiliated Hospital of Jiangnan University, Wuxi, Jiangsu 214041, People’s Republic of China
*These authors contributed equally to this work
Correspondence: Cheng Jin
Department of Hepatobiliary Surgery, Affiliated Hospital of Jiangnan University, 585 Xingyuan Road, Wuxi, People’s Republic of China
Tel +8613338770679
Email [email protected]
Purpose: Hepatocellular carcinoma (HCC) is one of the deadliest cancers globally with a poor prognosis. Breakthroughs in the treatment of HCC are urgently needed. This study explored the role of IDNK in the development and progression of HCC.
Methods: IDNK expression was suppressed using short hairpin (shRNA) in BEL-7404 and Huh-7 cells. The expression of IDNK in HCC cells after IDNK knockdown was evaluated by real-time quantitative RT-PCR analysis and Western blot. After IDNK silencing, the proliferation and apoptosis of HCC cells were evaluated by Celigo cell counting, flow cytometry analysis, MTT assay, and caspase3/7 assay. Gene expressions in BEL-7404 cells transfected with IDNK shRNA lentivirus plasmid and blank control plasmid were evaluated by microarray analysis. The differentially expressed genes induced by deregulation of IDNKwere identified, followed by pathway analysis.
Results: The expression of IDNK at the mRNA and protein levels was considerably reduced in shRNA IDNK transfected cells. Knockdown of IDNK significantly inhibited HCC cell proliferation and increased cell apoptosis. A total of 1196 genes (585 upregulated and 611 downregulated) were differentially expressed in IDNK knockdown BEL-7404 cells. The pathway of tRNA charging with Z-score = − 3 was significantly inhibited in BEL-7404 cells with IDNK knockdown.
Conclusion: IDNK plays a key role in the proliferation and apoptosis of HCC cells. IDNK may be a candidate therapeutic target for HCC.
Keywords: hepatocellular carcinoma cells, shRNA IDNK, cell proliferation, cell apoptosis, microarray, differentially expressed gene
Introduction
Hepatocellular carcinoma (HCC) is the main type of primary liver cancer and is the leading cause of cancer-related death in patients with cirrhosis.1 HCC is one of the most common cancers in Southeast Asia and it is more commonly diagnosed in men than women. Chronic liver disease is the main cause for HCC. Other risk factors include viral hepatitis, aflatoxin, alcoholism, and other diseases.2–4 An estimated 662,000 deaths are attributed to HCC annually. Of these global deaths, half are in China.5 HCC is the one of the deadliest tumors in China and 90% of cases involve hepatitis virus B infection. The prognosis for HCC patients is poor. The median survival time of 3 months several decades ago has been improved to 1 year with advancements in therapy.6 HCC is an increasing global burden and breakthrough treatment management strategies are urgently needed.
Gluconate is a glucose derivative that is abundant in fruits, honey, vegetables, and wine. Clinically, gluconate can be used as a neutral carrier of ions for treatment of ion deficiencies and can be combined with other drugs as an antiseptic in surgery.7,8 Citrate is reportedly a central substrate that is beneficial for metabolism of cancer cells. Citrate is taken up by cancer cells through plasma membrane citrate transporter (pmCiC).9 Recent evidence indicated an inhibitory effect of gluconate on tumor growth by competitive blocking of pmCiC.10 Gluconokinase has a key role in gluconate metabolism in humans.11 The IDNK gene encodes human gluconokinase, which is involved in the phosphorylation of gluconate.
The present study was grounded in our idea that inhibition of IDNK expression could prevent gluconate metabolism and promote the role of gluconate in suppressing cancer growth. However, the role of IDNK in cancer growth has not been clarified. Presently, we first explored the potential role of IDNK in HCC cell lines. IDNK knockdown in BEL-7404 and Huh-7 cells was performed using lentivirus vectors encoding short hairpin RNA (shRNA). The proliferation and apoptosis of HCC cells were measured after IDNK knockdown. Gene expression in BEL-7404 cells with IDNK knockdown was measured using a microarray. The differentially expressed genes (DEGs) induced by IDNK inhibition were identified, followed by the prediction of the related pathways. The findings should inform new liver cancer treatments.
Materials and Methods
RNA Interference (RNAi) Recombinant Plasmid Construction and Lentivirus Packaging
The small interfering RNA (siRNA) of IDNK was designed and synthesized by Shanghai Jirui Biological Engineering Co. Ltd. (Shanghai, China). The target sequences were sense 5ʹ AAACAGAACTAAGCATAAA 3ʹ and anti-sense 5ʹ TTTATGCTTAGTTCTGTTT 3ʹ. IDNK shRNA was inserted into the GV115 vector using AgeI and EcoRI restriction enzymes and T4 DNA Ligase (Fermentas, Waltham, MA, USA). The recombinant plasmids were transferred into competent Escherichia coli cells. Positively transfected cells were selected by growth in Luria-Bertani medium supplemented with ampicillin. The effective IDNK shRNA plasmid was determined by PCR analysis and isolated using the EndoFree® Maxi Plasmid Kit (Qiagen, Carlsbad, CA, USA) according to the manufacturer’s instructions.
Lentiviral Infection
The BEL-7404 and Huh-7 HCC cell lines obtained from Shanghai Cancer Institute (Shanghai, China) were maintained in RPMI 1640 medium (Gibco, Grand Island, NY, USA) supplemented with 10% fetal bovine serum at 37°C in an atmosphere of 5% CO2. Cells were seeded in wells of six-well plates (2×10⁵ cells/well) and infected with lentivirus containing either IDNK shRNA plasmid or blank control plasmid in the shCtrl and shIDNK group, respectively. After lentiviral infection for 72 h, positive infection efficiency was observed by fluorescence microscopy using a model IX71 microscope (Olympus, Tokyo, Japan).
RNA Isolation and Real-Time Quantitative PCR Analysis
Total RNA was extracted from HCC cells using Trizol reagent (Invitrogen, Carlsbad, CA, USA). cDNA was synthesized by reverse transcription with 2 μg RNA using an M-MLC kit according to the manufacturer’s instructions (Promega, Madison, WI, USA). The amplification reaction was performed in a 12-μL reaction system containing 0.3 μL primer mix (5 μM), 0.6 μL cDNA, 6.0 μL SYBR premix ex taq, and 5.1 μL RNase-Free water. The primer sequences were: IDNK forward primer 5ʹ GAAAAGGCATACCGCTCAAT-3ʹ and reverse primer 5ʹ-GAGATGACCTCAAACGACCC-3ʹ; glyceraldehyde-3-phosphate dehydrogenase (GAPDH) forward primer 5ʹ-TGACTTCAACAGCGACACCCA-3ʹ and reverse primer 5ʹ-CACCCTGTTGCTGTAGCCAAA-3ʹ. Real-time PCR was performed using the LightCycler 480 instrument (Roche, Mannheim, Germany). The reaction conditions were 95°C for 30 s and 40 cycles of 95°C for 5 s and 60°C for 30 s. The IDNK gene expression relative to GAPDH was analyzed by the 2−ΔΔCT method.12
Western Blot Analysis
After infection, cells in shCtrl and shIDNK groups were lysed using 2× Lysis Buffer and the supernatant was collected by centrifugation at 12,000 ×g, 4°C for 15 min. The protein concentration was measured by the BCA Protein Assay Kit (P0010S; Beyotime, Shanghai, China). A total of 20 µg of protein was used for 10% SDS-PAGE. The resolved proteins were transferred to a polyvinylidene fluoride (PVDF) membrane (IPVH00010; Millipore, Billerica, MA, USA). Each membrane was blocked with 5% skim milk and incubated with the primary antibodies. The antibodies and dilutions used were: mouse anti–IDNK (1:2000, F1804; Sigma-Aldrich, St. Louis, MO, USA), and mouse anti-GAPDH (1:2000, sc-32233; Santa Cruz Biotechnology, Dallas, TX, USA) at 4°C overnight. This was followed by incubation with secondary antibody (goat anti-mouse IgG, 1:2000, sc-2005; Santa Cruz Biotechnology) for 2 h at room temperature. The immunoreactive bands were visualized by electrochemiluminescent (ECL) staining (M3121/1859022; Thermo Fisher Scientific, Waltham, MA, USA).
Cell Growth Assay
After infection for 2 h, cells were collected and seeded in wells of 96-well plate (1000 cells/well) at 37°C in an atmosphere of 5% CO2. The number of surviving cells was counted daily beginning after 24 h incubation for 5 consecutive days. The cell growth curves were constructed by measuring green fluorescence emitted from cells using a Celigo Imaging Cytometer (Nexcelom, Lawrence, MA, USA).
Flow Cytometry Analysis
Flow cytometry allows the evaluation of the cell cycle and apoptosis in different models. The infected cells were seeded in wells of 6-well plate (2 mL/well) and maintained in an incubator at 37°C in an atmosphere of 5% CO2. When the cells grew to 85% confluence, they were collected by centrifugation at 1300 rpm for 5 min at 4°C and washed three times using cooled D-Hanks solution (pH 7.2~7.4). The cells were stained with propidium iodide (PI) or Annexin V to determine cell cycle distribution and cellular apoptosis by flow cytometry using a Guava easyCyte HT flow cytometer(Millipore).
MTT (3-[4, 5-Dimethylthiazol-2-Yl]-2, 5 Diphenyl Tetrazolium Bromide) Cell Viability Assay
The viability of cells infected with IDNK shRNA lentivirus plasmid and blank control lentivirus plasmid was evaluated using the MTT assay. Briefly, the infected cells (1500 cells/well) were seeded in wells of a 96-well plate and maintained for 5 days. Each day, 20 μL 5 mg/mL MTT was added to each well and incubated for 4 h. The cell supernatants were removed and 100 μL dimethyl sulfoxide (DMSO) was added to each well. After 5 min, the optical density (OD) of cells was detected at 540 nm using a M2009PR microplate reader (Tecan, Männedorf, Switzerland).
Caspase 3/7 Assay
The active caspase 3/7 in infected cells was evaluated using the Caspase-Glo® 3/7 assay kit (Promega). Huh-7 cells (1×10⁴ cells/well) infected with recombinant plasmid for 3 days in shCtrl and shIDNK group were seeded in wells of 96-well plate at 37°C in an atmosphere of 5% CO2. After adding 100 μL Caspase-Glo reagent to each well, the plate was shaken at 300 rpm for 30 min and then incubated for 2 h at 20°C. Caspase 3/7 activity was measured using the aforementioned plate reader (Tecan).
Microarray Data Analysis
Gene expression in BEL-7404 cells infected with IDNK shRNA lentivirus plasmid (KD) and blank control lentivirus plasmid (NC) was measured using the PrimeView GeneChip (Affymetrix, Santa Clara, CA, USA) according to the manufacturer’s protocol. The arrays were scanned using a GeneChip Scanner with the use of GeneChip Operating Software. DEGs were sorted by empirical Bayes procedure with |Fold Change|≥1.3 and False discovery rate (FDR)<0.05. Ingenuity Pathway Analysis (IPA) was performed to globally analyze the DEGs in the pathways.
Statistical Analysis
All the data are expressed as mean ± standard deviation (STDEV). Data were analyzed using SPSS software (SPSS, Inc., Chicago, IL, USA). The comparison between groups was performed by T-test. Differences with a P-value <0.05 were considered significant.
Results
Knockdown of IDNK in HCC Cell Lines
After cells were infected with the recombinant lentivirus shRNA IDNK plasmid for 72 h the infective efficiency was determined to be more than 80% by observing green fluorescent protein using a fluorescence microscope (Figure 1A). The effect of shRNA IDNK on BEL-7404 and Huh-7 cells was determined by real-time quantitative PCR analysis and Western blot. After infection, the relative expression of IDNK gene in BEL-7404 cells in the shIDNK group (0.15±0.01) was considerably decreased compared to the shCtrl group (1.00 ± 0.06) (p<0.001) (Figure 1B). The relative IDNK expression in Huh-7 cells was 1.00 ± 0.14 in shCtrl group and was significantly less in the shIDNK group (0.05 ± 0.01) (p=0.006) (Figure 1C). As shown in Figure 1D and E, the protein expression of IDNK was obviously reduced in the shIDNK group of the two cell lines. The expression of IDNK at the mRNA and protein levels was considerably reduced in shRNA IDNK infected cultures, indicating the effective knockdown of IDNK target sequencing.
 |
Figure 1 The efficiency of infection of HCC cells with shIDNK and shCtrl lentivirus plasmid. (A) The expression of IDNK in BEL-7404 cells by real-time quantitative RT-PCR analysis. (B) The expression of IDNK in Huh-7 cells by real-time quantitative RT-PCR analysis. (C) The expression of IDNK protein in BEL-7404 cells by Western blot analysis. (D) The expression of IDNK protein in Huh-7 cells by Western blot analysis (E). **P<0.01. |
Knockdown of IDNK Inhibits HCC Cell Proliferation
The viability of BEL-7404 IDNK knockdown cells was determined using the MTT assay. The growth rate of both BEL-7404 and Huh-7 cells in the shRNA IDNK group was slower than that in the shCtrl group at days 3, 4, and 5 after plasmid infection (Figure 2). The OD values of BEL-7404 cells in shIDNK group were 0.302±0.010 at day 4 and 0.356±0.002 at day 5, which were significantly lower than the value in the shCtrl group (0.369±0.0045 at day 4 and 0.573±0.0017 at day 5, both p<0.001) (Figure 2A and B). The fold-changes of the OD values in BEL-7404 cells were also significantly reduced at day 4 (1.924±0.0611) and day 5 (2.267±0.0125) following infection (both p<0.001) (Figure 2C and D).
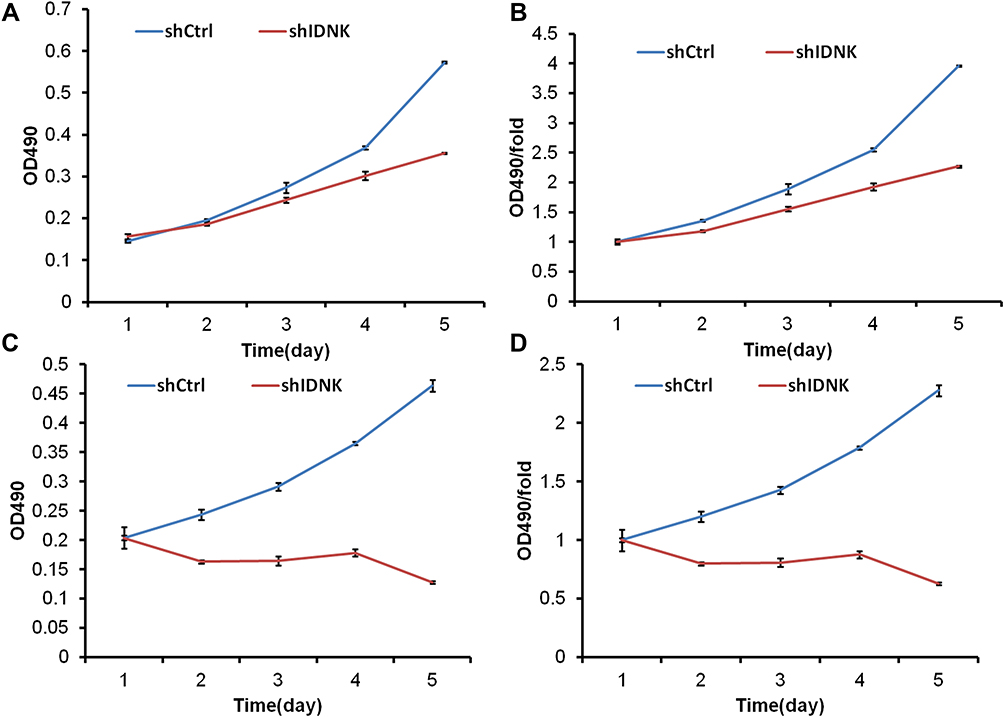 |
Figure 2 HCC cell proliferation is significantly inhibited by IDNK knockdown in BEL-7404 cells (A, B) and in Huh-7 cells (C, D). The optical density (OD) value of surviving cells was measured in the MTT assay after IDNK knockdown for consecutive 5 days. |
Similar findings were observed by Celigo cell counting (Figure 3). The growth curve of cells revealed that compared with the shCtrl group, the cell count and growth fold-change of BEL-7404 and Huh-7 cells following IDNK knockdown were significantly decreased at day 4 and 5 (all p <0.001). These results indicated that IDNK may play a key role in promoting the proliferation of HCC cells.
 |
Figure 3 Cell growth curves of HCC cells after IDNK knockdown by Celigo cell counting in BEL-7404 cells (A, B) and in Huh-7 cells (C, D). The surviving cells with green fluorescence were counted using a Celigo Imaging Cytometer. |
In addition, PI flow cytometry assay showed that the percentage of BEL-7404 cells in the shIDNK group was considerably decreased in the S phrase (18.43±0.693% vs. 30.23±0.771%) and significantly increased in G1 (63.61±0.449% vs. 57.31±0.186%) and G2/M phrase (17.91±1.094% vs. 12.45±0.6227%), compared to the shCtrl group (all p<0.05) (Figure 4A and B). Similarly, Huh-7 cells following shRNA IDNK plasmid infection were significantly decreased in S phrase (18.43±0.694% vs. 30.23±0.771%) and remarkably increased in G1 (63.61±0.499% vs. 57.31±0.186%) and G2/M phrase (17.96±1.094% vs. 12.45±0.623%) (all p<0.05) (Figure 4C and D). The results suggested that knockdown of IDNK inhibited the cell cycle in S phrase.
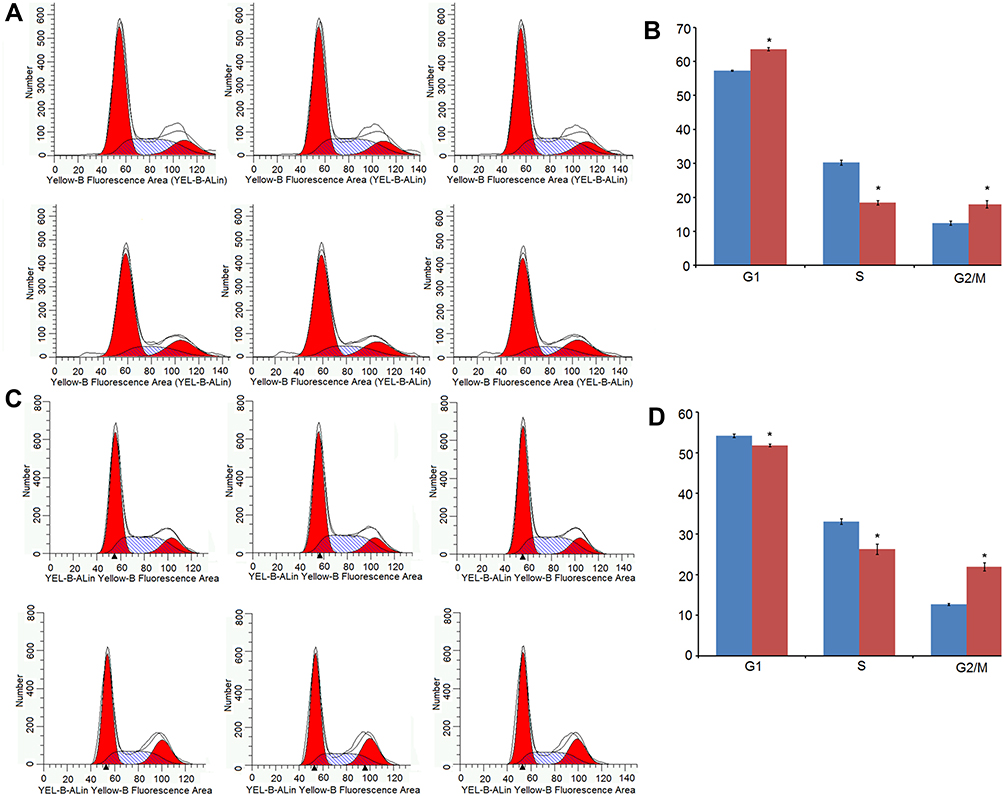 |
Figure 4 Cell cycle distribution of HCC cells after IDNK knockdown. (A) Cell cycle distribution of BEL-7404 cells after IDNK knockdown by flow cytometry. (B) Percentage of BEL-7404 cells after IDNK knockdown in the G1, S, and G2/M phase. (C) Cell cycle distribution of Huh-7 cells after IDNK knockdown by flow cytometry. (D) Percentage of Huh-7 cells after IDNK knockdown in the G1, S, and G2/M phase. *P<0.05. |
Knockdown of IDNK Promotes HCC Cell Apoptosis
The apoptosis of BEL-7404 and Huh-7 cells after IDNK knockdown was evaluated by Annexin V staining and caspase 3/7 assay. After 5 days of infection, the apoptosis rate of BEL-7404 cells in shIDNK group (34.03±0.063%) was significantly higher than that in shCtrl group (4.24±0.170%) (p<0.05) (Figure 5A). To further verify the effect of IDNK on cell apoptosis, the activity of caspase 3/7 was evaluated in Huh-7 cells after infection. As shown in Figure 5B, Huh-7 cells infected with shRNA IDNK plasmid exhibited remarkable caspase 3/7 activity (30,681.67±418.073), compared with that in cells infected with blank control plasmid (11,843±418.07) (p<0.001). The results suggested that the IDNK was important in the regulation of cell viability.
 |
Figure 5 IDNK knockdown significantly increases apoptosis of HCC cells. (A) Cell death was determined by Annexin V staining in BEL-7404 cells. (B) Apoptotic Huh-7 cells were determined by measuring caspase 3/7 activity. |
DEGs and Validation
Based on microarray data, a total of 1196 genes (585 upregulated and 611 downregulated) were identified as DEGs in BEL-7404 cells with IDNK knockdown compared with cells infected with blank control plasmid. Hierarchical clustering showed that the samples between groups could be clearly distinguished by DEGs (Figure 6A). The differential expression of significant genes was validated by PCR analysis and Western blot. The results suggested that the differential expressions of genes at the mRNA and protein levels were relatively consistent with the microarray data (Supplemental Figure 1A and B).
 |
Figure 6 Hierarchical clustering of differentially expressed genes (A) and IPA pathways involved with differentially expressed genes (B). |
Canonical IPA Pathways
The significant pathways enriched by differentially expressed pathways were analyzed by IPA software. The top 20 IPA pathways involved with DEGs included tRNA charging (Z-score=−3), Insulin-like growth factor-1 (IGF-1) signaling (Z-score=1.155), and p53 signaling (Z-score=−1.667) (Figure 6B).
Discussion
The mRNA and protein levels of IDNK were considerably reduced after IDNK knockdown. The proliferation and growth of HCC cells significantly decreased following IDNK knockdown. Additionally, knockdown of IDNK inhibited the cell cycle in S phrase, and prominently promoted apoptosis of HCC cells. Microarray analysis revealed that a total of 1196 genes were differentially expressed after IDNK knockdown compared with cells infected with blank control plasmid, which were involved in the tRNA charging pathway.
IDNK encodes gluconokinase. The enzyme has been implicated in the phosphorylation of gluconate underlying gluconate metabolism. Gluconate has been reported to be able to block citrate transport to cancer cells and inhibit tumor growth, which has been raised as a candidate option for diagnosis and treatment of cancers.13 Considering that IDNK plays a vital role in gluconate metabolism, we speculated that inhibition of IDNK expression may block gluconate metabolism, thereby preventing cancer cell growth.
Citrate is produced in mitochondria and plays a critical role in the Krebs’ cycle. Excessive intracellular citrate is reported to inhibit glycolysis by suppressing phosphofructokinase-1.14 Many studies have found that the level of citrate is significantly decreased in the blood, tissue, and urine of cancer patients,15–19 which may be explained by the increased need for citrate in cancer cell metabolism. Glycolysis is the main pathway used by cancer cells to generate ATP and suppression of glycolysis can inhibit cancer cell proliferation and growth.20 The expression of anti-apoptotic protein in cancer cells is reduced by continuous exposure to citrate. Different from normal cells, cancer cells show pronounced citrate oxidizing capability.21 A previous study has proposed that the uptake of extracellular citrate in cancer cells is associated with cell metabolism and fatty acid synthesis.9 Theoretically, the inhibition of citrate cycle can slow down citrate metabolism, suppressing cancer cell proliferation and promoting cancer cell apoptosis. Another study described the behavior of gluconate as the competitive and irreversible blocker of citrate transport, with the inhibition of cancer cell growth in immunodeficient mice.13 Thus, increasing the level of gluconate could inhibit the oxidation of citrate oxidizing, therefore inhibiting cancer cell proliferation and promoting apoptosis. The intriguing discovery of IDNK in the control of HCC cancer cell proliferation may inspire future studies about the mechanism.
Caspase 3 is the master “executioner” during apoptotic cell death, which serves as a direct link between cell death and tumor repopulation.22 Caspase-7 is considered to be redundant with caspase-3 because these related cysteine proteases share an optimal peptide recognition sequence.23 It has been reported that caspase-3 and caspase-7 contribute to the majority of cleavage that takes place during apoptosis.24 Thus, we detected the expression levels of caspase-3 and caspase-7 in HCC cells after IDNK suppression. As expected, the activities of caspase-3 and caspase-7 were significantly increased in shRNA IDNK group compared with control, which demonstrated that IDNK may inhibit the apoptosis of HCC cells by repressing the expression of caspase-3 and caspase-7.
Our microarray data suggested that tRNA charging was inhibited by the deregulated expression of IDNK in HCC cells. tRNAs are noncoding RNAs that play a key role in protein translation for cancer cell proliferation.25 tRNAs and their derivatives are dysregulated in the progression of cancers, specifically in metastasis, invasiveness, and tumor growth.26 tRNA charging is the aminoacylation of tRNAs. This event is altered in multiple myeloma, and is responsible for the increased need for protein translation.27 In this study, the DEGs were significantly enriched in the tRNA charging pathway, indicating the changes of tRNA charging in HCC cells. IPA pathway analysis also showed that tRNA charging was a significant pathway, with a Z-score=−3, indicating that the tRNA charging was prominently inhibited in IDNK knockdown HCC cells. Thus, we suspect that the deregulation of IDNK expression inhibited tRNA charging, therefore inhibiting HCC cell proliferation.
There are some limitations in this study. The detailed mechanism underlying IDNK in cancer cells has not been clarified clearly. In addition, the role of IDNK in controlling cancer cell proliferation and apoptosis has not been determined in clinical samples in vivo and in vitro. Further mechanism and clinical studies are urgently needed.
Conclusion
In conclusion, our study demonstrates that IDNK plays a key role in HCC cell proliferation and apoptosis. Knockdown of IDNK may inhibit tRNA charging, suppressing HCC cell proliferation. Our findings may indicate a novel therapeutic target for HCC. A good understanding of the role of IDNK may facilitate the discovery of therapies for HCC.
Ethics Approval
Experiments performed in this study were approved by the Institutional Biosafety Committee (IBC approval reference number 022016017).
Highlights
- IDNK expression was knocked down by shRNA in HCC cells.
- Proliferation of HCC cells significantly declined after IDNK silencing.
- Apoptosis of HCC cells significantly increased after IDNK silencing.
- tRNA charging was a significantly inhibited pathway in IDNK knockdown cells.
Funding
This work was supported by grants from the Jiangsu Provincial Commision of Health and Family Planning(QNRC2016200), 333 Project of High Level Talents in Jiangsu Province (20161110615), Six-one Project of Jiangsu Province (LGY2017012), Surface Project of Wuxi City Health Commission (MS201905). In addition, Thanks for funding of the Innovative teams and elite talent programs.
Disclosure
The authors report no conflicts of interest in this work.
References
1. Forner A, Llovet JM, Bruix J. Hepatocellular carcinoma. Lancet. 2012;379(9822):1245–1255. doi:10.1016/S0140-6736(11)61347-0
2. Alter MJ. Epidemiology of hepatitis C virus infection. World J Gastroenterol. 2007;13(17):2436–2441. doi:10.3748/wjg.v13.i17.2436
3. Wang XW, Hussain SP, Huo TI, et al. Molecular pathogenesis of human hepatocellular carcinoma. Toxicology. 2002;182:43–47. doi:10.1016/S0300-483X(02)00253-6
4. El-Serag HB, Hampel H, Javadi F. The association between diabetes and hepatocellular carcinoma: a systematic review of epidemiologic evidence. Clin Gastroenterol Hepatol. 2006;4(3):369–380. doi:10.1016/j.cgh.2005.12.007
5. Siddiqui MA, Siddiqui HH, Mishra A, Usmani A. Epidemiology of hepatocellular carcinoma. Virus. 2018;18:19.
6. Llovet JM, Montal R, Sia D, Finn RS. Molecular therapies and precision medicine for hepatocellular carcinoma. Nat Rev Clin Oncol. 2018;15(10):599. doi:10.1038/s41571-018-0073-4
7. Ramachandran S, Fontanille P, Pandey A, Larroche C. Gluconic acid: properties, applications and microbial production. Food Technol Biotech. 2006;44:2.
8. Singh OV, Kumar R. Biotechnological production of gluconic acid: future implications. Appl Microbiol Biotechnol. 2007;75(4):713–722. doi:10.1007/s00253-007-0851-x
9. Mycielska ME, Dettmer K, Rümmele P, et al. Extracellular citrate affects critical elements of cancer cell metabolism and supports cancer development in vivo. Cancer Res. 2018;78(10):2513–2523. doi:10.1158/0008-5472.CAN-17-2959
10. Mycielska ME, Mohr MTJ, Schmidt K, et al. Potential use of gluconate in cancer therapy. Front Oncol. 2019;9:522. doi:10.3389/fonc.2019.00522
11. Rohatgi N, Guðmundsson S, Rolfsson Ó. Kinetic analysis of gluconate phosphorylation by human gluconokinase using isothermal titration calorimetry. FEBS Lett. 2015;589(23):3548–3555. doi:10.1016/j.febslet.2015.10.024
12. Livak KJ, Schmittgen TD. Analysis of relative gene expression data using real-time quantitative PCR and the 2− ΔΔCT method. methods. 2001;25(4):402–408. doi:10.1006/meth.2001.1262
13. Mycielska ME, Mohr MT, Schmidt K, et al. Potential use of gluconate in cancer therapy. Front Oncol. 2019;9.
14. Mycielska ME, Patel A, Rizaner N, et al. Citrate transport and metabolism in mammalian cells: prostate epithelial cells and prostate cancer. Bioessays. 2009;31(1):10–20. doi:10.1002/bies.v31:1
15. Yekta RF, Tavirani MR, Oskouie AA, Mohajeri-Tehrani MR, Soroush AR, Baghban AA. Serum-based metabolic alterations in patients with papillary thyroid carcinoma unveiled by non-targeted 1H-NMR metabolomics approach. Iran J Basic Med Sci. 2018;21(11):1140.
16. Tokunaga M, Kami K, Ozawa S, et al. Metabolome analysis of esophageal cancer tissues using capillary electrophoresis-time-of-flight mass spectrometry. Int J Oncol. 2018;52(6):1947–1958. doi:10.3892/ijo.2018.4340
17. Karlíková R, Široká J, Friedecký D, et al. Metabolite profiling of the plasma and leukocytes of chronic myeloid leukemia patients. J Proteome Res. 2016;15(9):3158–3166. doi:10.1021/acs.jproteome.6b00356
18. Kumar D, Gupta A, Mandhani A, Sankhwar SN. NMR spectroscopy of filtered serum of prostate cancer: a new frontier in metabolomics. Prostate. 2016;76(12):1106–1119. doi:10.1002/pros.v76.12
19. E Mycielska M, M Milenkovic V, H Wetzel C, Rümmele P, K Geissler E. Extracellular citrate in health and disease. Curr Mol Med. 2015;15(10):884–891. doi:10.2174/1566524016666151123104855
20. Zhang X, Varin E, Allouche S, Lu Y, Poulain L, Icard P. Effect of citrate on malignant pleural mesothelioma cells: a synergistic effect with cisplatin. Anticancer Res. 2009;29(4):1249–1254.
21. Fricke ST, Rodriguez O, VanMeter J, et al. In vivo magnetic resonance volumetric and spectroscopic analysis of mouse prostate cancer models. Prostate. 2006;66(7):708–717. doi:10.1002/(ISSN)1097-0045
22. Huang Q, Li F, Liu X, et al. Caspase 3–mediated stimulation of tumor cell repopulation during cancer radiotherapy. Nat Med. 2011;17(7):860. doi:10.1038/nm.2385
23. Lamkanfi M, Kanneganti T-D. Caspase-7: a protease involved in apoptosis and inflammation. Int J Biochem Cell Biol. 2010;42(1):21–24. doi:10.1016/j.biocel.2009.09.013
24. Slee EA, Harte MT, Kluck RM, et al. Ordering the cytochrome c–initiated caspase cascade: hierarchical activation of caspases-2,-3,-6,-7,-8, and-10 in a caspase-9–dependent manner. J Cell Biol. 1999;144(2):281–292. doi:10.1083/jcb.144.2.281
25. Mitra S, Chakrabarti J. Chapter 9 - transfer rna in cancer. In: Chakrabarti DJ, Mitra DS, eds. Cancer and noncoding rnas. Boston: Academic Press; 2018:151–161.
26. Huang S-Q, Sun B, Xiong Z-P, et al. The dysregulation of tRNAs and tRNA derivatives in cancer. J Exp Clin Cancer Res. 2018;37(1):101. doi:10.1186/s13046-018-0745-z
27. Zhou Y, Goodenbour JM, Godley LA, Wickrema A, Pan T. High levels of tRNA abundance and alteration of tRNA charging by bortezomib in multiple myeloma. Biochem Biophys Res Commun. 2009;385(2):160–164. doi:10.1016/j.bbrc.2009.05.031
 © 2020 The Author(s). This work is published and licensed by Dove Medical Press Limited. The
full terms of this license are available at https://www.dovepress.com/terms
and incorporate the Creative Commons Attribution
- Non Commercial (unported, 3.0) License.
By accessing the work you hereby accept the Terms. Non-commercial uses of the work are permitted
without any further permission from Dove Medical Press Limited, provided the work is properly
attributed. For permission for commercial use of this work, please see paragraphs 4.2 and 5 of our Terms.
© 2020 The Author(s). This work is published and licensed by Dove Medical Press Limited. The
full terms of this license are available at https://www.dovepress.com/terms
and incorporate the Creative Commons Attribution
- Non Commercial (unported, 3.0) License.
By accessing the work you hereby accept the Terms. Non-commercial uses of the work are permitted
without any further permission from Dove Medical Press Limited, provided the work is properly
attributed. For permission for commercial use of this work, please see paragraphs 4.2 and 5 of our Terms.