Back to Journals » Clinical Pharmacology: Advances and Applications » Volume 6
Glibenclamide in patients with poorly controlled type 2 diabetes: a 12-week, prospective, single-center, open-label, dose-escalation study
Authors Rambiritch V, Maharaj B, Naidoo P ![]()
Received 22 September 2013
Accepted for publication 15 November 2013
Published 4 April 2014 Volume 2014:6 Pages 63—69
DOI https://doi.org/10.2147/CPAA.S54809
Checked for plagiarism Yes
Review by Single anonymous peer review
Peer reviewer comments 2
Virendra Rambiritch,1 Breminand Maharaj,2 Poobalan Naidoo3
1Biomedical Research Ethics Committee, University of Kwazulu-Natal, Durban, KwaZulu-Natal, South Africa; 2Department of Therapeutics and Medicines Management, University of Kwazulu-Natal, Durban, KwaZulu-Natal, South Africa; 3Boehringer-Ingelheim, Medical Affairs, Johannesburg, Gauteng, South Africa
Background: The purpose of this study was to investigate the effect of glibenclamide dose escalation on blood glucose and insulin in patients with poorly controlled type 2 diabetes.
Methods: Twenty-two subjects with type 2 diabetes were administered increasing doses (0, 2.5, 5, 10, and 20 mg/day) of glibenclamide at 2-week intervals. Glibenclamide, glucose, and insulin determinations were performed.
Results: The decrease in mean blood glucose from zero dose was 20%, 22%, 26%, and 28% for doses of 2.5, 5, 10, and 20 mg/day, respectively, which was significant from zero dose to 2.5 mg/day (P≤0.001). There were no significant decreases in glucose concentration beyond 2.5 mg/day. The percentage increase in mean insulin from zero dose was 51%, 58%, 44%, and 33% for 2.5, 5, 10, and 20 mg/day respectively. Mean blood insulin increased significantly from zero dose to 2.5 mg/day (P≤0.001). There were no significant increases in mean insulin concentration beyond 2.5 mg/day.
Conclusion: The results of this study suggest that increasing doses of glibenclamide do not produce a proportional increase in insulin secretion or a proportional decrease in blood glucose concentration.
Keywords: type 2 diabetes, glibenclamide, dose-escalation, insulin, glucose
Introduction
Glibenclamide is a second-generation sulfonylurea that reduces blood glucose by increasing insulin secretion from pancreatic beta cells.1 It undergoes significant hepatic metabolism and renal and biliary excretion.2–4 It has a long duration of action and metabolites with hypoglycemic activity that confer an increased risk of prolonged hypoglycemia.5 Glibenclamide-induced hypoglycemia is more likely in the elderly, in patients with irregular eating habits, and in renal impairment.6 Glibenclamide has contentious cardiovascular effects, including effects on ischemic preconditioning7 and blunting of ST elevation in acute coronary syndromes.8
A growing body of evidence suggests that there is a nonlinear relationship between sulfonylurea dose and glycemic-lowering effects.9 A long-term study comparing glibenclamide and glipizide showed little or no improvement in blood glucose control at doses greater than 10 mg/day.1 The authors concluded that there may be a narrow range of plasma concentrations below which sulfonylureas are ineffective and above which there is little additional beneficial effect.
Groop et al10 examined the relationship between plasma glibenclamide concentrations, insulin response, and glucose metabolism during euglycemic and hyperglycemic conditions in nine healthy subjects. The results of this study suggested that glibenclamide is effective within a narrow range of plasma concentrations (50–200 nM), which can be achieved with very low doses of the drug.10
A reduction in the dose of glibenclamide from 15 mg/day to 2.5 mg/day in 15 patients with type 2 diabetes mellitus resulted in 12 (80%) patients achieving a reduction in fasting blood glucose.11 This observation suggests that increasing doses beyond a critical level, in a given patient, may paradoxically worsen glycemic control. Glibenclamide continues to be used in high doses,12 probably because of the expectation of a linear dose-response relationship.
The aim of this study was to clarify the dose-response relationship for glibenclamide by quantifying the effect of increasing doses of glibenclamide on mean blood glucose and mean insulin levels.
Patients and methods
This study was conducted at the diabetes unit in Addington Hospital, Durban, KwaZulu-Natal, South Africa. Thirty-three subjects meeting the inclusion criteria and consenting to participate in the study were enrolled. All participants gave and signed their informed consent. Subjects were selected for the study as follows.
Inclusion criteria were known type 2 diabetes requiring oral antidiabetic therapy; age >20 years; fasting blood glucose >9 mmol/L despite oral antidiabetic therapy; and signed informed consent. Exclusion criteria were being on insulin therapy, allergy to sulfur, and any contraindications to multiple blood sampling, eg, poor venous access. Withdrawal criteria were retraction of consent, intolerance to glibenclamide (eg, allergy to sulfonamides during the study), blood glucose <3.5 mmol/L, and signs or symptoms of hypoglycemia.
Study procedure
The study included a zero dose and the doses of glibenclamide used clinically, ie, 2.5, 5, 10, and 20 mg/day. There were six sequential visits at 2-week intervals, ie, V0 (baseline determination), V1 (zero-dose), V2 (2.5 mg glibenclamide), V3 (5 mg glibenclamide), V4 (10 mg glibenclamide), and V5 (20 mg glibenclamide). Blood was sampled at 0, 30, 60, 90, and 120 minutes (post-breakfast sampling) and at 240, 270, 300, 330, 360, and 420 minutes (post-lunch sampling) on days 14, 28, 42, 56, and 70 for the 0, 2.5, 5.0, 10.0, and 20.0 mg doses, respectively. On completion of the study, all subjects were reintroduced into the pool of patients attending the diabetes clinic for further follow-up and continued treatment.
Enrollment and washout period
Baseline biochemistry including lipid profile, fasting blood glucose, insulin levels, glycated hemoglobin (HbA1c), full blood count, urea and electrolytes, and liver function tests were performed at V0. All oral hypoglycemic drug therapy was stopped for 14 days, ie, the 2-week washout period between V0 and V1.
Visit 1 at day 14
This zero dose study was necessary to profile insulin and glucose in the absence of glibenclamide. A standardized breakfast of two wheat biscuits (37.5 g Weet-bix®; Bokomo, Bellville, South Africa), 200 mL of 2% low fat milk, 250 mL of tea/coffee with or without 50 mL of 2% low fat milk, to be consumed over a 10-minute period, was given. Blood samples were taken to measure the blood glucose and insulin response to this meal at 30-minute intervals for up to 120 minutes post-breakfast. A standardized lunch, ie, two slices of brown bread with 18 g of sweet milk cheese (Melrose®; Parmalat SA (Pty) Ltd, Stellenbosch, South Africa) per slice with fresh lettuce, 250 mL of tea/coffee with or without 50 mL of 2% low fat milk was given 4 hours post-breakfast, and blood samples were taken to measure the glucose and insulin response at 30-minute intervals for up to 120 minutes. No drug was administered during this part of the study. After this zero dose phase, subjects began the dose-escalation component of the study. The starting dose of glibenclamide was 2.5 mg daily for 14 days (commencing on day 15), with escalating doses of 5 mg, 10 mg, and 20 mg/day at 14-day intervals thereafter.
Visit 2 on day 28
On day 28, subjects presented to the clinic at 7 am after an overnight fast and without having taken glibenclamide. Blood was drawn for determinations of fasting blood glucose and insulin. Glibenclamide 2.5 mg was administered and followed 10 minutes later with a standardized breakfast. Blood samples were taken at the same time intervals as for the zero dose phase for insulin, glucose, and glibenclamide determinations. Four hours post-dose, a standardized lunch was administered and consumed over 10 minutes, and blood sampling was repeated as for the post-breakfast phase. Thereafter, the dose of glibenclamide was increased to 5 mg before breakfast to be commenced the following day (day 29) for the next 14 days. The procedure for visit 2 was repeated with subsequent escalation of glibenclamide doses as follows: days 29–42, 5 mg/day (V3) with repeat of procedures as performed on day 28; days 43–56, 10 mg/day (V4) with repeat of procedures as performed on day 42; and days 57–70, 20 mg/day (V5) with repeat of procedures as performed on day 56.
Safety considerations
Subjects performed daily predose home glucose monitoring. The 20 mg/day dose was administered as 10 mg in the morning and 10 mg in the evening 10 minutes before meals during the 14-day period between visits. Concomitant medication was continued throughout the study. Post-meal blood sampling occurred at consistent times for all study subjects. All subjects were provided with 24-hour contact telephone numbers of the researchers as well as that of the clinician in charge.
Adherence to study medication
Adherence was assessed by pill count, examination of diary entries, and subject interview. Subjects were contacted by telephone to reinforce adherence.
Bioanalytical assays
All HbA1c measurements were performed using the Cobas Integra method (Roche Diagnostics, Inc., Somerville, NJ, USA). Glycated hemoglobin was performed only on enrollment to determine patient suitability for participation in the study.
Glibenclamide levels were determined using rapid high-performance liquid chromatography based on the procedure reported by Hamid-Abdel et al.13
Serum insulin was quantitatively determined by radioimmunoassay (Pharmacia and Upjohn, Uppsala, Sweden). This radioimmunoassay was based on a double antibody solid phase technique. The insulin sample was allowed to compete with a fixed amount of 125I-labeled insulin for binding sites on highly specific antibodies. The concentration of insulin was then determined by comparing its competitive capacity with that of insulin standards of known concentration.
Blood glucose was measured using a glucometer (Accutrend Alpha®, Roche Diagnostics, Mannheim, Germany). The accuracy of blood glucose measurement was evaluated by the chemical pathology laboratory at Addington Hospital. The finger prick method was used to enable any deleterious decrease in blood glucose levels to be detected early and remedial measures instituted. With laboratory blood glucose assays, there was a delay of approximately 2 hours. The accuracy of the Accutrend Alpha glucose test was confirmed daily against the standard procedure used by the hospital laboratory.
Liver function tests and urea and electrolyte assays were performed on a Synchron CX3 instrument using Beckman kits, and lipograms were performed on the Synchron CX4/5/7/9 also using Beckman kits (Beckman Coulter Inc., Fullerton, CA, USA).
Diet
All subjects were counseled by a dietician. Subjects were requested to record and report any major changes in dietary or exercise patterns during the study period. A standardized breakfast and standardized lunch was provided during the study.
Ethics and confidentiality
Approval was obtained from the ethics committee of the University of Durban-Westville, South Africa. Permission to conduct this study was secured from the Secretary for Health, KwaZulu-Natal Provincial Administration and the manager of Addington Hospital, South Africa.
Statistical analysis
A minimum of 20 patients was needed to ensure a sample size that would result in an accurate representation of the pharmacokinetic and pharmacodynamic parameters of the study population. At least eleven subjects were required to detect a difference of 2.0 mmol/L between any two levels of glucose with a probability of 0.05 and 80% power, assuming a constant standard deviation of 3.22 mmol/L. The statistical tests used in this study included analysis of variance and the independent samples t-test. Statistical significance was assumed at P<0.05.
Mean concentrations of glibenclamide, glucose, and insulin were calculated as follows: Mean = [(Σglibenclamide, glucose and insulin concentrations during the pharmacokinetic study period for patient 1/n) + (Σglibenclamide, glucose and insulin concentrations during the pharmacokinetic study period for patient 2/n) … /N] where n is the number of measurements over the study period and N is the total number of patients.
Results
Of the 24 patients satisfying our inclusion criteria, two did not complete the study (one patient was lost to follow-up and the other experienced hypoglycemia). Figure 1 shows the number of patients who were screened and subsequently completed the study. The demographics of the study population are shown in Table 1. The age range of the final study cohort was 39–73 years with a mean (± standard deviation) of 54±9 years, and the majority (n=20) being female.
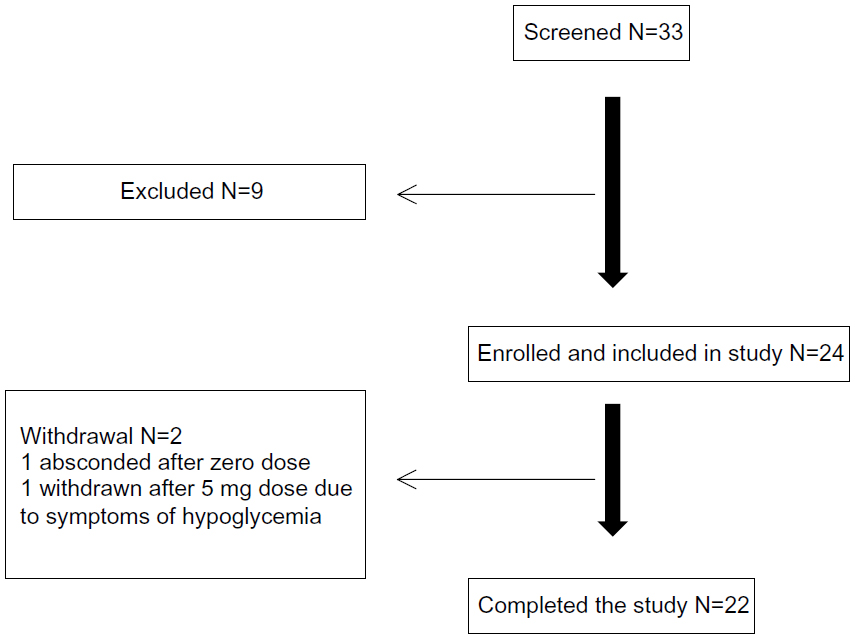 | Figure 1 Study flow chart. |
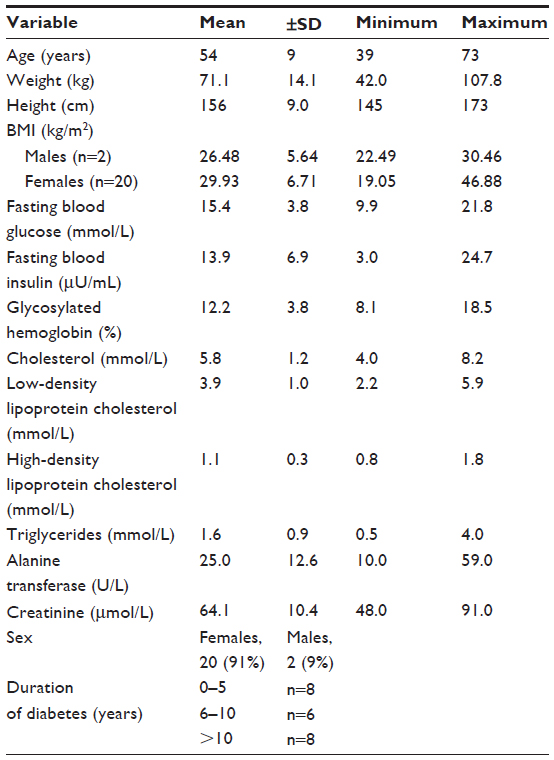 | Table 1 Cohort characteristics at entry into the study |
Hypertension was present in 50% (eleven of 22) of the subjects, and of these, three had concomitant angina. Hydrochlorothiazide was used by five subjects (alone or in combination with other therapy) at doses of 12.5–25 mg per day. Other antihypertensives included indapamide (n=4), atenolol (n=2), diltiazem (n=1), perindopril (n=1), and captopril (n=1). Aspirin (n=3) and other nonsteroidal anti-inflammatory drugs were used by five subjects, and one subject was on fluvastatin, a lipid-lowering drug.
The mean weight and HbA1c of the study population were 71.1±14.1 kg and 12.2%±3.8%, respectively. Based on body mass index, 30% of subjects were of normal weight, 21% were overweight, and 49% were obese. Mean baseline serum creatinine was 64.1±10.04 μmol/L. Total cholesterol, triglyceride, low-density lipoprotein, and high-density lipoprotein levels were 5.8±1.2, 1.6 ±0.9, 3.9±1.0, and 1.1±0.3 mmol/L, respectively. Mean baseline alanine transferase was 25.0±12.6 U/L and mean baseline glucose on entry was 15.4±3.8 mmol/L. Mean baseline insulin was 14.0±6.9 μU/mL.
Glibenclamide concentration versus time data
There was a linear relationship between increasing doses of glibenclamide and mean glibenclamide concentrations, as represented in Figure 2.
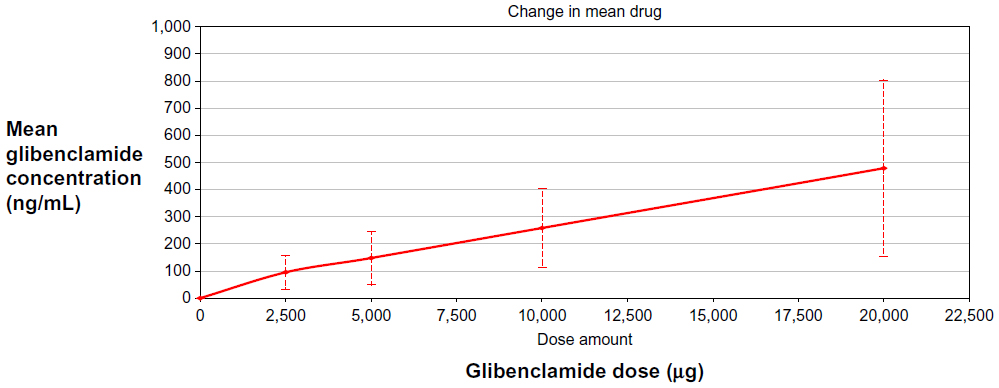 | Figure 2 Mean plasma glibenclamide concentration versus dose. |
Mean blood glucose versus dose
All doses of glibenclamide, from 2.5 mg to 20 mg, decreased mean blood glucose when compared with zero dose. The percentage decrease of mean blood glucose from zero dose was 19.61%, 22.10%, 26.01%, and 27.98% for 2.5 mg, 5 mg, 10 mg, and 20 mg, respectively. The decrease in glucose from dose zero to 2.5 mg was statistically significant (P≤0.001). The decrease in glucose was not significantly different for the 2.5–5 mg, 5–10 mg, and 10–20 mg doses. Figure 3 is a graphic representation of mean glucose levels at various doses of glibenclamide.
 | Figure 3 Mean blood glucose concentration versus dose of glibenclamide. |
Insulin versus dose
All doses of glibenclamide, from 2.5 mg to 20 mg, stimulated insulin secretion compared with the zero dose. The percentage increase of insulin from zero dose was 51.38%, 58.34%, 44.41%, and 33.54% for the 2.5, 5, 10, and 20 mg doses, respectively. Mean blood insulin increased significantly from dose zero to 2.5 mg (P≤0.001). However, the increase from 2.5 mg to 5 mg was not significant (P=0.113). Thereafter, insulin decreased significantly from dose 5 mg to 10 mg (P=0.05). Finally, the change in insulin from the 10 mg to 20 mg doses was not statistically significant (P=0.721). In summary, mean insulin levels increased from zero dose to 5 mg, decreased steadily to 10 mg, and thereafter paralleled the x axis to the dose of 20 mg, as graphically represented in Figure 4.
 | Figure 4 Mean insulin concentration versus dose of glibenclamide. |
Discussion
Macrovascular complications (including cardiovascular and cerebrovascular events) are the major cause of morbidity and mortality in patients with type 2 diabetes.14 Our study population had multiple concomitant cardiovascular risk factors, including diabetes mellitus, overweight/obesity, hypertension, hypercholesterolemia, hypertriglyceridemia, and reduced high-density lipoprotein. This study was of short duration and not designed to quantify cardiovascular outcomes. However, this group of patients was at exceptionally high risk for developing cardiovascular complications, and although our discussion centers around the dose–response relationship for glibenclamide, aggressive management of cardiovascular risk factors was part of the long-term management strategy. Since all subjects in this study had normal hepatic and renal function at entry, pharmacokinetic and pharmacodynamic variation was assumed to be independent of kidney and liver dysfunction.
Glibenclamide dose increments above 5–10 mg/day did not significantly add to the blood glucose-lowering effect. Additionally, there was no increased stimulatory effect on insulin secretion at doses beyond 5 mg/day. The results of this study are in keeping with evidence suggesting that sulfonylureas have maximal blood glucose-lowering effects at doses lower than the manufacturers’ maximum recommended dose.9,15 Therefore, using glibenclamide at high doses, eg, 20 mg/day, may not confer increased benefit and may predispose patients to adverse effects, including hypoglycemia and beta cell exhaustion/failure.
Although only one patient experienced a hypoglycemic episode during the study (at the 5 mg dose), it is likely that higher doses of glibenclamide may significantly increase this risk. The short duration of the study may be one of the reasons why no hypoglycemic episodes were reported at the 20 mg/day dose.
Limitations of this study include its short duration, lack of HbA1c measurement at each visit, and inclusion of patients with poorly controlled type 2 diabetes who probably had limited beta cell reserve. In retrospect, a greater interval between subsequent dose escalations may have allowed HbA1c measurements. The findings of our study must be interpreted with caution and generalization of the results must be avoided. Despite these limitations, it is hoped that this study will form the basis of future research to clarify the dose-response relationships of sulfonylureas in general, and glibenclamide specifically.
In clinical practice, dose escalation of glibenclamide for individual patients must be guided by safety, efficacy, and patient satisfaction. Doses greater than 10 mg may be used if the higher dose is more efficacious and safe than the lower dose. However, if the patient does not have appreciable improvement in glycemic control despite dose escalation, the dose should be reduced to the lowest effective dose to ensure optimization of the safety risk benefit ratio.
Disclosure
The authors report no conflicts of interest in this work.
References
Groop LC, Groop P-H, Stenman S, et al. Comparison of pharmacokinetics, metabolic effects and mechanisms of action of glyburide and glipizide during long-term treatment. Diabetes Care. 1987;10:671–678. | |
Feldman JM. Glyburide: a second-generation sulfonyurea hypoglycemic agent. Pharmacotherapy. 1985;5:43–62. | |
Ings RMJ, Lawrence JR, McDonald A, et al. Glibenclamide pharmacokinetics in healthy volunteers: evidence for zero-order drug absorption. Br J Clin Pharmacol. 1982;13:264–265. | |
Matsuda A, Kuzuya T, Sugita Y, Kawashima K. Plasma levels of glibenclamide in diabetic patients during routine clinical administration determined by specific radioimmunoassay. Horm Metab Res. 1983;15:425–428. | |
Rydberg T, Jönsson A, Karlsson MO, Melander A. Concentration-effect relations of glibenclamide and its active metabolites in man: modelling of pharmacokinetics and pharmacodynamics. Br J Clin Pharmacol. 1997;43:373–381. | |
Krentz AJ, Ferner RE, Bailey CJ. Comparative tolerability profiles of oral antidiabetic agents. Drug Saf. 1994;11:223–241. | |
Meier JJ, Gallwitz B, Schmidt WE, Mügge A, Nauck MA. Is impairment of ischaemic preconditioning by sulfonylurea drugs clinically important? Heart. 2004;90:9–12. | |
Huizar JF, Gonzalez LA, Alderman J, Smith HS. Sulphonylureas attenuate electrocardiographic ST-segment elevation during an acute myocardial infarction in diabetes. J Am Coll Cardiol. 2003;42:1017–1021. | |
Rambiritch V, Naidoo P, Butkow N. Dose-response relationships of sulphonylureas: will doubling the dose double the response. South Med J. 2007;100:1132–1136. | |
Groop LC, Barzilai N, Ratheiser K, et al. Dose-dependent effects of glyburide on insulin secretion and glucose uptake in humans. Diabetes Care. 1991;14:724–727. | |
Robertson L, Jackson L. Sulphonylureas (specifically glibenclamide) and their correct dosage. Letter to the editor. S Afr Med J. 1989;76:286–289. | |
Rambiritch V, Pillai G, Maharaj B, Robertson LI. Glibenclamide – what dose? S Afr Med J. 2007;97:475. | |
Hamid-Abdel ME, Suleiman MS, El-Sayed YM, Najib NM, Hasan MM. A rapid high performance liquid chromatography assay of glibenclamide in serum. J Clin Pharm Ther. 1989;14:181–188. | |
Nwaneri C, Cooper H, Bowen-Jones D. Mortality in type 2 diabetes mellitus: magnitude of the evidence from a systematic review and meta-analysis. British Journal of Diabetes and Vascular Disease. 2013;13:192–207. | |
Jonsson A, Hallengren B, Rydberg T, Melander A. Effects and serum levels of glibenclamide and its active metabolites in patients with type 2 diabetes. Diabetes Obes Metab. 2001;3:403–409. |
 © 2014 The Author(s). This work is published and licensed by Dove Medical Press Limited. The
full terms of this license are available at https://www.dovepress.com/terms
and incorporate the Creative Commons Attribution
- Non Commercial (unported, 3.0) License.
By accessing the work you hereby accept the Terms. Non-commercial uses of the work are permitted
without any further permission from Dove Medical Press Limited, provided the work is properly
attributed. For permission for commercial use of this work, please see paragraphs 4.2 and 5 of our Terms.
© 2014 The Author(s). This work is published and licensed by Dove Medical Press Limited. The
full terms of this license are available at https://www.dovepress.com/terms
and incorporate the Creative Commons Attribution
- Non Commercial (unported, 3.0) License.
By accessing the work you hereby accept the Terms. Non-commercial uses of the work are permitted
without any further permission from Dove Medical Press Limited, provided the work is properly
attributed. For permission for commercial use of this work, please see paragraphs 4.2 and 5 of our Terms.