
Back to Journals » Clinical Ophthalmology » Volume 20
Glaucoma Risk with Metformin and Sulfonylurea Therapies in Type 2 Diabetes: A Retrospective Cohort Study
Authors Lim J, Zhou J, Wu H, Liu Z, Lee DA
Received 3 September 2025
Accepted for publication 14 January 2026
Published 4 February 2026 Volume 2026:20 545641
DOI https://doi.org/10.2147/OPTH.S545641
Checked for plagiarism Yes
Review by Single anonymous peer review
Peer reviewer comments 3
Editor who approved publication: Dr Scott Fraser
Jared Lim,1 Jingru Zhou,2 Hulin Wu,2 Ziqi Liu,2 David A Lee1
1Department of Ophthalmology, John P and Katherine G McGovern Medical School, The University of Texas Health Science Center at Houston, Houston, TX, USA; 2Department of Biostatistics and Data Science, School of Public Health, The University of Texas Health Science Center at Houston, Houston, TX, USA
Correspondence: Jared Lim, Department of Ophthalmology, John P and Katherine G McGovern Medical School, The University of Texas Health Science Center at Houston, 6431 Fannin St, Houston, TX, 77030, USA, Email [email protected]
Background: Research on metformin, sulfonylureas, and open-angle glaucoma risk in type 2 diabetes mellitus (T2DM) has yielded inconsistent findings. This study examined associations between hypoglycemic treatments and glaucoma diagnosis rates.
Methods: This retrospective cohort study analyzed electronic health records of newly diagnosed T2DM patients from the Merative™ Explorys® Therapeutic Dataset (2010– 2022), comparing three groups: metformin monotherapy, sulfonylureas plus metformin combination, and untreated controls. Propensity score matching balanced demographics, glycemic control, body mass index, blood pressure, lipid levels, and comorbidities. Cox proportional hazards models calculated adjusted hazard ratios for incident glaucoma.
Results: After 1:1 propensity score matching, metformin monotherapy (N=100,387) showed a non-significant trend toward higher glaucoma diagnosis rates compared to matched controls (HR 1.106, 95% CI 1.014– 1.207, p=0.023; adjusted HR 1.076, 95% CI 0.995– 1.163, p=0.067). Patients receiving combination therapy with sulfonylureas and metformin (N=38,692) demonstrated statistically significantly higher glaucoma diagnosis rates relative to matched controls (HR 1.235, 95% CI 1.077– 1.417, p=0.002; adjusted HR 1.194, 95% CI 1.075– 1.326, p=0.001). Direct comparison between combination therapy and metformin monotherapy did not reach statistical significance (adjusted HR 1.084, 95% CI 0.973– 1.207, p=0.144).
Conclusion: This observational study found associations between diabetes medications and increased glaucoma diagnosis rates but cannot establish causality. Multiple competing explanations exist: reverse causation (clinicians preferentially prescribing metformin to diabetic patients with emerging glaucoma based on prior protective literature), confounding by indication (sicker patients requiring medication having inherently higher glaucoma risk), and detection bias (differential surveillance patterns). The non-significant metformin monotherapy finding (p=0.067) aligns with recent meta-analyses showing no association. While the statistically significant combination therapy association warrants investigation, it should not be interpreted as definitive causation. Prospective studies controlling for disease severity, surveillance patterns, and treatment indication are needed to disentangle these explanations and inform clinical practice.
Keywords: glaucoma, metformin, sulfonylureas, type 2 diabetes mellitus, retrospective cohort study
Introduction
Type 2 diabetes mellitus (T2DM) represents a significant health burden in the United States of America, affecting millions of individuals. Approximately 37.3 million people in the United States have diabetes, with the majority being T2DM.1 The disease is characterized by impaired glucose metabolism and is associated with numerous microvascular and macrovascular complications. Among these complications, the relationship between T2DM and glaucoma has garnered increasing attention in recent years.
Metformin, a biguanide, is widely recognized as the first-line pharmacological treatment for T2DM, while sulfonylureas are commonly prescribed as second-line agents or in combination therapy.2 Despite these findings, the potential interaction between different hypoglycemic agents and glaucoma risk remains poorly understood, necessitating further investigation.
Previous studies have suggested that metformin may offer protective effects against glaucoma. A paper by Lin demonstrated a significant protective association between metformin usage and open-angle glaucoma risk in diabetic patients.3 The retrospective cohort analysis revealed that patients receiving the highest doses of metformin - those exceeding 1,110 grams over a two-year period - experienced a 25% lower risk of developing open-angle glaucoma compared to non-users. This risk reduction was quantified by a hazard ratio of 0.75, with a 95% confidence interval of 0.59 to 0.95. The findings indicate that metformin’s protective effects may increase with higher dosages, suggesting a dose-response relationship. Another paper by Vergroesen reinforces metformin’s protective effects against open-angle glaucoma in Type 2 diabetes patients. The research demonstrated that patients receiving metformin treatment exhibited a substantially reduced risk of developing open-angle glaucoma, with an odds ratio of 0.18 (95% confidence interval: 0.08–0.41) when compared to patients not treated with the medication.4 This represents an 82% reduction in risk, providing compelling support for metformin’s potential protective properties.
However, these findings have been inconsistent, and the potential interaction between different hypoglycemic medications in relation to glaucoma risk has not been thoroughly investigated. A paper by George found that there was no association between the effects of metformin on the incidence of open-angle glaucoma.5 Similarly, a meta-analysis by Kim revealed no significant association between metformin usage and incidence of open angle glaucoma among patients with type 2 diabetes.6 Furthermore, the addition of sulfonylureas to metformin therapy may introduce complex pharmacological interactions that could influence glaucoma risk. The paper by Vashisht found an increased risk of developing glaucoma compared to other antidiabetic medications.7 Specifically, the study quantified this elevated risk with a hazard ratio of 1.15 (95% confidence interval: 1.11–1.19), indicating that sulfonylurea users faced approximately 15% higher odds of developing eye-related complications.
Given the conflicting evidence and lack of comprehensive studies assessing both metformin and sulfonylureas together, this study aims to fill this gap by evaluating their association with glaucoma risk in a large, retrospective cohort.
Methods
Study Design and Population
This retrospective cohort study utilized the Merative™ Explorys® Therapeutic Dataset Delivered, a de-identified, aggregated electronic health record (EHR) database containing longitudinal clinical data from multiple healthcare systems across the United States. The dataset encompasses structured and coded medical information including demographics, diagnoses (International Classification of Diseases, Ninth and Tenth Revisions, Clinical Modification [ICD-9-CM and ICD-10-CM] codes), procedures (Current Procedural Terminology [CPT] codes), laboratory results, vital signs, and medication prescriptions (National Drug Code [NDC] codes) from both inpatient and outpatient encounters between January 1, 2010, and December 31, 2022.
The study cohort was extracted from the Therapeutic Dataset by the Center for Health Care Data at UTHealth Houston School of Public Health. The extraction included all patients meeting initial eligibility criteria (T2DM diagnosis, age ≥40 years, comprehensive eye examination) with complete data on required baseline covariates for propensity score matching. The database represents an insured population with documented healthcare encounters from participating health systems, which may differ from the general US population in terms of healthcare access, screening rates, and disease detection patterns. This potential selection bias is discussed in the Limitations section.
The study population was divided into three distinct groups based on their medication regimens: no hypoglycemic medication (n=162,191), metformin monotherapy (n=105,555), and combination therapy with sulfonylureas and metformin (n=38,836). All analyses were performed using Python programming language with statistical and data manipulation libraries.
To minimize confounding, we performed separate 1:1 nearest-neighbor propensity score matching without replacement for the metformin monotherapy group (N = 100,387) and the sulfonylureas + metformin combination group (N = 38,692), each matched against patients who received no hypoglycemic medications. The matching algorithm was implemented using Python’s scikit-learn library. The propensity score model included demographic factors (age, sex, race/ethnicity), clinical parameters (BMI, HbA1c, blood pressure, heart rate, lipid levels), and comorbidities (hypertension, kidney disease, hyperlipidemia). We acknowledge that our propensity score model did not include explicit measures of diabetes duration from initial diagnosis or healthcare utilization frequency, which represent potential sources of residual confounding that are discussed in the Limitations section. After matching, control group sizes equaled their corresponding treatment groups.
Statistical Analysis
All statistical analyses were performed using Python 3.9 (Python Software Foundation) with the following libraries: pandas 1.3.5 for data manipulation, NumPy 1.21.5 for numerical operations, scikit-learn 1.0.2 for propensity score matching, lifelines 0.27.4 for survival analysis, and matplotlib 3.5.1 for data visualization.
Propensity Score Matching
Propensity scores were estimated using multivariable logistic regression, with treatment group assignment as the dependent variable. The matching algorithm used 1:1 nearest-neighbor matching without replacement with a caliper width of 0.01 standard deviations of the logit of the propensity score. After matching, we assessed covariate balance using standardized mean differences (SMD), with SMD < 0.1 considered indicative of adequate balance.
Survival Analysis
Time-to-event analysis was conducted using Cox proportional hazards regression models. Follow-up time was calculated from the index date until the earliest of: (1) first confirmed glaucoma diagnosis (event), (2) death, (3) disenrollment from the database, or (4) end of data availability (December 31, 2022). Patients who did not experience the event during follow-up were right-censored at their last recorded clinical encounter.
Both unadjusted and adjusted Cox models were fitted. The adjusted models included all propensity score matching covariates (age, sex, race/ethnicity, BMI, HbA1c, blood pressure, heart rate, lipid levels, and comorbidities). The proportional hazards assumption was tested using Schoenfeld residuals. Tied event times were handled using Efron’s approximation method.
Hazard ratios (HR) and 95% confidence intervals (CI) were calculated using the Wald method. All statistical tests were two-sided with α = 0.05 as the threshold for statistical significance. No adjustments were made for multiple comparisons, as our analyses were considered exploratory rather than confirmatory.
Missing Data
Missing data for covariates were handled using complete case analysis. Patients with missing values for any propensity score matching variable were excluded from the analysis.
Code and Data Availability
Python code implementing the propensity score matching and survival analysis is available from the corresponding author upon reasonable request to qualified researchers with appropriate institutional data access permissions. The dataset used is a proprietary commercial database. Researchers interested in accessing this dataset should contact Merative directly. Due to data use agreements and patient privacy protections, we cannot share patient-level data. Summary statistics and aggregated results are provided in the manuscript and tables.
Medication Exposure Assessment and Limitations
Our study identified medication exposure based on prescription fill records captured in the electronic health record database. However, several important limitations must be acknowledged regarding medication exposure assessment:
Cumulative Dose
We were unable to calculate cumulative metformin or sulfonylurea exposure (measured in grams per year or defined daily doses) due to incomplete data on prescription strength, quantity dispensed, and duration of therapy. This represents a critical limitation, as prior research has suggested that metformin’s potential ocular effects may be dose-dependent, with some studies reporting protective associations only at cumulative doses exceeding 1,110 grams over two years. Our inability to stratify by cumulative dose means we cannot test the high-dose metformin protection hypothesis that has been cited in the literature. This prevents us from reconciling our findings with dose-stratified results from prior studies and limits conclusions we can draw about metformin’s potential ocular effects.
Medication Adherence
We assumed that prescription fills reflected actual medication consumption, which may not be accurate. Patients may not take medications as prescribed due to side effects, cost, or other barriers. This measurement error would tend to dilute any true associations, potentially underestimating both protective and harmful effects.
Treatment Duration and Switching
While we captured the index date of medication initiation, we did not systematically track treatment discontinuation, dose changes, or switching to alternative medications during follow-up. Patients classified in treatment groups at baseline may have subsequently discontinued therapy or changed regimens.
Data Collection
Comprehensive baseline demographic and clinical data for all patients was collected. Demographic information included age, sex, and race/ethnicity. Clinical parameters encompassed body mass index (BMI), vital signs (heart rate and blood pressure), and laboratory values (HbA1c, triglycerides, and cholesterol). Comorbidities were identified through specific diagnostic codes: hypertension was identified using ICD-9 codes 401.x-405.x and ICD-10 codes I10-I15.x; chronic kidney disease through ICD-9 codes 584.x-585.x and ICD-10 codes N17.x-N18.x; and hyperlipidemia through ICD-9 codes 272.0–272.4 and ICD-10 codes E78.0-E78.5.
Index Date Definition and Temporal Considerations
To minimize potential immortal time bias, we employed a systematic approach to define index dates across all treatment groups. The index date was defined as the date of the patient’s first eligible comprehensive eye examination after entering the database and meeting all inclusion criteria, regardless of medication status. For patients in treatment groups, this approach ensures that the observation period begins only after both eye care engagement and medication exposure criteria are met.
For the control group (no hypoglycemic medication), the index date was the first comprehensive eye examination after database entry. For metformin monotherapy patients, the index date was the later of: (1) first comprehensive eye examination or (2) first metformin prescription fill, ensuring patients had both eye care access and medication exposure. For combination therapy patients, the index date was the later of: (1) first comprehensive eye examination or (2) first prescription fill for both metformin and sulfonylurea medications.
This approach was designed to ensure comparable observation periods across groups while maintaining the temporal relationship between medication exposure and outcome assessment. However, we acknowledge that patients must survive and remain enrolled in care to receive treatment, which could introduce survival bias favoring treated groups compared to untreated controls.
Case and Control
Cases of open-angle glaucoma were identified through a systematic process utilizing both ICD-9 codes (365.10, 365.11, 365.12) and ICD-10 codes. The ICD-10 codes encompassed unspecified open-angle glaucoma (H40.10X0-H40.10X4), primary open-angle glaucoma (H40.11-series), and low-tension glaucoma (H40.12-series). To ensure diagnostic accuracy, two or more diagnoses separated by at least 14 days was required. A two-diagnosis threshold was chosen to reduce false positives while ensuring sufficient case capture, consistent with prior epidemiological studies on glaucoma. The case population was restricted to patients aged 40 years or older at first diagnosis.
Control selection followed a comprehensive exclusion protocol as seen in Figure 1. All patients with any glaucoma-related diagnoses, including open-angle, acute angle-closure, chronic angle-closure, and other specified types of glaucoma were removed. Then, patients with prescriptions for glaucoma medications, identified through NDC codes, including beta-blockers, prostaglandin analogs, alpha-2 adrenergic agonists, and carbonic anhydrase inhibitors were excluded. Patients with a history of glaucoma surgery, identified through specific CPT codes (66170, 66,172, 66,174, 66175, and related procedures), were also excluded. To ensure adequate ophthalmologic surveillance, we required controls to have at least one comprehensive eye examination, identified through appropriate CPT codes (92004, 92,014, 99,204, 99,205, 99,214, 99,215, 99,244, 99,245). Medication adherence was not directly measured; thus, our analysis assumes that prescriptions filled were consistently taken as directed, which may dilute effect estimates and introduce measurement bias.
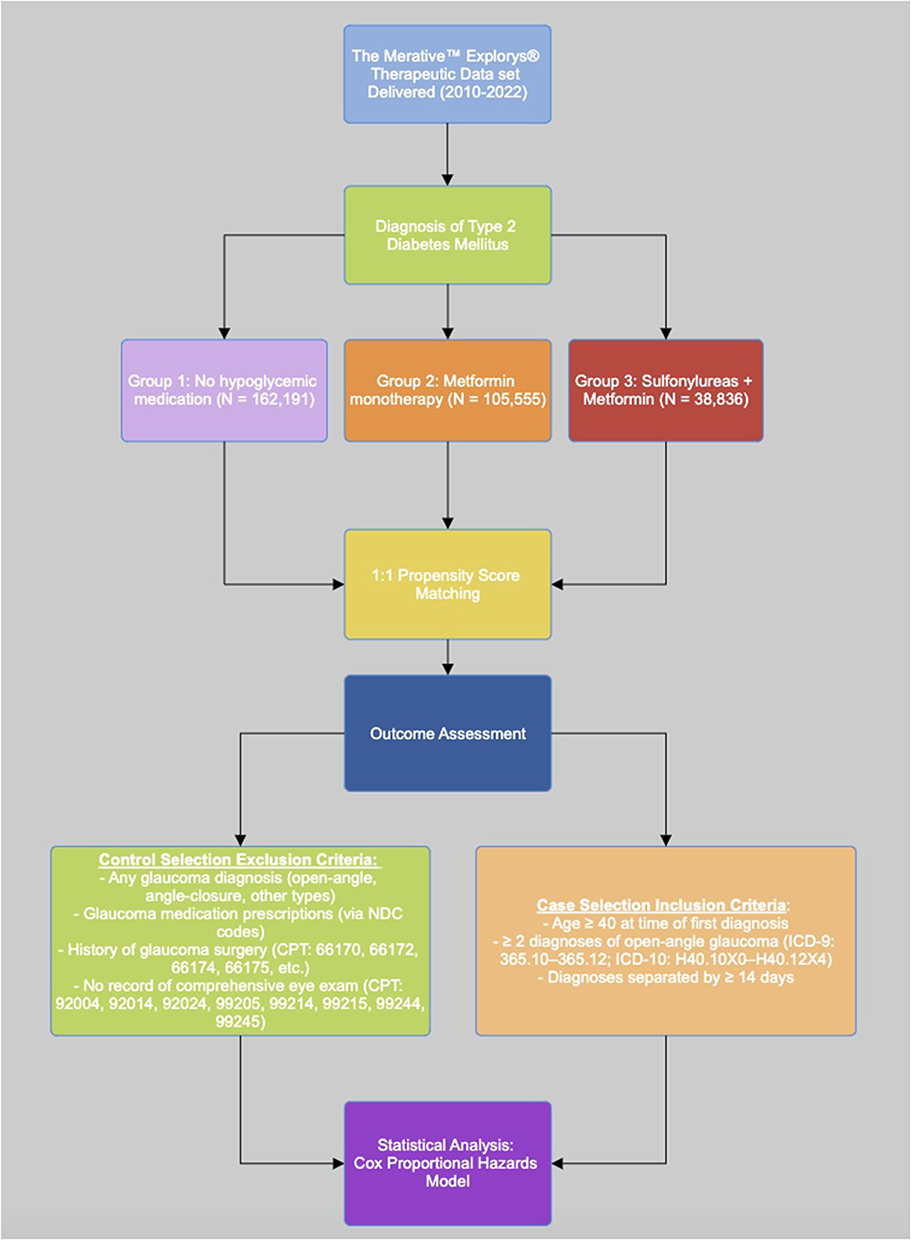 |
Figure 1 Study cohort selection from the Merative™ Explorys® Therapeutic Dataset Delivered. Patients were grouped based on hypoglycemic medication exposure. |
The primary outcome was the incident diagnosis of primary open-angle glaucoma (POAG). Patients were followed from the index date until the earliest of the following: first confirmed POAG diagnosis (event), death, disenrollment, or end of data availability (December 31, 2022). Patients who did not develop glaucoma during follow-up were right-censored at their last recorded encounter. We acknowledge that our analysis assumes prescription fills reflect true adherence, which may not be accurate. Claims-based adherence measures, such as the proportion of days covered, were not available. Additionally, cumulative dosage data (defined daily dose) were not collected, limiting the ability to perform a dose-response analysis.
Cox proportional hazards models were used to calculate adjusted hazard ratios for incident glaucoma, with statistical significance set at p < 0.05. All analyses were conducted using Python, leveraging pandas for data manipulation, scikit-learn for propensity score matching, and lifelines for survival analysis. 95% confidence intervals were calculated for all hazard ratios to assess the precision of our estimates.
Results
Baseline Characteristics
Our study included 306,582 patients across three treatment groups, as seen in Tables 1 and 2. After adjusting for confounders through propensity score matching, metformin monotherapy showed a non-significant trend toward higher glaucoma diagnosis rates compared to matched controls (aHR 1.076, 95% CI 0.995–1.163, p=0.067), which does not reach the threshold for statistical significance and is consistent with no association. Combination therapy with sulfonylureas and metformin was associated with statistically significantly higher rates of incident glaucoma diagnosis compared to matched controls (aHR 1.194, 95% CI 1.075–1.326, p=0.001).
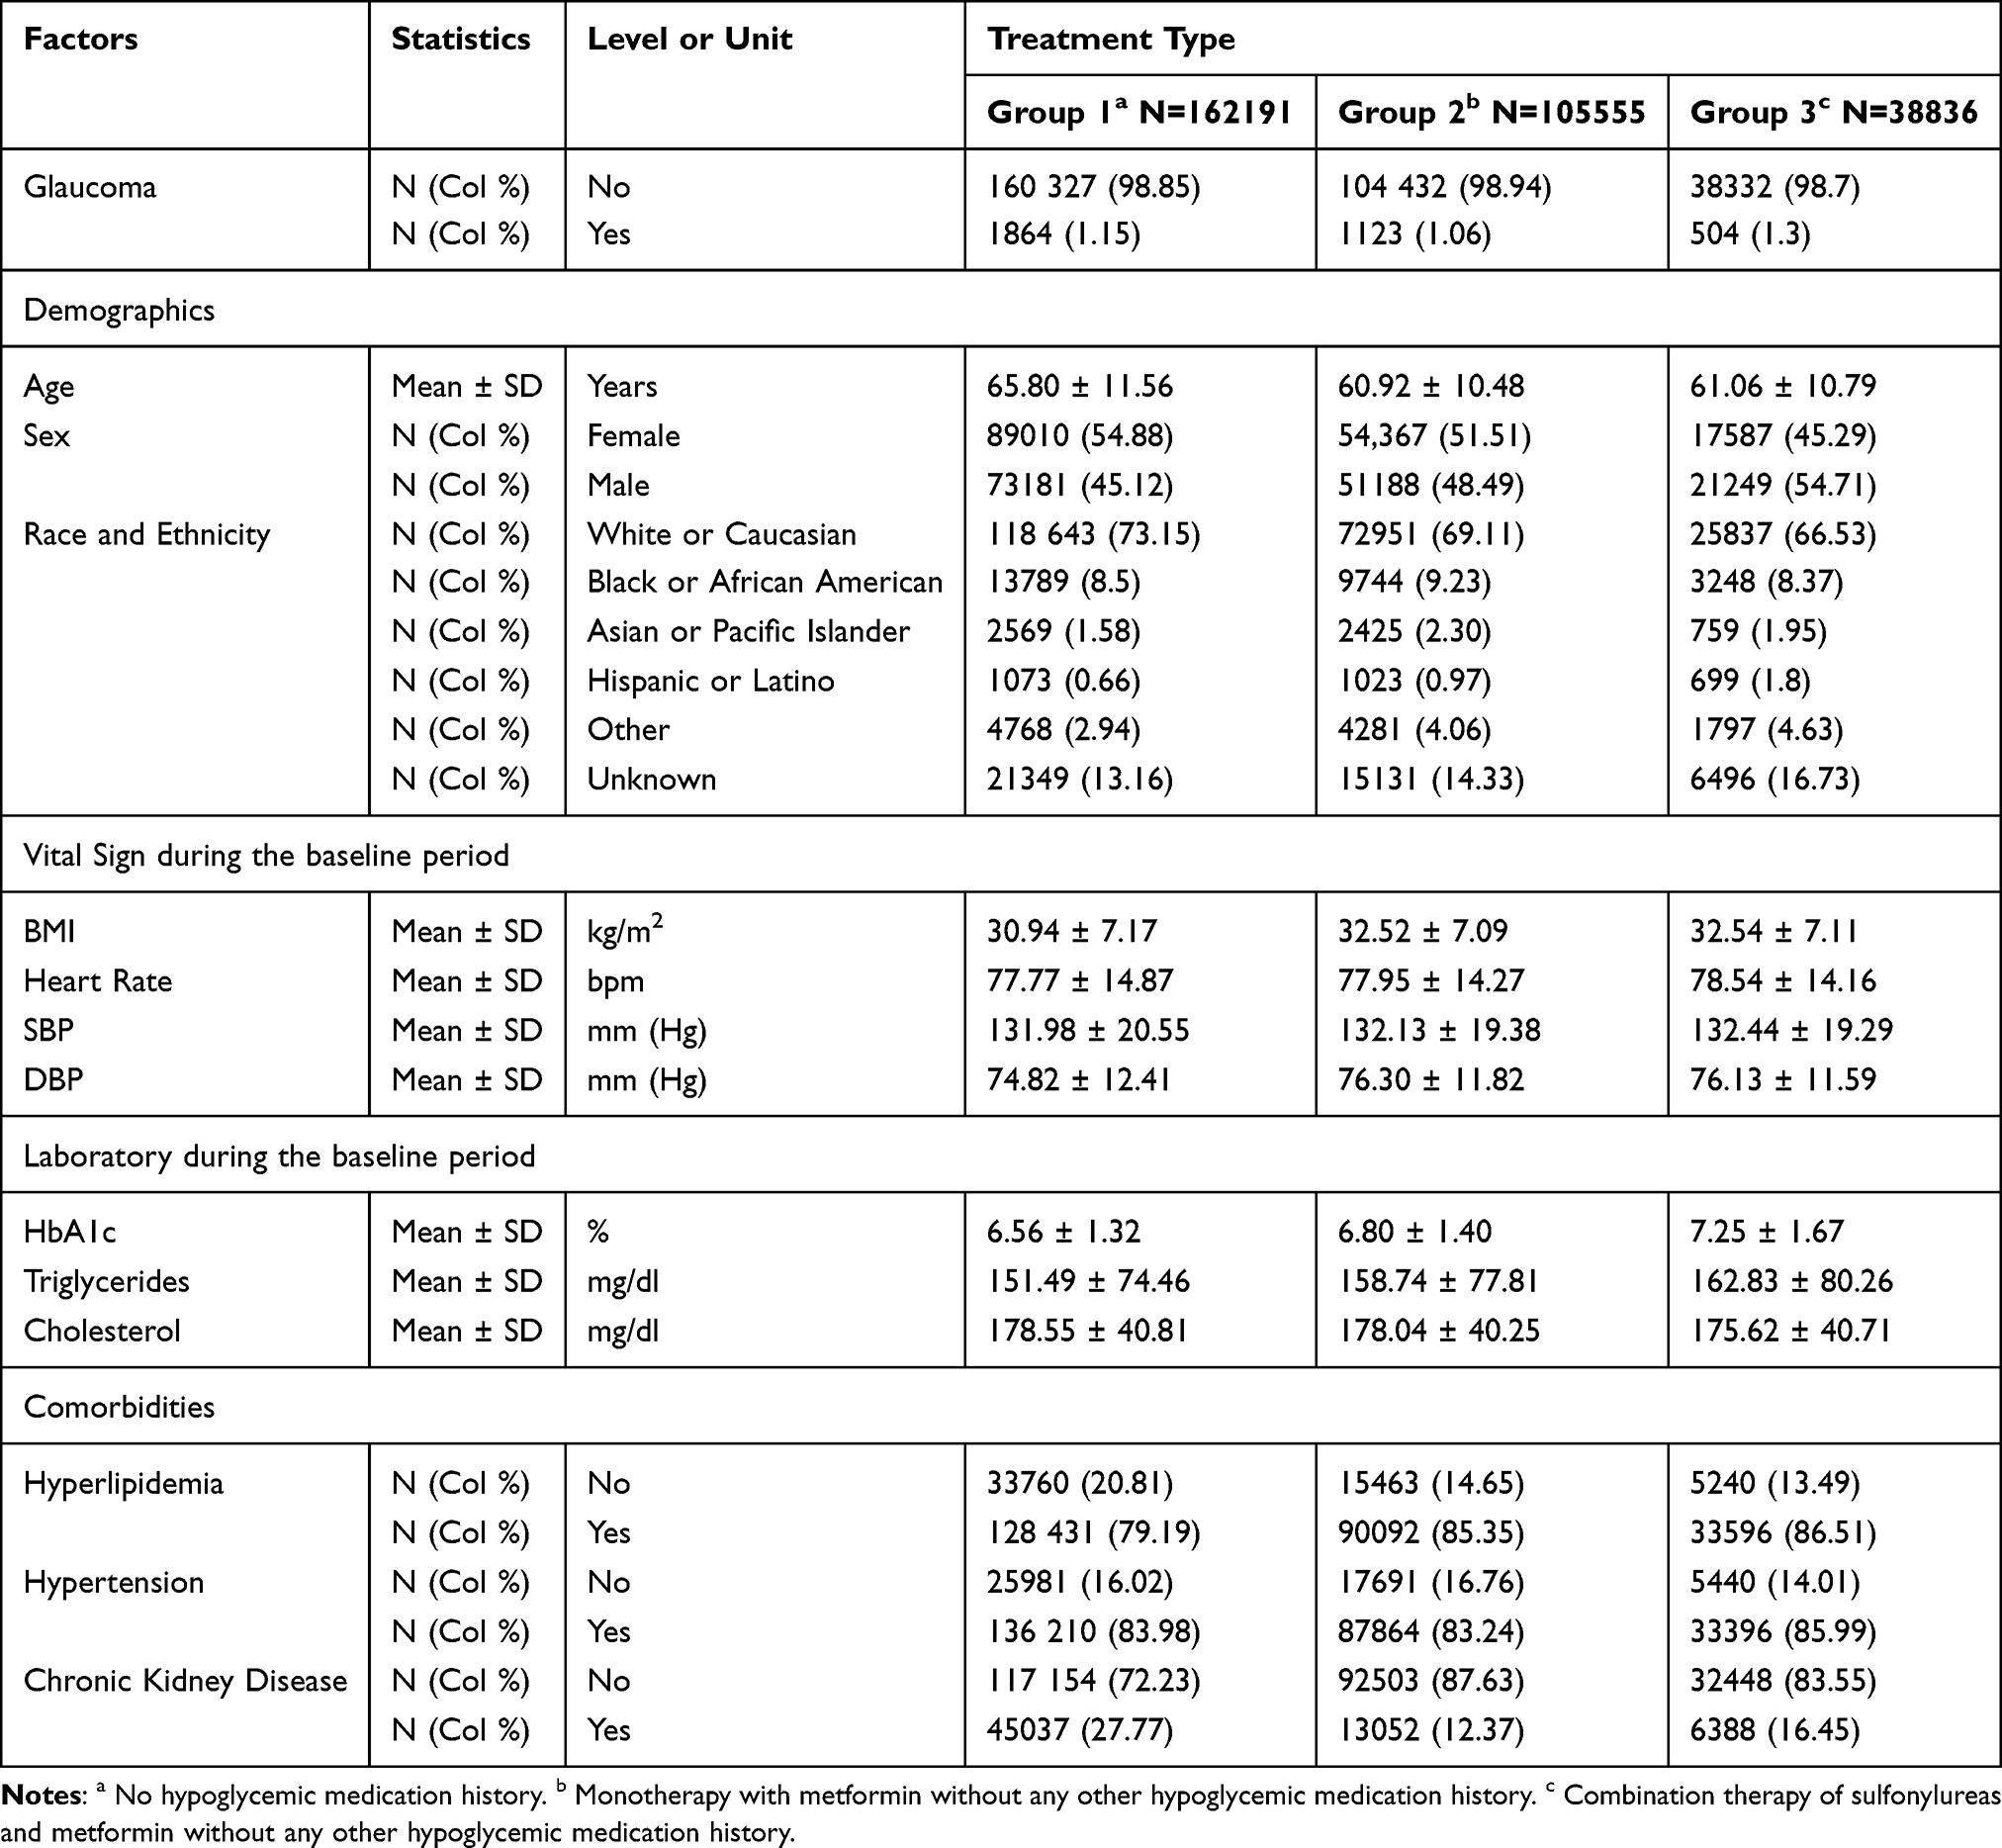 |
Table 1 Baseline Characteristics of Patients Treated with No Hypoglycemic Medications or Specific Hypoglycemic Medications |
 |
Table 2 Hazard Ratios for Incident Glaucoma by Hypoglycemic Treatment Type After 1:1 Propensity Score Matching |
Notably, both treatment groups demonstrated adjusted hazard ratios above 1.0, which contradicts the hypothesis that these medications exert direct protective effects on glaucoma pathophysiology. However, these associations reflect differences in documented glaucoma diagnosis rates in clinical records rather than direct measurements of intraocular pressure changes or optic nerve pathology. Multiple competing explanations for these observed associations are discussed below, including reverse causation, confounding by indication, and detection bias. This data is portrayed in Figure 2.
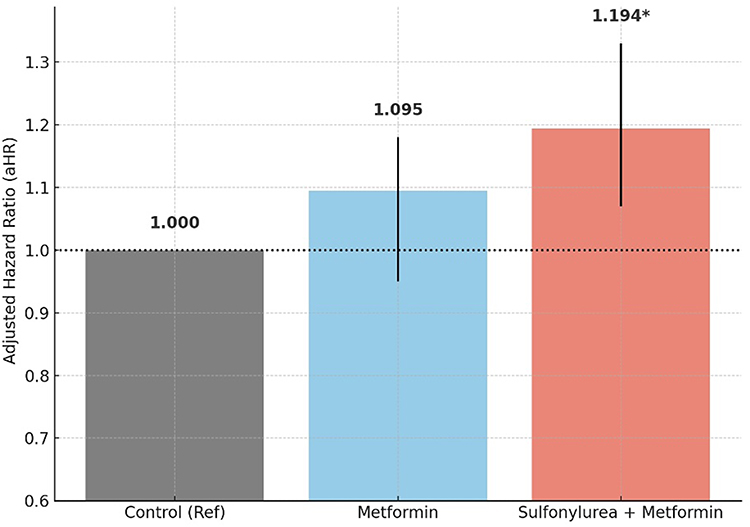 |
Figure 2 Adjusted hazard ratios for associations with incident glaucoma diagnosis by treatment group. These hazard ratios represent observational associations with documented glaucoma diagnosis rates rather than established causal effects on glaucoma pathophysiology. Combination therapy showed a statistically significant association (p=0.001, marked with *), while metformin monotherapy showed a non-significant trend (p=0.067). Error bars represent 95% confidence intervals. Multiple competing explanations for these associations are discussed in the text, including reverse causation, confounding by indication, and detection bias. |
Discussion
Before interpreting these associations as evidence of causal drug effects on glaucoma pathophysiology, it is essential to consider multiple competing explanations that our observational design cannot definitively exclude. The observed associations may reflect: true causal effects of medications on glaucoma development, reverse causation whereby patients with emerging glaucoma or elevated intraocular pressure are preferentially prescribed metformin based on prior literature suggesting protective effects, confounding by indication wherein patients requiring pharmacologic diabetes treatment have inherently higher glaucoma risk through shared pathophysiology, or detection bias through differential ophthalmologic surveillance patterns. Our retrospective observational design cannot definitively distinguish among these possibilities, which fundamentally limits causal interpretation of our findings.
These findings challenge the previously held assumptions about metformin’s protective effects against glaucoma in T2DM patients. The results indicate associations with increased glaucoma diagnosis rates for both metformin monotherapy and combination therapy with sulfonylureas, compared to untreated controls. This observation stands in notable contrast to previous studies, particularly those by Lin and Vergroesen,3,4 which suggested protective effects of metformin against glaucoma. One possible explanation for this discrepancy is differences in dosage exposure, as prior research emphasized a protective effect only at higher cumulative doses. Additionally, differences in study design and population characteristics, such as baseline ophthalmologic monitoring, may have influenced the observed associations. Lin demonstrated a 25% lower risk of developing open-angle glaucoma in high-dose metformin users, while Vergroesen found an 82% reduction in risk. The contradictory nature of our findings warrants careful consideration. However, more recent literature has challenged these findings. Several studies, including large meta-analyses, suggest that the protective effect of metformin may be dose-dependent. Notably, lower cumulative doses (<1,200g/year) have been associated with reduced glaucoma risk (HRs 0.81–0.83), while higher doses provided no clear benefit.8 These findings contradict Lin’s reported dose-response trend and may explain discrepancies with our results, which grouped all metformin users regardless of dose. The inability to assess cumulative dose in our dataset represents a key limitation and highlights the need for future dose-response analysis.
The non-significant finding for metformin monotherapy in our study (aHR 1.076, p=0.067) is consistent with recent meta-analyses by Kim et al and George et al showing no significant association between metformin use and glaucoma incidence. Our study adds to this null literature rather than contradicting it. The statistically significant finding for combination therapy with sulfonylureas (aHR 1.194, p=0.001) warrants further investigation but must be interpreted in light of the multiple potential biases discussed above.
Furthermore, recent work by Huang et al found that lower cumulative metformin doses (<1,200g/year) were associated with reduced glaucoma risk (HR 0.81–0.83), while higher doses provided no clear benefit—a finding that contradicts Lin’s reported dose-response trend. Our inability to perform dose-stratified analyses prevents us from reconciling our results with these conflicting dose-dependent findings and highlights a critical limitation of our study. If metformin’s effects are indeed dose-dependent, our approach of grouping all metformin users regardless of dose intensity may obscure true associations at specific dose ranges.
The observation that combination therapy with sulfonylureas and metformin showed a higher risk ratio compared to controls (HR 1.235, 95% CI 1.077–1.417, p = 0.002; adjusted HR 1.194, 95% CI 1.075–1.326, p = 0.001) is particularly noteworthy. This significant finding aligns with previous research by Vashisht,7 who found an elevated risk of eye-related complications with sulfonylurea use compared to other diabetic medications (HR 1.15). Moreover, metformin monotherapy (N=100,387) revealed an elevated glaucoma risk compared to matched controls (HR 1.106, 95% CI 1.014–1.207, p = 0.023; adjusted HR 1.076, 95% CI 0.995–1.163, p = 0.067). While the direct comparison between combination therapy and metformin monotherapy did not reach statistical significance, the trend suggests a potential additive effect on glaucoma risk when sulfonylureas are combined with metformin. This finding raises important questions about potential synergistic mechanisms between these medications that might influence glaucoma development.
Reverse Causation
Perhaps the most plausible alternative explanation for our findings is reverse causation, wherein the direction of the association is opposite to what we initially hypothesized. Specifically, clinicians who are aware of prior literature suggesting metformin’s potential protective effects against glaucoma may have been more likely to prescribe or intensify metformin therapy in diabetic patients showing early signs of glaucoma or elevated intraocular pressure during routine ophthalmologic screening.
This mechanism would create an apparent association between metformin use and subsequent glaucoma diagnosis even if metformin has no direct effect (protective or harmful) on ocular tissues. Consider the following scenario: A patient with type 2 diabetes undergoes comprehensive eye examination and is found to have borderline elevated IOP or early structural changes concerning for glaucoma. The ophthalmologist communicates these findings to the patient’s primary care physician or endocrinologist. The diabetes provider, having read studies by Lin et al and Vergroesen et al suggesting metformin’s protective effects, decides to initiate or escalate metformin therapy preferentially over other options, hoping to provide dual metabolic and ocular benefits. Subsequently, the patient’s glaucoma progresses to clinically diagnosable disease despite metformin treatment, and this patient now appears in our dataset as a “case” in the metformin-exposed group.
This type of confounding by indication is notoriously difficult to control in observational research. Propensity score matching can adjust for measured confounders but cannot account for unmeasured factors that influenced prescribing decisions, including subtle clinical findings (such as borderline IOP elevations or early optic nerve changes) not captured in structured electronic health record data.
Confounding by Disease Severity
A related concern is confounding by diabetes severity and overall health status. Patients requiring pharmacologic treatment for diabetes likely have more severe disease, poorer glycemic control, longer disease duration, or multiple comorbidities compared to those managed successfully with lifestyle modifications alone (our untreated control group). These same factors, advanced diabetes, poor metabolic control, vascular dysfunction, systemic inflammation, are independently associated with higher glaucoma risk through shared pathophysiologic mechanisms including microvascular damage, oxidative stress, and neuroinflammation.
Although we attempted to control for measured disease severity indicators (HbA1c, BMI, comorbidities), numerous unmeasured factors may differ between treated and untreated groups, including duration of diabetes before diagnosis, glycemic variability not captured by single HbA1c measurements, systemic inflammatory burden, genetic susceptibility to diabetic complications, and social determinants of health affecting disease management. These unmeasured confounders could explain the observed associations without requiring any direct pharmacologic effect of the medications on glaucoma development.
Detection Bias
Additionally, patients receiving regular diabetes medication management may have different patterns of healthcare utilization and ophthalmologic surveillance compared to untreated controls. Although we required comprehensive eye examinations for all participants, the frequency, quality, and thoroughness of ongoing ophthalmic care may differ systematically between groups. Patients on diabetes medications may have more frequent follow-up visits, be referred more readily to ophthalmology, undergo more intensive diagnostic testing when glaucoma is suspected, and have longer follow-up duration with more opportunities for glaucoma detection. This differential surveillance could increase apparent glaucoma incidence in medicated groups through enhanced detection rather than reflecting true differences in disease development.
Implications for Interpretation
Given these multiple plausible alternative explanations, our findings should be interpreted cautiously. Our retrospective observational design cannot definitively distinguish among these possibilities. This fundamental limitation underscores why observational associations, even when statistically significant and adjusted for measured confounders, cannot establish causality without complementary evidence from randomized controlled trials or mechanistic studies.
Interestingly, the reverse causation hypothesis could explain not only our findings but also some of the protective associations reported in prior studies. If prescribing patterns have evolved over time as awareness of potential ocular effects spread, with earlier studies capturing metformin prescribed to healthier patients and later studies (including ours) capturing metformin prescribed specifically to higher-risk patients based on prior protective literature, this could produce contradictory findings across studies that reflect changing clinical practice rather than true pharmacologic effects.
Our findings demonstrate an increased risk of open-angle glaucoma (OAG) with both metformin monotherapy and metformin-sulfonylurea combination therapy compared to controls not receiving hypoglycemic medications. Several biological mechanisms might explain the observed associations. Metformin and sulfonylureas have distinct mechanisms and act through different pathways. Metformin activates AMPK, triggering a series of metabolic effects such as suppressing hepatic gluconeogenesis, enhancing glucose uptake in muscle tissue, and improving insulin sensitivity.9–11 Sulfonylureas stimulate insulin secretion from pancreatic β-cells by binding to and closing ATP-sensitive potassium channels.12,13
While metformin is known to influence AMPK signaling pathways,14,15 its effects on intraocular pressure regulation remain poorly understood.16 As an AMPK activator, metformin alters cellular energy metabolism, potentially affecting the energy-intensive processes of aqueous humor production and outflow. Recent translational studies have provided crucial insights into AMPK’s role in trabecular meshwork bioenergetics. Chatterjee demonstrated that AMPK serves as a central regulator of extracellular matrix homeostasis and cytoskeletal arrangement in the trabecular meshwork.17 In their study, AMPKα2-null mice exhibited 6% higher intraocular pressure and decreased aqueous humor clearance compared to wild-type mice, highlighting AMPK’s critical role in maintaining normal outflow facility.17 Furthermore, cultured human trabecular meshwork cells showed that AMPK activation suppressed the expression of various extracellular matrix proteins under both basal and TGF-β2 stimulatory conditions.17
The trabecular meshwork requires substantial energy for maintaining cytoskeletal integrity and cellular homeostasis, with AMPK functioning as a critical bioenergetic sensor in these cells.18 Disruption of these energy-dependent processes could potentially impact outflow facility and increase IOP over time. Recent work by Xu has demonstrated that metformin treatment in human trabecular meshwork cells significantly activated AMPK signaling and promoted cytoskeletal recovery through the integrin/ROCK pathway, while simultaneously upregulating F-actin expression.19 This study revealed that metformin reduced reactive oxygen species production and restored damaged microfilaments in trabecular meshwork cells, suggesting complex metabolic reprogramming effects.19
However, it is important to distinguish between IOP elevation and glaucoma risk, as these are related but not equivalent phenomena. While elevated IOP is a major risk factor for glaucoma development and progression, glaucomatous optic nerve damage can occur at normal IOP levels, and conversely, some individuals with elevated IOP never develop glaucoma.20 The relationship between AMPK activation and glaucoma risk may involve mechanisms beyond simple IOP elevation. Recent research has shown that AMPK hyperactivation in retinal ganglion cells promotes dendrite retraction, synaptic loss, and neuronal dysfunction during glaucomatous stress, suggesting that AMPK dysregulation could contribute to neurodegeneration independent of IOP changes.21 This dual role of AMPK—as both a protective regulator in trabecular meshwork cells and a potentially harmful mediator in retinal ganglion cells—may explain the complex relationship between metformin use and glaucoma risk observed in our study.
A paper by Ho found that sulfonylurea use was associated with increased intraocular pressure (IOP).22 While sulfonylureas primarily target ATP-sensitive potassium (KATP) channels in pancreatic β-cells to stimulate insulin secretion, similar channels are also expressed in ocular tissues, including the trabecular meshwork and ciliary epithelium. However, the precise role of KATP channels in these tissues remains poorly characterized. Beyond KATP inhibition, sulfonylureas share structural features with sulfonamide compounds, which have been implicated in IOP elevation through nonpupillary block mechanisms, such as choroidal effusion, lenticular swelling, and anterior displacement of the lens-iris diaphragm.23–25 These mechanisms have been well-documented in cases of sulfonamide-induced secondary angle closure and may plausibly contribute to altered aqueous humor dynamics in some patients. Sulfonylureas also exhibit an estimated 10% risk of cross-reactivity with sulfa drugs, suggesting they may share similar adverse ocular effects.26 Together, these findings provide a biologically plausible explanation for the increased glaucoma risk associated with sulfonylurea use observed in our study.
These results underscore the complexity of managing chronic diseases with multiple potential complications and highlight the need for continued research into the interactions between different treatment modalities and their long-term effects on patient outcomes. Further investigation through prospective studies will be crucial for establishing causality and understanding the temporal relationship between medication use and glaucoma development.
Limitations and Future Research
This study benefits from a large sample size, the use of propensity score matching to control for confounding factors, and a comprehensive evaluation of multiple treatment modalities. However, several important limitations must be acknowledged in interpreting the findings.
Control Group Heterogeneity and Selection Bias
A significant limitation of our study design is the potential for substantial differences between our control group (patients without hypoglycemic medications) and treated groups. Patients not receiving hypoglycemic medications may represent a fundamentally different population with respect to diabetes severity, glucose control, duration of disease, or access to care. These patients may have milder diabetes, better lifestyle management, different comorbidity profiles, or may represent newly diagnosed patients who have not yet initiated pharmacotherapy. This heterogeneity could introduce confounding that propensity score matching may not fully address. Additionally, the absence of hypoglycemic medication use could indicate different healthcare utilization patterns, which may affect the likelihood of glaucoma screening and detection.
Temporal Bias and Immortal Time
Our study design carries a risk of immortal time bias, as patients in the treatment groups must survive and remain in care long enough to receive their medications, while control patients enter the study based solely on having a comprehensive eye examination. This survival requirement could artificially reduce the observed glaucoma risk in treated groups. Although we defined the index date as the date of the patient’s first eligible comprehensive eye examination after database entry, the requirement for patients to survive to treatment initiation introduces a temporal bias that may affect our risk estimates.
Database and Population Limitations
The retrospective design inherently introduces potential biases that could affect the results. Our reliance on this specific database introduces the possibility of selection bias, as it may not fully capture all relevant patient populations. Specifically, the insured population in this database likely has higher rates of glaucoma screening and detection compared to the general population, as insured individuals generally have better access to routine eye care and preventive services. This screening bias could influence estimates of glaucoma incidence and impact observed associations between medications and glaucoma risk. Additionally, our database disproportionately represents patients from specific US regions and affiliated health systems, potentially introducing geographic and institutional biases. These limitations may restrict the generalizability of our findings to broader or international populations.
Missing Glaucoma-Specific Risk Factors
This study leverages a large, well-matched sample size that offers robust statistical power to detect modest associations. However, several glaucoma-specific variables were unavailable in our dataset, which may have introduced residual confounding. Our analysis was limited by the absence of several important glaucoma-specific risk factors, including family history of glaucoma and baseline intraocular pressure measurements. Family history is one of the strongest risk factors for glaucoma development, and baseline IOP is a critical predictor of glaucoma risk. The unavailability of these variables in our dataset may have resulted in residual confounding, as patients with these risk factors might be more likely to receive certain treatments or have different baseline glaucoma risk profiles. Additionally, we lacked information on central corneal thickness, cup-to-disc ratio, visual field data, and other structural measures that influence glaucoma risk assessment and could affect the accuracy of our glaucoma case identification.
Medication Adherence and Dosing
While we identified associations between medication use and glaucoma development, we could not assess medication adherence or dosing patterns. Our analysis assumes that prescriptions filled were consistently taken as directed, which may not reflect actual medication exposure. Poor adherence could dilute effect estimates and potentially explain some of the observed associations. Furthermore, we were unable to assess cumulative drug exposure (defined daily dose), which limits the ability to evaluate dose-response relationships. Prior studies have shown that metformin’s effects on glaucoma risk may vary with cumulative dose, and our inability to examine this prevents us from reconciling our findings with the broader literature.
Causality and Surveillance Bias
The retrospective nature of the analysis prevents us from establishing causality between medication use and glaucoma development. Furthermore, surveillance bias could be a factor, as patients receiving regular diabetes care may have more frequent ophthalmologic evaluations, increasing the likelihood of glaucoma diagnosis compared to untreated controls. Although a comprehensive eye exam was required for control patients, residual detection bias remains a possibility, particularly if the frequency or quality of eye examinations differed between groups.
Mechanistic Understanding
While we discuss potential biological mechanisms below, we emphasize that these remain speculative hypotheses. Our observational data cannot establish whether the observed associations reflect true causal effects of medications on glaucoma biology or are instead driven by unmeasured confounding, reverse causation, and detection bias inherent to retrospective claims-based research. The mechanistic pathways described should be viewed as hypotheses that could explain potential drug effects if such effects exist, but they do not constitute evidence that such effects actually occur in clinical practice. The proposed biological mechanisms remain largely theoretical due to limited direct literature examining how these medications specifically affect ocular tissues. While we have described potential pathways through AMPK signaling and KATP channels, the actual mechanistic relationships require validation through controlled experimental studies.
Inability to Perform Sensitivity Analyses for Temporal Biases
The structure of our dataset precluded implementation of advanced sensitivity analyses such as time-dependent Cox models, landmark analyses, or inverse probability-weighted marginal structural models that could help address immortal time bias and time-varying exposure. Specifically, we have prescription fill dates but lack precise medication start/stop dates and day-by-day exposure status required for time-varying covariates. Patients in treatment groups must survive and remain enrolled in care long enough to receive their medications, while control patients enter the study based solely on having a comprehensive eye examination. This survival requirement could artificially affect the observed associations, though the direction of bias is unclear given competing mechanisms (immortal time bias favoring treated groups vs reverse causation favoring controls). We acknowledge this represents an important limitation and emphasize that prospective studies with clearly defined exposure periods are essential to address this concern definitively.
Unmeasured Confounding by Diabetes Duration and Healthcare Utilization
Our propensity score model did not include explicit measures of diabetes duration from initial disease onset or healthcare utilization frequency. These represent important potential confounders that may influence both medication selection patterns and glaucoma detection rates. Patients with longer diabetes duration may be more likely to receive treatment intensification and undergo more comprehensive ophthalmologic screening. Higher healthcare utilization may independently increase glaucoma detection through increased surveillance, creating apparent associations with medications that reflect detection bias rather than true disease incidence. These unmeasured factors could contribute to residual confounding in our estimates despite matching on measured clinical parameters.
Inability to Test High-Dose Metformin Protection Hypothesis
A frequently cited finding in the literature is that metformin may only exert protective effects against glaucoma at high cumulative doses. Our dataset did not include sufficient detail on prescription strength, quantity, or treatment duration to calculate cumulative drug exposure (defined daily doses). Therefore, we cannot determine whether our findings of no protective effect, or potentially increased associations, apply uniformly across all dose ranges or whether high-dose users might show different patterns. This represents a critical gap in our analysis and prevents direct comparison with dose-stratified findings from prior studies. The conflicting dose-response relationships reported in the literature (Lin: protection at >1,110g; Huang: protection at <1,200g/year, no benefit at higher doses) cannot be evaluated with our data.
Reverse Causation as Primary Alternative Explanation
Perhaps most critically, reverse causation represents a plausible alternative explanation whereby clinicians, aware of literature suggesting metformin’s potential protective effects, may have preferentially prescribed or escalated metformin therapy in diabetic patients showing early signs of glaucoma or elevated IOP during routine screening. This protopathic bias is notoriously difficult to control in observational research and could fully explain our observed associations without requiring any direct drug effect on ocular tissues. Our study design cannot distinguish between this mechanism and true causal effects.
Future Research Directions
Given these limitations, several key areas warrant further investigation. Prospective studies are needed to confirm these findings and establish causality, particularly regarding the temporal relationship between medication initiation and glaucoma development. Future studies should consider using active comparators (comparing different diabetes medications) or time-to-treatment analyses to better control for treatment selection bias. Time-dependent Cox models or landmark analyses could help address immortal time bias.
The role of medication adherence and dosing patterns requires examination through prospective monitoring with objective adherence measures. Pharmacogenetic studies may help identify high-risk subgroups based on genetic factors that could not be accounted for in our current study. Additionally, the role of newer diabetes medications, such as GLP-1 receptor agonists, in modifying glaucoma risk warrants further investigation, as this study was limited to older therapeutic options.27 A recent study by Muayad revealed that GLP-1 receptor agonists offer significant protection against primary open-angle glaucoma and ocular hypertension in patients with T2DM, compared to those treated with metformin.28
Exploring potential biomarkers to predict individual risk could help personalize treatment approaches, addressing the limitation of our current one-size-fits-all risk assessment. Translational studies examining the effects of these medications on cultured trabecular meshwork cells, animal models of glaucoma, and human ocular tissues could provide mechanistic insights to support or refute our clinical observations.
These limitations and areas for future research highlight the complexity of managing chronic diseases with multiple potential complications. Our results underscore the need for continued research into the interactions between diabetes treatments and their long-term effects on patient outcomes, particularly through prospective studies that can overcome the limitations inherent in this retrospective design.
Conclusion
This large-scale retrospective cohort study examined associations between common diabetes medications and incident glaucoma diagnosis in type 2 diabetes patients. Our findings revealed a non-significant trend for metformin monotherapy (aHR 1.076, 95% CI 0.995–1.163, p=0.067) and a statistically significant association for combination therapy with sulfonylureas (aHR 1.194, 95% CI 1.075–1.326, p=0.001) compared to untreated controls. The non-significant finding for metformin monotherapy aligns with recent meta-analyses finding no association, while the significant finding for combination therapy warrants further investigation.
However, multiple fundamental limitations prevent us from drawing definitive causal conclusions from these observational data. Most critically, reverse causation represents a plausible alternative explanation whereby clinicians aware of literature suggesting metformin’s potential protective effects may have preferentially prescribed or intensified metformin therapy in diabetic patients showing early signs of glaucoma or elevated intraocular pressure. Additionally, confounding by indication means that patients requiring pharmacologic diabetes treatment likely have more severe disease and more systemic complications than those managed with lifestyle alone—factors that independently increase glaucoma risk through shared pathophysiologic mechanisms. Detection bias through differential ophthalmologic surveillance patterns between groups could also inflate apparent glaucoma incidence through enhanced detection rather than true disease differences. Furthermore, critical unmeasured confounders including diabetes duration, cumulative medication dose, treatment adherence, family history of glaucoma, and baseline intraocular pressure were unavailable, limiting our ability to fully adjust for confounding. Given these substantial limitations, our findings should be interpreted as hypothesis-generating observations requiring prospective validation rather than as definitive evidence of causal drug effects.
Metformin and sulfonylureas remain appropriate first- and second-line therapies for type 2 diabetes based on their established efficacy for glycemic control and cardiovascular outcomes. Our observational findings do not provide sufficient evidence to alter prescribing patterns or treatment guidelines. Clinicians should continue selecting diabetes medications based on metabolic efficacy, safety profiles, patient preferences, and cost - not on speculative ocular effects suggested by inconsistent observational data. Clinicians should not prescribe or avoid metformin based on perceived glaucoma effects, as neither protective nor harmful effects have been definitively established. The prior literature suggesting protection and our current findings suggesting possible associations with increased diagnosis rates likely both reflect confounding, reverse causation, and detection bias rather than true causal drug effects.
For all patients with type 2 diabetes, regardless of medication regimen, regular comprehensive ophthalmologic examinations remain essential for early detection of diabetic retinopathy, glaucoma, and other ocular complications. Our findings reinforce rather than change this existing clinical guidance.
This study contributes to ongoing scientific dialogue about diabetes medication effects on ocular health by providing large-scale evidence from a diverse US healthcare database. Our findings serve as a corrective to premature claims of protective effects while acknowledging that we cannot definitively establish harmful effects either. The inconsistency across observational studies likely reflects the profound challenges of controlling confounding in observational pharmacoepidemiology rather than revealing true pharmacologic effects. By explicitly discussing reverse causation, confounding by indication, and detection bias, we hope this manuscript helps readers critically evaluate not only our findings but also the broader literature on medication-glaucoma associations. The fundamental lesson is that observational associations, even when statistically significant and adjusted for measured confounders, cannot establish causality - a principle that applies to claims of both protective and harmful effects.
Until prospective randomized evidence becomes available, the relationship between diabetes medications and glaucoma risk remains uncertain. Clinicians and patients should approach claims of ocular benefits or harms with appropriate skepticism, focusing instead on the well-established metabolic benefits that justify these medications’ widespread use in type 2 diabetes management.
Ethics Approval and Informed Consent
This study (HSC-SPH-22-0465; Reference Number: 231013) was reviewed by the Committee for the Protection of Human Subjects (CPHS), UTHealth. The CPHS determined that the project does not meet the regulatory definition of human subjects research, as it involves secondary analysis of de-identified data. Therefore, no further IRB review or informed consent was required.
Acknowledgments
The authors acknowledge support from the Susan and Richard Anderson Distinguished Chair in Ophthalmology. The authors also acknowledge Oluwadotun Balogun for generating the summary statistics report for the control group, as well as the Center for Health Care Data at UTHealth Houston SPH for extracting and providing the EHR data.
The abstract of this paper was presented at the ARVO Annual Meeting as a poster presentation with interim findings. The poster’s abstract was published in “Poster Abstracts” in Investigative Ophthalmology & Visual Science: https://iovs.arvojournals.org/article.aspx?articleid=2804549.
Disclosure
The authors report no conflicts of interest in this work.
References
1. Sacks DB, Arnold M, Bakris GL, et al. Guidelines and recommendations for laboratory analysis in the diagnosis and management of diabetes mellitus. Diabetes Care. 2023;46(10):e151–16. doi:10.2337/dci23-0036
2. Qaseem A, Barry MJ, Humphrey LL, et al. Oral pharmacologic treatment of type 2 diabetes mellitus: a clinical practice guideline update from the American College of Physicians. Ann Intern Med. 2017;166(4):279–290. doi:10.7326/M16-1860
3. Lin HC, Stein JD, Nan B, et al. Association of geroprotective effects of metformin and risk of open-angle glaucoma in persons with diabetes mellitus. JAMA Ophthalmol. 2015;133(8):915–923. doi:10.1001/jamaophthalmol.2015.1440
4. Vergroesen JE, Thee EF, Ahmadizar F, et al. Association of diabetes medication with open-angle glaucoma, age-related macular degeneration, and cataract in the Rotterdam Study. JAMA Ophthalmol. 2022;140(7):674–681. doi:10.1001/jamaophthalmol.2022.1435
5. George R, Asokan R, Vijaya L. Association of metformin use among diabetics and the incidence of primary open-angle glaucoma: the Chennai Eye Disease Incidence Study. Indian J Ophthalmol. 2021;69(11):3336–3338. doi:10.4103/ijo.IJO_1486_21
6. Kim HK, Lee W, Ryu IH, Kim JK, Kim H, Yoo TK. Association between metformin use and the risk of developing open-angle glaucoma among patients with diabetes: a retrospective cohort study and meta-analysis. Int Ophthalmol. 2024;44(1):6. doi:10.1007/s10792-024-02945-w
7. Vashisht R, Jung K, Schuler A, et al. Association of hemoglobin A1c levels with use of sulfonylureas, dipeptidyl peptidase 4 inhibitors, and thiazolidinediones in patients with type 2 diabetes treated with metformin: analysis from the observational health data sciences and informatics initiative. JAMA Netw Open. 2018;1(4):e181755. doi:10.1001/jamanetworkopen.2018.1755
8. Huang SW, Lai YR, Yang Y, et al. Association between long-term metformin use and risk of open-angle glaucoma in patients with diabetes mellitus. J Glaucoma. 2025;34:693–701. doi:10.1097/IJG.0000000000002597
9. Pernicova I, Korbonits M. Metformin—mode of action and clinical implications for diabetes and cancer. Nat Rev Endocrinol. 2014;10(3):143–156. doi:10.1038/nrendo.2013.256
10. Shaw RJ, Lamia KA, Vasquez D, et al. The kinase LKB1 mediates glucose homeostasis in liver and therapeutic effects of metformin. Science. 2005;310(5754):1642–1646. doi:10.1126/science.1120781
11. McIntyre HD, Craft IL, Chester N, Cameron DP. Metformin increases insulin sensitivity and basal glucose clearance in type 2 (non-insulin dependent) diabetes mellitus. Aust N Z J Med. 1991;21(5):714–719. doi:10.1111/j.1445-5994.1991.tb01375.x
12. Harrower AD. Comparative tolerability of sulphonylureas in diabetes mellitus. Drug Saf. 2000;22(4):313–320. doi:10.2165/00002018-200022040-00004
13. Scott LJ. Repaglinide: a review of its use in type 2 diabetes mellitus. Drugs. 2012;72(2):249–272. doi:10.2165/11207600-000000000-00000
14. Rena G, Hardie DG, Pearson ER. The mechanisms of action of metformin. Diabetologia. 2017;60(9):1577–1585. doi:10.1007/s00125-017-4342-z
15. Foretz M, Guigas B, Bertrand L, Pollak M, Viollet B. Metformin: from mechanisms of action to therapies. Cell Metab. 2014;20(6):953–966. doi:10.1016/j.cmet.2014.09.018
16. Hurley DJ, Irnaten M, O’Brien C. Metformin and glaucoma—review of anti-fibrotic processes and bioenergetics. Cells. 2021;10(8):2131. doi:10.3390/cells10082131
17. Chatterjee A, Villarreal G, Oh DJ, Kang MH, Rhee DJ. AMP-activated protein kinase regulates intraocular pressure, extracellular matrix, and cytoskeleton in trabecular meshwork. Invest Ophthalmol Vis Sci. 2014;55(5):3127–3139. doi:10.1167/iovs.13-12755
18. Shukal DK, Malaviya PB, Sharma T. Role of the AMPK signalling pathway in the aetiopathogenesis of ocular diseases. Ther Adv Chronic Dis. 2022;13:20406223211063165.
19. Xu L, Zhang X, Zhao Y, et al. Metformin protects trabecular meshwork against oxidative injury via activating integrin/ROCK signals. Elife. 2023;12:e81198.
20. Weinreb RN, Aung T, Medeiros FA. The pathophysiology and treatment of glaucoma: a review. JAMA. 2014;311(18):1901–1911. doi:10.1001/jama.2014.3192
21. Harder JM, Braine CE, Williams PA, et al. AMPK hyperactivation promotes dendrite retraction, synaptic loss, and neuronal dysfunction in glaucoma. Mol Neurodegener. 2021;16(1):43. doi:10.1186/s13024-021-00466-z
22. Ho H, Shi Y, Chua J, et al. Association of systemic medication use with intraocular pressure in a multiethnic Asian population: the Singapore Epidemiology of Eye Diseases Study. JAMA Ophthalmol. 2017;135(3):196–202. doi:10.1001/jamaophthalmol.2016.5318
23. Panday VA, Rhee DJ. Review of sulfonamide-induced acute myopia and acute bilateral angle-closure glaucoma. Compr Ophthalmol Update. 2007;8(5):271–276.
24. Ikeda N, Ikeda T, Nagata M, Mimura O. Ciliochoroidal effusion syndrome induced by sulfa derivatives. Arch Ophthalmol. 2002;120(12):1775. doi:10.1001/archopht.120.12.1775
25. Tripathi RC, Tripathi BJ, Haggerty C. Drug-induced glaucomas: mechanism and management. Drug Saf. 2003;26(11):749–767. doi:10.2165/00002018-200326110-00002
26. Strom BL, Schinnar R, Apter AJ, et al. Absence of cross-reactivity between sulfonamide antibiotics and sulfonamide nonantibiotics. N Engl J Med. 2003;349(17):1628–1635. doi:10.1056/NEJMoa022963
27. Xie Y, Choi T, Al-Aly Z. Mapping the effectiveness and risks of GLP-1 receptor agonists. Nat Med. 2025. doi:10.1038/s41591-024-03412-w
28. Muayad J, Loya A, Hussain ZS, et al. Comparative effects of glucagon-like peptide 1 receptor agonists and metformin on glaucoma risk in patients with type 2 diabetes. Ophthalmology. 2025;132(3):271–279. doi:10.1016/j.ophtha.2024.08.023
 © 2026 The Author(s). This work is published and licensed by Dove Medical Press Limited. The
full terms of this license are available at https://www.dovepress.com/terms
and incorporate the Creative Commons Attribution
- Non Commercial (unported, 4.0) License.
By accessing the work you hereby accept the Terms. Non-commercial uses of the work are permitted
without any further permission from Dove Medical Press Limited, provided the work is properly
attributed. For permission for commercial use of this work, please see paragraphs 4.2 and 5 of our Terms.
© 2026 The Author(s). This work is published and licensed by Dove Medical Press Limited. The
full terms of this license are available at https://www.dovepress.com/terms
and incorporate the Creative Commons Attribution
- Non Commercial (unported, 4.0) License.
By accessing the work you hereby accept the Terms. Non-commercial uses of the work are permitted
without any further permission from Dove Medical Press Limited, provided the work is properly
attributed. For permission for commercial use of this work, please see paragraphs 4.2 and 5 of our Terms.