Back to Journals » Risk Management and Healthcare Policy » Volume 14
Geriatric Nutritional Risk Index as a Prognostic Factor for Mortality in Elderly Patients with Moderate to Severe Traumatic Brain Injuries
Authors Su WT, Tsai CH, Huang CY, Chou SE, Li C, Hsu SY, Hsieh CH ![]()
Received 7 April 2021
Accepted for publication 3 June 2021
Published 10 June 2021 Volume 2021:14 Pages 2465—2474
DOI https://doi.org/10.2147/RMHP.S314487
Checked for plagiarism Yes
Review by Single anonymous peer review
Peer reviewer comments 2
Editor who approved publication: Professor Marco Carotenuto
Wei-Ti Su,1 Ching-Hua Tsai,1 Chun-Ying Huang,1 Sheng-En Chou,1 Chi Li,1 Shiun-Yuan Hsu,1 Ching-Hua Hsieh2
1Department of Trauma Surgery, Kaohsiung Chang Gung Memorial Hospital and Chang Gung University College of Medicine, Kaohsiung, Taiwan; 2Department of Plastic Surgery, Kaohsiung Chang Gung Memorial Hospital and Chang Gung University College of Medicine, Kaohsiung, Taiwan
Correspondence: Ching-Hua Hsieh
Department of Plastic Surgery, Kaohsiung Chang Gung Memorial Hospital and Chang Gung University College of Medicine, No. 123, Ta-Pei Road, Niao-Song District, Kaohsiung City, 833, Taiwan
Tel +886-7-7327476
Email [email protected]
Background: The Geriatric Nutritional Risk Index (GNRI) is a simple and objective screening tool for clinicians to screen patients’ nutritional status based on serum albumin level and their weight and height. The original study had divided patients based on GNRI into quartiles of nutritional risk for death: a no-risk group (GNRI > 98), a low-risk group (GNRI 92– 98), a moderate-risk group (GNRI 82 to < 92), and a major-risk group (GNRI < 82). Given that the patients generally sustained traumatic brain injury (TBI) in an acute condition, the study aimed to explore whether GNRI presents a prognostic value for the mortality outcome of these patients.
Methods: From January 1, 2009, to December 31, 2019, 581 elderly patients with moderate to severe TBI, which was defined as sustaining a head Abbreviated Injury Scale ≥ 3, was included in the study population. The collected data included age, sex, body mass index, serum albumin levels at admission, preexisting comorbidities, Glasgow Coma Scale, and Injury Severity Score. The primary outcome in the comparison was in-hospital mortality.
Results: Multivariate logistic regression analysis revealed that GNRI, ESRD, and ISS were significant independent risk factors for mortality in patients with moderate to severe TBI. When subgrouping the study population into four nutritional risk categories according to the quartile deviation as Q1 (GNRI < 85, n = 145), Q2 (GNRI 85 to < 93.8 n = 145), Q3 (GNRI 93.8 to 103, n = 145), and Q4 (GNRI > 103, n = 146), Q1 patients had a significantly longer LOS in hospital (25.2 days vs 18.6 days, respectively; p = 0.004) and higher mortality rate (28.3% vs 11.7%, respectively; p < 0.001) than Q4 patients. The mortality rate was significantly higher in Q1 patients than in Q4 patients (OR, 2.8; 95% CI, 1.14– 6.78; p = 0.021).
Conclusion: This study revealed that the GNRI is a significant independent risk factor and a promising simple assessment tool for mortality in elderly patients with moderate to severe TBI.
Keywords: elderly, malnutrition, mortality, Geriatric Nutritional Risk Index, GNRI, trauma, traumatic brain injury, TBI
Background
To date, traumatic brain injury (TBI) remains one of the leading causes of death worldwide.1 The Glasgow Coma Scale (GCS), consisting of evaluation of eye-opening, verbal, and motor responses, has been used as a triage tool to assess the severity of neurologic deficits and predict the prognosis in patients with TBI,2–6 who can be accordingly categorized into severe (GCS score, 3–8), moderate (GCS score, 9–12), or mild (GCS score, 13–15) TBI.7 The Abbreviated Injury Scale (AIS) was developed in 1971 to measure an anatomy-based injury severity with a simple score to rank specific injuries in the trauma patients.8 The AIS scores are created according to many dimensions of the injury, including impacted energy, extent of organ damage, threat to life, permanent impairment, and period of management,1 to assess the severity of the anatomical injury on a 6-point ordinal scale ranging from minor (1), moderate (2), serious (3), severe (4), critical (5), to un-survivable injury (6). Therefore, AIS 3–4 had been used defined moderate TBI, while AIS 5 severe TBI.9,10 It had been estimated that the patients sustained an AIS of 3 isolated head injuries would have a mortality rate of 1.6%, and an AIS of 4 and 5 with a mortality rate of 4.8% and 44.3%, respectively.11 AIS is also the fundamental basis of several severity scoring systems, such as the Injury Severity Score (ISS),12 which can be used to define the patients as mildly or moderately injured patients (ISS <16), severely injured patients (ISS ≥16), and critically injured patients (ISS ≥ 25).13
TBI also remains the most important single injury contributing to the mortality and morbidity of the older patients.1 In geriatric patients, malnutrition is common,14 often underdiagnosed,15 and considered to be one of the contributing factors for worse outcomes during hospitalization.16–18 Buzby et al proposed the Nutritional Risk Index (NRI), calculated based on the level of albumin, current body weight, and usual body weight, to evaluate the association between nutrition and postoperative complications.19 However, because half of the elderly patients cannot remember their own usual body weight, it is often difficult to calculate the NRI in the clinical setting.20 Hence, Bouillanne et al introduced the Geriatric Nutritional Risk Index (GNRI) in 2005 to evaluate the 6-month midterm nutritional outcomes of elderly medical patients admitted to a rehabilitation unit.21 They divided patients into four groups: a no-risk group (GNRI >98), a low-risk group (GNRI 92–98), a moderate-risk group (GNRI 82 to <92), and a major-risk group (GNRI <82), and suggested that the risk of infectious complications or mortality was significantly higher in the major-, moderate-, and low-risk groups than in the no-risk group.21 With the replacement of the usual body weight in calculating NRI using the ideal body weight,21 GNRI acts as a simple and objective index to assess the nutrition-related risk for morbidity and mortality in hospitalized elderly patients.22,23
GNRI has been reported to be a strong prognostic factor for certain malignancies24,25 and long-term postoperative outcomes.26–30 Several studies have also reported the usefulness of GNRI in assessing the outcomes of various clinical conditions, including chronic kidney disease,31 heart failure,32 chronic obstructive pulmonary disease,33 and patients on chronic hemodialysis.34 One might have assumed that GNRI was more suitable under chronic or subacute care settings, although some studies have demonstrated its prognostic value for short-term hospital mortality in hospitalized patients with acute illness35 and sepsis.36 Given that patients with TBI present a specific population, as the patients always get injured abruptly and acutely, we are interested in clarifying if GNRI presents a prognostic value to link the nutritional status and mortality outcome of these patients. Therefore, this study was designed to identify the association between admission GNRI and mortality outcomes of elderly patients with moderate to severe TBI.
Methods
Study Population and Data Collection
As shown in Figure 1, of the total 39,135 enrolled patients injured by all trauma causes and hospitalized for treatment between January 1, 2009, and December 31, 2019, there were 10,790 elderly patients aged ≥65 years. There were 2,213 elderly patients with moderate to severe TBI, defined as sustaining an Abbreviated Injury Scale (AIS) ≥3 in the head region. After exclusion of those patients who had incomplete data of albumin or weight and height (n = 1,632), 581 elderly patients with moderate to severe TBI were enrolled into the study population. The study population was categorized into two groups: mortality (n = 125) and survival (n = 575) or four nutritional risk categories (Q1, Q2, Q3, and Q4) according to the quartile deviation. The medical information of these patients was extracted from the trauma registry system of the hospital.37–39 The collected data included age, sex, body mass index (BMI), serum albumin levels at admission, preexisting comorbidities (diabetes mellitus [DM], hypertension [HTN], coronary artery disease [CAD]), congestive heart failure [CHF], cerebral vascular accident [CVA], end-stage renal disease [ESRD]), GCS, and Injury Severity Score (ISS). The in-hospital mortality and length of stay (LOS) in hospital were measured as the primary and secondary outcomes, respectively. ISS was obtained from the sum of the squares of the three highest AIS scores in different body regions and represented the injury severity of the patients.40,41 The ideal body weight was defined using the equations (body height in cm − 80) × 0.7 for men and (body height in cm − 70) × 0.6 for women. The GNRI was calculated as follows: [1.489 × albumin (g/dl) + 41.7 × (pre-body weight/ideal body weight)]. The study was conducted according to the guidelines of the Declaration of Helsinki, and approved by the Institutional Review Board of Chang Gung Memorial Hospital with approval number 202001446B0. According to IRB regulations, the need for informed consent was waived due to the study design, which involved a retrospective analysis of the registered database. Patient data confidentiality was kept.
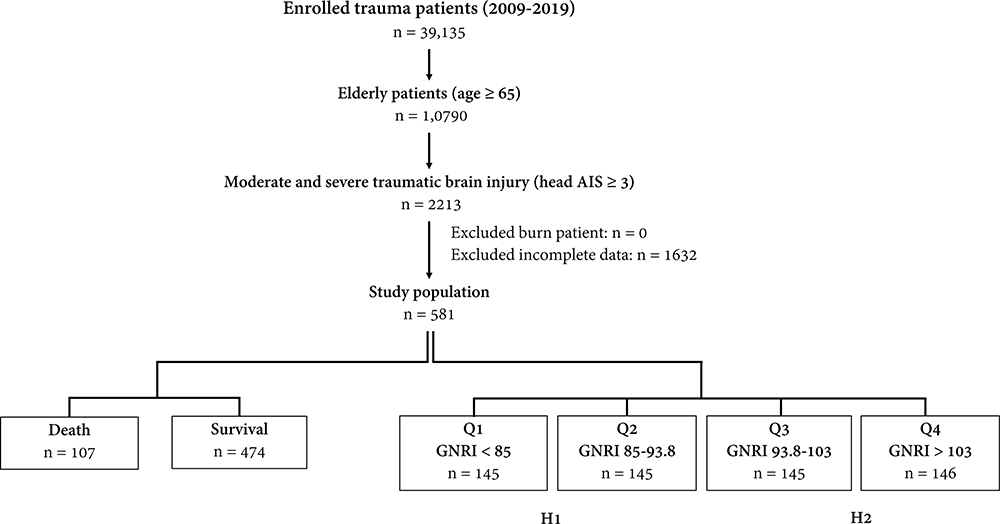 |
Figure 1 Flow chart illustrating the inclusion of elderly patients with moderate to severe traumatic brain injury, with the allocation of these patients into groups of mortality and survival or groups of four nutritional risk categories. |
Statistical Analyses
The Kolmogorov–Smirnov test was used to assess the normalization of the distributed data for continuous variables. The unpaired Student’s t-test and Mann–Whitney U-test were used to analyze normally and non-normally distributed continuous data, respectively. The results are expressed as mean ± standard deviation, with ISS presented as median and interquartile range (IQR, Q1–Q3). The categorical data were compared using two-sided Fisher’s exact or Pearson’s χ2 test. Univariate predictive variables resulting in mortality of the patients were identified, and multivariate logistic regression analysis was used to identify the independent risk factors for mortality, with the presentation of odds ratios (ORs) and 95% confidence intervals (CIs). In this study, all statistical analyses were performed using Windows version 23.0 for SPSS (IBM Inc., Chicago, IL, USA). To minimize the confounding effects of sex, age, comorbidities, and injury severity of patients on outcome measurements due to a nonrandomized assignment of the study population, a logistic regression model was used to calculate the propensity scores with the aforementioned covariates and then, 1:1 propensity score-matched patient populations were created using the NCSS 10 software (NCSS statistical software, Kaysville, UT, USA) with the greedy method. P values <0.05 were considered statistically significant.
Results
Patient and Injury Demographics
There was no significant difference in gender predominance, age, and BMI between the mortality group (n = 125) and survival group (n = 575) of the study population (Table 1). The mortality group presented a significantly lower level of albumin (3.0 ± 0.8 vs 3.4 ± 0.6 g/dL; p < 0.001) and GNRI (90.4 ± 12.9 vs 95.0 ± 11.6, respectively; p < 0.001) than the survival group. There were no significant intergroup differences in the prevalence of preexisting comorbidities except for a significantly higher rate of CAD (21.5% vs 13.1%, respectively; p = 0.026) and ESRD (11.2% vs 4.0%, respectively; p = 0.003) in the mortality group than in the survival group. A significantly lower GCS was found in the mortality group than in the survival group (median [IQR]:84–15 vs 14,10–15 respectively; p < 0.001). When stratified by GCS (3–8, 9–12, or 13–15), significantly more patients had scores of 3–8 but fewer had scores of 13–15 in the mortality group than in the survival group. A significantly higher ISS was found in the mortality group than in the survival group (median [IQR]: 2516–29 vs 17,16–25 respectively; p < 0.001). When stratified by ISS (1–15, 16–24, or ≥25), there were significantly more patients with an ISS of ≥25, but fewer mortal patients with scores of 1–15 and 16–24 than survival patients. Patients in the mortality group had a significantly shorter LOS in the hospital (16.8 days vs 23.8 days, respectively; p = 0.001) than those in the survival group.
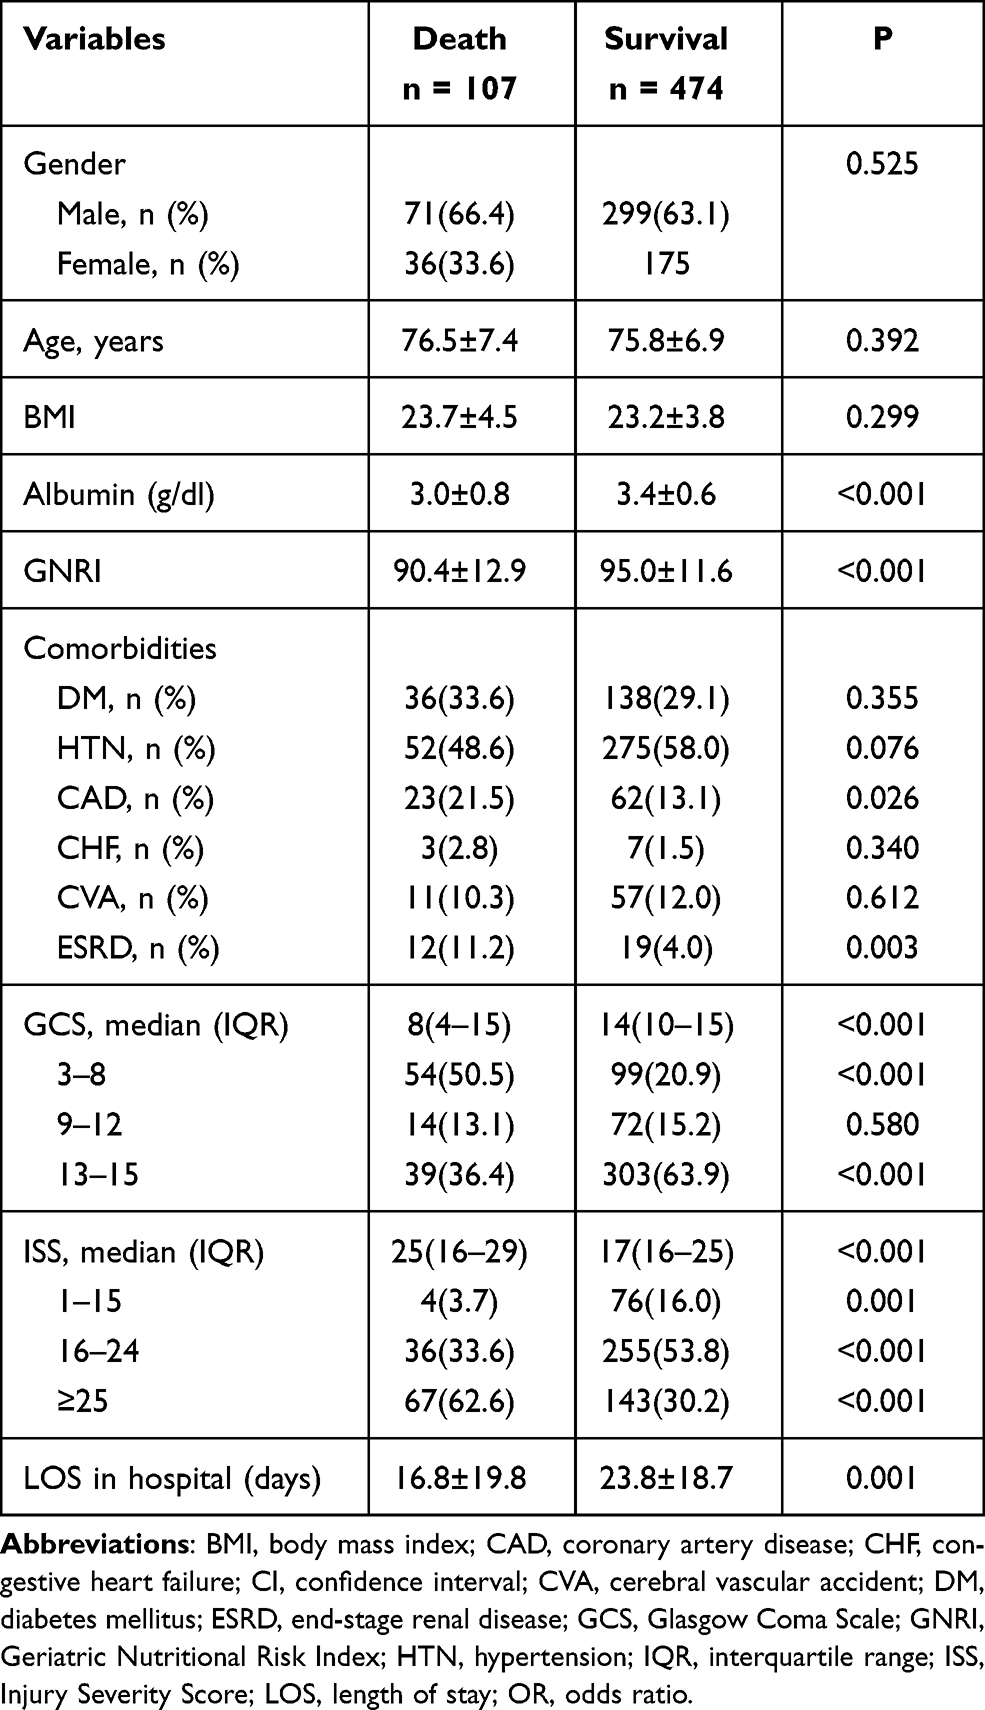 |
Table 1 Patient and Injury Characteristics of the Death and Survival Elderly Patients with Moderate to Severe TBI |
Analysis of the Risk Factors for Mortality
As shown in Table 2, the univariate analysis revealed that GNRI, CAD, ESRD, and ISS were significant risk factors for mortality in elderly patients with moderate to severe TBI. Subsequent multivariate logistic regression analysis revealed that GNRI (OR, 0.97; 95% CI, 0.95–0.99; p = 0.001), ESRD (OR, 3.5; 95% CI, 1.57–7.97; p = 0.002), and ISS (OR, 1.1; 95% CI, 1.05–1.11; p < 0.001) were significant independent risk factors for mortality in these patients. Pre-existing CAD was not further recognized as a significant independent risk factor (OR, 1.7; 95% CI, 0.99–3.10; p = 0.056) for mortality in these patients.
 |
Table 2 Univariate and Multivariate Analysis to Identify Risk Factors for Mortality in Elderly Patients with Moderate to Severe TBIs |
Comparison of Patients with Low and High GNRI
These 581 patients could be divided into two groups: low GNRI (H1, n = 290) and high GNRI (H2, n = 291) according to the median value of 93.8 of the study population. As shown in Table 3, the patients with low GNRI were significantly younger (76.8 ± 7.2 vs 75.1 ± 6.6, respectively; p = 0.005), with a low BMI (21.1 ± 3.0 vs 25.4 ± 3.6, respectively; p < 0.001) and albumin level (2.9 ± 0.6 vs 3.7 ± 0.6, respectively; p < 0.001) than the patients with high GNRI. There was no significant difference in gender predominance, preexisting comorbidities except HTN, and ISS between the patients with low and high GNRI. Patients with low GNRI had a significantly lower GCS than patients with high GNRI (median [IQR]: 137–15 vs 15,9–15 respectively; p = 0.008). When stratified by GCS (3–8, 9–12, or 13–15), there were significantly more patients with scores of 3–8 but fewer patients with scores of 13–15 in the low GNRI group than in high GNRI group. The LOS in hospital was significantly longer (24.5 days vs 20.5 days; p = 0.012) in patients with low GNRI than in those with high GNRI. However, there was no significant difference in the mortality rate between the patients with low and high GNRI (21.4% vs 15.5%, respectively; p = 0.066).
 |
Table 3 Comparison of Patient Characteristics and Outcomes Between the Elderly TBI Patients with Low (H1) and High GNRI (H2) |
Comparison of Patients with Q1 and Q4 GNRI
According to the quartile deviation, the study population could be divided into four nutritional risk categories: Q1 (GNRI <85, n = 145), Q2 (GNRI 85 to <93.8 n = 145), Q3 (GNRI 93.8 to 103, n = 145), and Q4 (GNRI >103, n = 146) (Figure 1). From a nutritional point of view, these four groups of patients may present a very high risk (Q1), high risk (Q2), low risk (Q3), and very low risk (Q4) for malnutrition. There were no significant difference of mortality of patients with high risk (Q2) or low risk (Q3) than those patients with very low risk (Q4) (p = 0.07 and 0.50, respectively). In contrast, comparison of patients with very high nutritional risk in Q1 with patients with very low nutritional risk in Q4 (Table 4) revealed that Q1 patients had a significantly longer hospital LOS (25.2 days vs 18.6 days, respectively; p = 0.004) and higher mortality rate (28.3% vs 11.7%, respectively; p < 0.001) than Q4 patients. The Q1 patients were significantly older (77.1 ± 7.3 vs 74.6 ± 6.7, respectively; p = 0.003), with a low BMI (20.1 ± 2.7 vs 26.6 ± 3.7, respectively; p < 0.001) and albumin level (2.7 ± 0.5 vs 3.9 ± 0.4, respectively; p < 0.001) than the Q4 patients. There was no significant difference in gender predominance and preexisting comorbidities, except HTN, between Q1 and Q4 patients. Q1 patients had a significantly lower GCS (median [IQR]: 137–15 vs 15,11–15 respectively; p = 0.004) and higher ISS (median [IQR]: 2116–25 vs 16,16–25 respectively; p = 0.006) than Q4 patients. In the selected 83 pairs of propensity score-matched patient populations, who did not present with significant differences in sex, age, comorbidity, and ISS (Table 5), Q1 patients still presented a significantly higher mortality rate than Q4 patients (OR, 2.8; 95% CI, 1.14–6.78; p = 0.021).
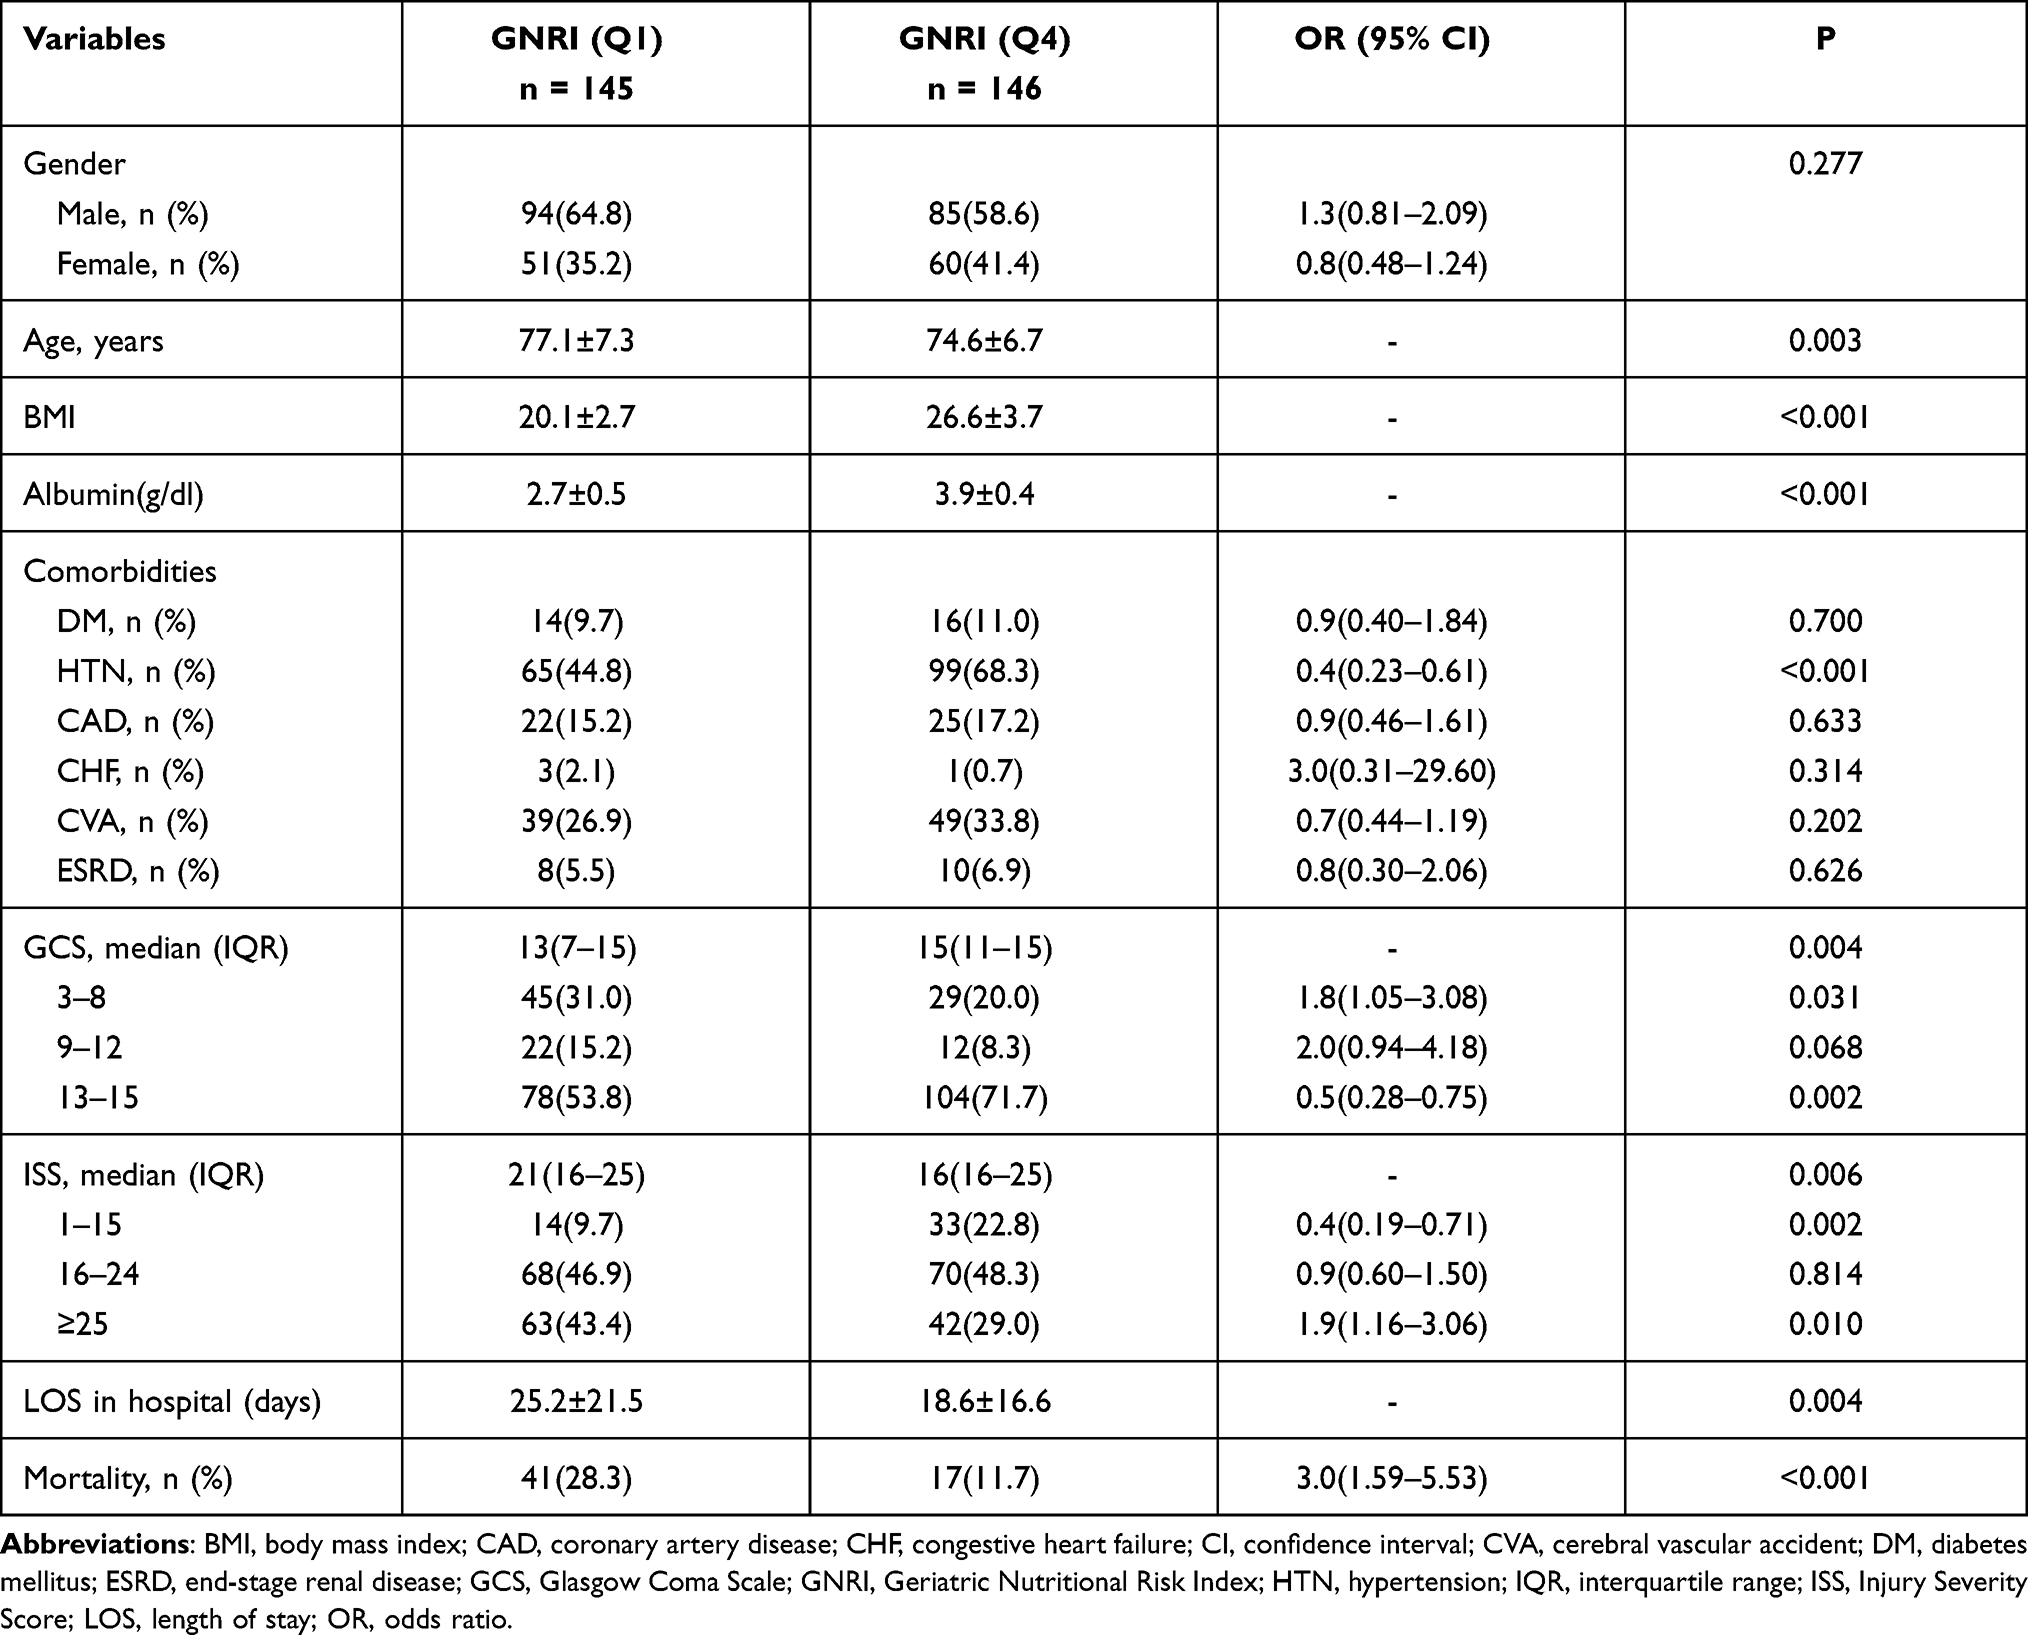 |
Table 4 Comparison of Patient Characteristics and Outcomes Between the Elderly TBI Patients with Very High-Risk GNRI (Q1) and Very Low-Risk GNRI (Q4) |
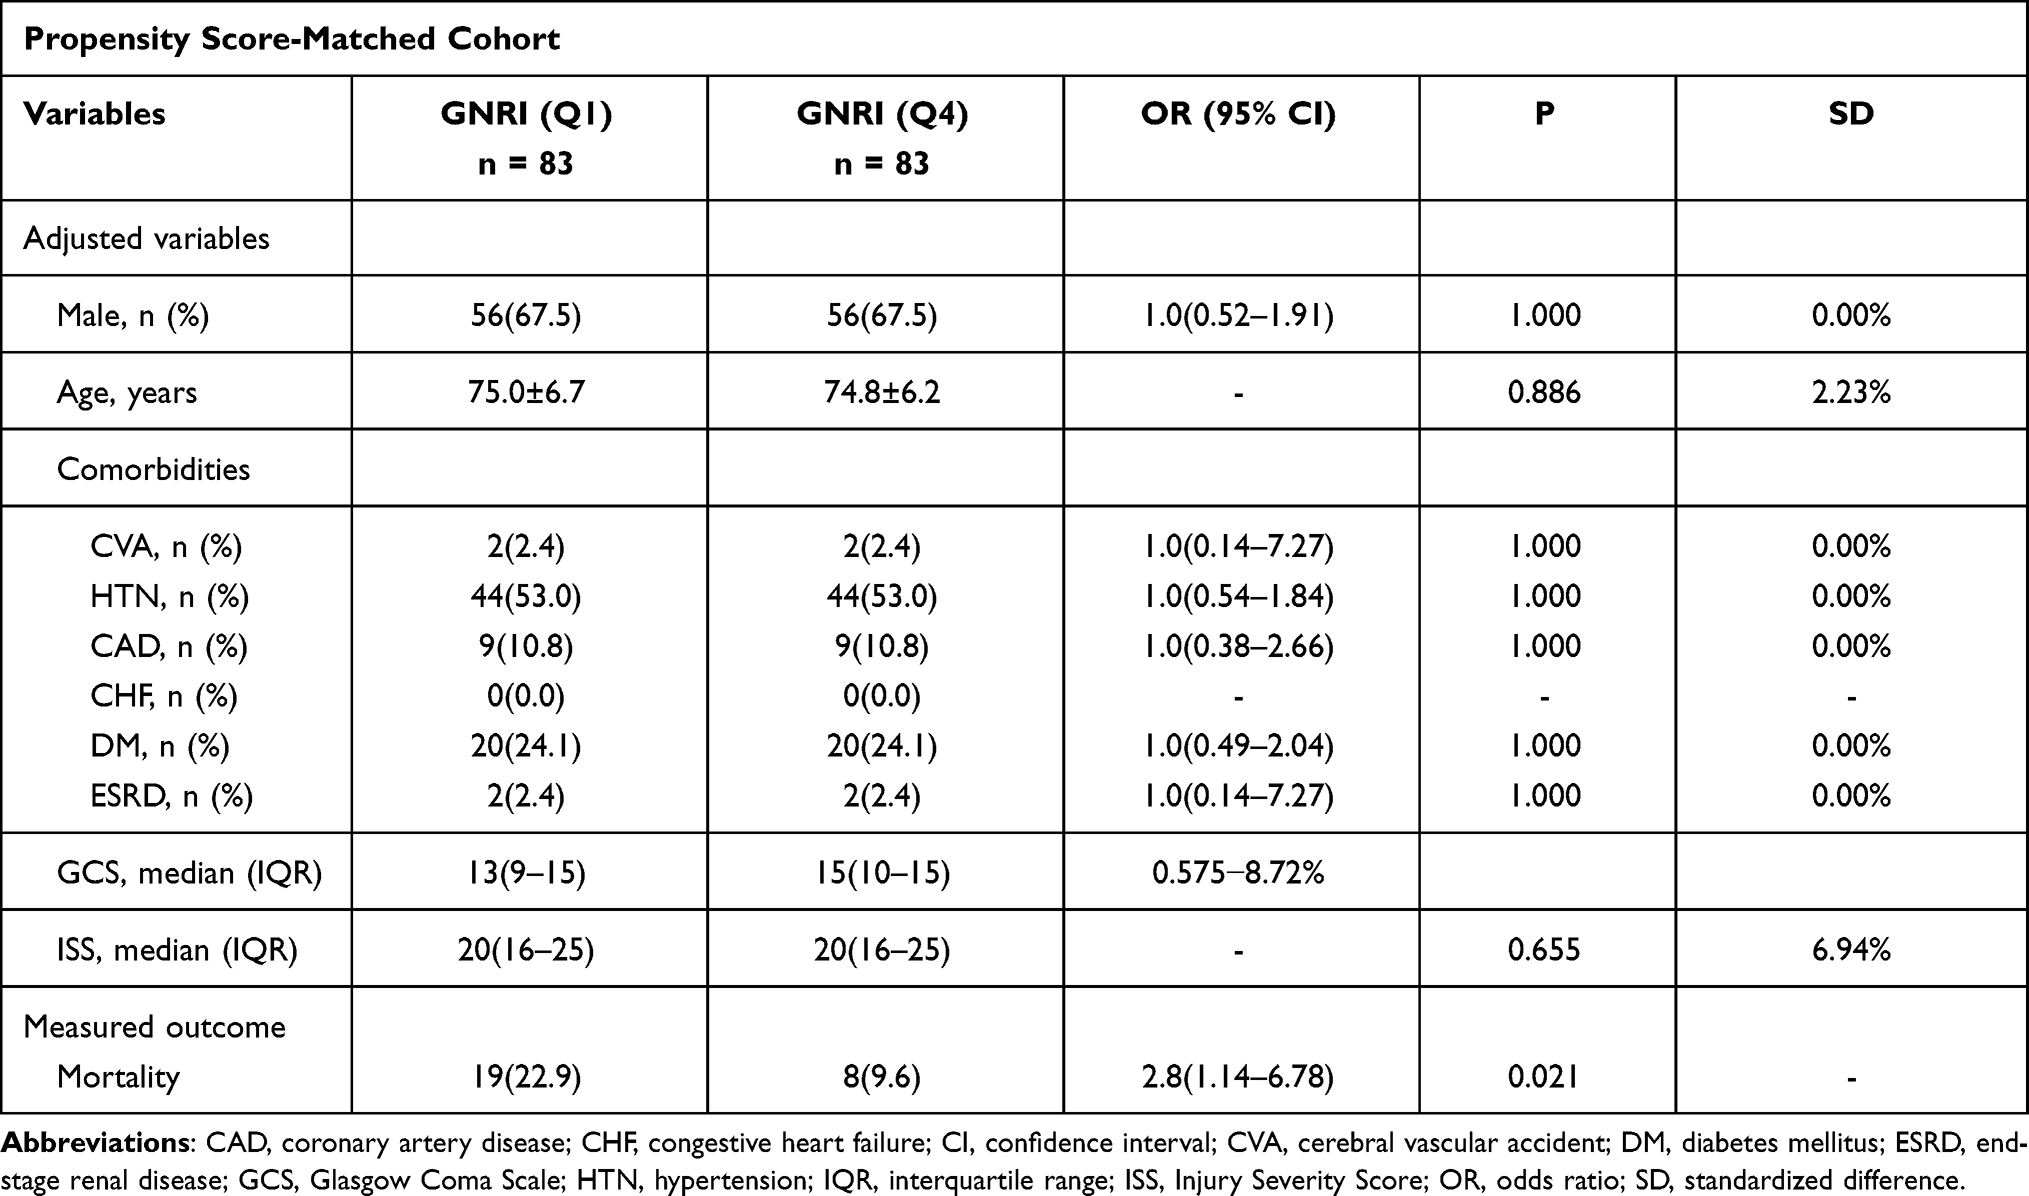 |
Table 5 Mortality Outcome in the Propensity Score-Matched Cohorts of the Elderly TBI Patients with Very High-Risk GNRI (Q1) and Very Low-Risk GNRI (Q4) |
Discussion
In this study, multivariate logistic regression analysis identified GNRI as a significant independent risk factor for mortality in elderly patients with moderate to severe TBI. Seeing that the odds of risk for mortality is only minor with GNRI (OR 0.97; 95% CI, 0.95–0.99), although the mortality rate was not significantly different between patients with low and high GNRI, the very high-risk (Q1) patients had a significantly longer LOS and a higher mortality rate than the very low-risk (Q4) patients. In this study, Q1 patients had a significantly lower GCS and higher ISS than Q4 patients, indicating the injury severity of Q1 patients upon arrival to the emergency was higher than those Q4 patients. Therefore, a propensity score-matched cohorts adjusting by these baseline characteristic differences was used to assess the mortality outcome. The results revealed that the Q1 patients still presented a significantly higher mortality rate than Q4 patients.
It has been highlighted that there are now over 70 tests or tools for nutritional assessment, 21 of which are designated for use in an older population.42 However, currently, no sufficiently sensitive and specific tool can be considered the gold standard for nutritional assessment.43 A strong correlation has been validated for GNRI and other nutritional scoring methods,44,45 including the circumference of the mid-upper arm muscle, arm muscle area, and handgrip strength of hospitalized patients46 as well as the preoperative sarcopenia status of cancer patients.47 In a 3-year observational study, GNRI showed a higher prognostic value for mortality than albumin alone.48 This is because the serum albumin level can be modified by hydration status, the inflammatory process, and during the impairment of hepatic or renal functions.45 Obviously, GNRI is a simple and objective tool for clinicians to screen patients readily based only on height, weight, and serum albumin levels. Its advantages would be more prominent than some questionnaires, such as subjective global assessment (SGA)49 or Mini Nutritional Assessment (MNA),50 which would be difficult to complete for elderly patients who had difficulties in communicating such as those with conscious disturbance or those who had been intubated.
Considering that death is a terminal condition that might be a consequence of nutrition-related complications,51,52 it is not surprising to find that, even when encountered with the acute injury such as TBI, GNRI still presents a significant independent risk factor for mortality in these patients. It has been reported that the association of GNRI with overall complications is good, although that with death is even stronger.53,54 Although the best cutoff value of GNRI might not be unique for patients with different illnesses, there is a trend that the value is lower and the risk is greater. With respect to GNRI cutoff value, Bouillanne et al determined four GNRI cutoff values (GNRI <82, GNRI 82 to <92, GNRI 92–98, and GNRI >98) to indicate the risk of malnutrition.21 However, the GNRI cutoff was slightly different among previous studies.55–57 For elderly patients with sepsis, the optimal cutoff for the indicators of nutritional support was GNRI <87 in the acute care setting.36 Following pancreaticoduodenectomy, a GNRI <94 was independently associated with surgical site infection (relative risk 1.73, 95% CI 1.23-–2.43; P < 0.001).58 In hemodialysis patients, the multivariate Cox proportional hazards analysis showed that a GNRI <100 was a significant predictor of mortality (hazard ratio 3.691, 95% CI 1.75–7.78; P = 0.001). The study results demonstrated that GNRI might be helpful for us to early recognize those with malnutrition risk for mortality in the elderly patients with moderate to severe TBI.
This study has some limitations, which include the following. First, owing to the retrospective design of this study, some selection bias may be present. Second, interventions such as resuscitation, damage control, and surgery could lead to a different outcome; however, we can only assume that the outcome of treatments was uniform across the studied population. Third, the patients declared dead on arrival at the emergency department were not recorded in the registered database and only in-hospital mortality, but not mortality at a longer day, was evaluated, which may have led to a selection bias in the outcome measurement. Fourth, some patients with incomplete data were excluded from the study. Considering most of the loss data is the albumin level and those patients without the check of albumin level were prone to be less severely injured patients; thus, the mortality rate calculated in each group of patients may be higher than the real data. This situation may result in some bias in the outcome measurement. Further, the population differences in this study may lead to a selection bias. Finally, the population included in this study was limited to that from a single urban trauma center; thus, these results may not apply to other regions. This study revealed that GNRI is a significant independent risk factor and a promising simple screening tool for nutritional status of elderly patients with moderate to severe TBI.
Acknowledgments
We would appreciate the statistical analyses assisted by Biostatistics Center, Kaohsiung Chang Gung Memorial Hospital.
Funding
This research was supported by a grant from Chang Gung Memorial Hospital (CMRPG8K1611).
Disclosure
The authors declare that they have no competing interests.
References
1. Fu TS, Jing R, McFaull SR. Cusimano recent trends in hospitalization and in-hospital mortality associated with traumatic brain injury in Canada: a nationwide, population-based study. J Trauma Acute Care Surg. 2015;79:449–454.
2. Teasdale G, Jennett B. Assessment of coma and impaired consciousness. A practical scale. Lancet. 1974;2:81–84.
3. Singh B, Murad MH, Prokop LJ, et al. Meta-analysis of Glasgow coma scale and simplified motor score in predicting traumatic brain injury outcomes. Brain Inj. 2013;27:293–300. doi:10.3109/02699052.2012.743182
4. Salottolo K, Levy AS, Slone DS, Mains CW, Bar-Or D. The effect of age on Glasgow Coma Scale score in patients with traumatic brain injury. JAMA Surg. 2014;149:727–734. doi:10.1001/jamasurg.2014.13
5. Moore L, Lavoie A, Camden S, et al. Statistical validation of the Glasgow Coma Score. J Trauma. 2006;60:
6. McNett M. A review of the predictive ability of Glasgow Coma Scale scores in head-injured patients. J Neurosci Nurs. 2007;39:68–75.
7. Teasdale G, Murray G, Parker L, Jennett B. Adding up the Glasgow Coma Score. Acta Neurochir Suppl (Wien). 1979;28:13–16.
8. Rating the severity of tissue damage. I. The abbreviated scale. JAMA. 1971;215:277–280.
9. Savitsky B, Givon A, Rozenfeld M, Radomislensky I, Peleg K. Traumatic brain injury: it is all about definition. Brain Inj. 2016;30:1194–1200. doi:10.1080/02699052.2016.1187290
10. Rau CS, Kuo PJ, Wu SC, Chen YC, Hsieh HY, Hsieh CH. Association between the osteoporosis self-assessment tool for asians score and mortality in patients with isolated moderate and severe traumatic brain injury: a propensity score-matched analysis. Int J Environ Res Public Health. 2016;13. doi:10.3390/ijerph13121203.
11. Rau CS, Wu SC, Kuo PJ, et al. Same abbreviated injury scale values may be associated with different risks to mortality in trauma patients: a cross-sectional retrospective study based on the trauma registry system in a Level I Trauma Center. Int J Environ Res Public Health. 2017;14. doi:10.3390/ijerph14121552.
12. Baker SP, O’Neill B, Haddon W
13. Kuo SCH, Kuo PJ, Chen YC, Chien PC, Hsieh HY, Hsieh CH. Comparison of the new exponential injury severity score with the injury severity score and the new injury severity score in trauma patients: a cross-sectional study. PLoS One. 2017;12:e0187871. doi:10.1371/journal.pone.0187871
14. Cereda E, Pedrolli C. The geriatric nutritional risk index. Curr Opin Clin Nutr Metab Care. 2009;12:1–7. doi:10.1097/MCO.0b013e3283186f59
15. Barker LA, Gout BS, Crowe TC. Hospital malnutrition: prevalence, identification and impact on patients and the healthcare system. Int J Environ Res Public Health. 2011;8:514–527. doi:10.3390/ijerph8020514
16. Gavazzi G, Krause KH. Ageing and infection. Lancet Infect Dis. 2002;2:659–666. doi:10.1016/s1473-3099(02)00437-1
17. Kuzu MA, Terzioğlu H, Genç V, et al. Preoperative nutritional risk assessment in predicting postoperative outcome in patients undergoing major surgery. World J Surg. 2006;30:378–390. doi:10.1007/s00268-005-0163-1
18. Schaible UE, Kaufmann SH. Malnutrition and infection: complex mechanisms and global impacts. PLoS Med. 2007;4:e115. doi:10.1371/journal.pmed.0040115
19. Buzby GP, Knox LS, Crosby LO, et al. Study protocol: a randomized clinical trial of total parenteral nutrition in malnourished surgical patients. Am J Clin Nutr. 1988;47:366–381. doi:10.1093/ajcn/47.2.366
20. Kuczmarski MF, Kuczmarski RJ, Najjar M. Effects of age on validity of self-reported height, weight, and body mass index: findings from the Third National Health and Nutrition Examination Survey, 1988-1994. J Am Diet Assoc. 2001;101:
21. Bouillanne O, Morineau G, Dupont C, et al. Geriatric Nutritional Risk Index: a new index for evaluating at-risk elderly medical patients. Am J Clin Nutr. 2005;82:777–783. doi:10.1093/ajcn/82.4.777
22. Abd-El-Gawad WM, Abou-Hashem RM, El Maraghy MO, Amin GE. The validity of Geriatric Nutrition Risk Index: simple tool for prediction of nutritional-related complication of hospitalized elderly patients. Comparison with Mini Nutritional Assessment. Clin Nutr. 2014;33:1108–1116. doi:10.1016/j.clnu.2013.12.005
23. Cereda E, Pedrolli C, Zagami A, et al. Nutritional risk, functional status and mortality in newly institutionalised elderly. Br J Nutr. 2013;110:1903–1909. doi:10.1017/s0007114513001062
24. Lidoriki I, Schizas D, Frountzas M, et al. GNRI as a prognostic factor for outcomes in cancer patients: a systematic review of the literature. Nutr Cancer. 2020;1–13. doi:10.1080/01635581.2020.1756350
25. Lv GY, An L, Sun DW. Geriatric nutritional risk index predicts adverse outcomes in human malignancy: a meta-analysis. Dis Markers. 2019;2019:4796598. doi:10.1155/2019/4796598
26. Kushiyama S, Sakurai K, Kubo N, et al. The preoperative geriatric nutritional risk index predicts postoperative complications in elderly patients with gastric cancer undergoing gastrectomy. Vivo. 2018;32:1667–1672. doi:10.21873/invivo.11430
27. Lee K, Ahn JM, Kang DY, et al. Nutritional status and risk of all-cause mortality in patients undergoing transcatheter aortic valve replacement assessment using the geriatric nutritional risk index and the controlling nutritional status score. Clin Res Cardiol. 2020;109:161–171. doi:10.1007/s00392-019-01497-9
28. Mii S, Guntani A, Kawakubo E, Shimazoe H, Ishida M. Impact of the Geriatric Nutritional Risk Index on the Long-Term Outcomes of Patients Undergoing Open Bypass for Intermittent Claudication. Circulation j. 2019;83:1349–1355. doi:10.1253/circj.CJ-19-0005
29. Shibata K, Yamamoto M, Kano S, et al. Importance of Geriatric Nutritional Risk Index assessment in patients undergoing transcatheter aortic valve replacement. Am Heart J. 2018;202:68–75. doi:10.1016/j.ahj.2018.04.021
30. Kubo N, Sakurai K, Tamura T, et al. The impact of geriatric nutritional risk index on surgical outcomes after esophagectomy in patients with esophageal cancer. Esophagus. 2019;16:147–154. doi:10.1007/s10388-018-0644-6
31. Kuo IC, Huang JC, Wu PY, Chen SC, Chang JM, Chen HC. A low geriatric nutrition risk index is associated with progression to dialysis in patients with chronic kidney disease. Nutrients. 2017;9. doi:10.3390/nu9111228.
32. Nishi I, Seo Y, Hamada-Harimura Y, et al. Geriatric nutritional risk index predicts all-cause deaths in heart failure with preserved ejection fraction. ESC Heart Failure. 2019;6:396–405. doi:10.1002/ehf2.12405
33. Matsumura T, Mitani Y, Oki Y, et al. Comparison of Geriatric Nutritional Risk Index scores on physical performance among elderly patients with chronic obstructive pulmonary disease. Heart Lung. 2015;44:534–538. doi:10.1016/j.hrtlng.2015.08.004
34. Xiong J, Wang M, Zhang Y, et al. Association of geriatric nutritional risk index with mortality in hemodialysis patients: a meta-analysis of cohort studies. Kidney Blood Press Res. 2018;43:1878–1889. doi:10.1159/000495999
35. Cereda E, Limonta D, Pusani C, Vanotti A. Geriatric nutritional risk index: a possible indicator of short-term mortality in acutely hospitalized older people. J Am Geriatr Soc. 2006;54:1011–1012. doi:10.1111/j.1532-5415.2006.00754.x
36. Lee JS, Choi HS, Ko YG, Yun DH. Performance of the Geriatric Nutritional Risk Index in predicting 28-day hospital mortality in older adult patients with sepsis. Clin Nutr. 2013;32:843–848. doi:10.1016/j.clnu.2013.01.007
37. Hsieh CH, Hsu SY, Hsieh HY, Chen YC. Differences between the sexes in motorcycle-related injuries and fatalities at a Taiwanese level I trauma center. Biomed J. 2017;40:113–120. doi:10.1016/j.bj.2016.10.005
38. Hsieh CH, Liu HT, Hsu SY, Hsieh HY, Chen YC. Motorcycle-related hospitalizations of the elderly. Biomed J. 2017;40:121–128. doi:10.1016/j.bj.2016.10.006
39. Hsieh CH, Chen YC, Hsu SY, Hsieh HY, Chien PC. Defining polytrauma by abbreviated injury scale >/= 3 for a least two body regions is insufficient in terms of short-term outcome: a cross-sectional study at a level I trauma center. Biomed J. 2018;41:321–327. doi:10.1016/j.bj.2018.08.007
40. Aharonson-Daniel L, Giveon A, Stein M, Israel Trauma G, Peleg K. Different AIS triplets: different mortality predictions in identical ISS and NISS. J Trauma. 2006;61:711–717. doi:10.1097/01.ta.0000235294.32326.e6
41. Dong XR. [Analysis of patients of multiple injuries with AIS-ISS and its clinical significance in the evaluation of the emergency managements]. Zhonghua Wai Ke Za Zhi. 1993;31:301–302.
42. Green SM, Watson R. Nutritional screening and assessment tools for older adults: literature review. J Adv Nurs. 2006;54:477–490. doi:10.1111/j.1365-2648.2006.03841.x
43. van Bokhorst-de van der Schueren MA, Guaitoli PR, Jansma EP, de Vet HC. Nutrition screening tools: does one size fit all? A systematic review of screening tools for the hospital setting. Clin Nutri. 2014;33:39–58. doi:10.1016/j.clnu.2013.04.008
44. Cereda E, Pusani C, Limonta D, Vanotti A. The ability of the Geriatric Nutritional Risk Index to assess the nutritional status and predict the outcome of home-care resident elderly: a comparison with the Mini Nutritional Assessment. Br J Nutr. 2009;102:563–570. doi:10.1017/s0007114509222677
45. Durán Alert P, Milà Villarroel R, Formiga F, Virgili Casas N, Vilarasau Farré C. Assessing risk screening methods of malnutrition in geriatric patients: mini Nutritional Assessment (MNA) versus Geriatric Nutritional Risk Index (GNRI). Nutr Hosp. 2012;27:590–598. doi:10.1590/s0212-16112012000200036
46. Cereda E, Vanotti A. The new Geriatric Nutritional Risk Index is a good predictor of muscle dysfunction in institutionalized older patients. Clin Nutr. 2007;26:78–83. doi:10.1016/j.clnu.2006.09.007
47. Han JY, Lee KH, Kim SW, et al. A Phase II study of poziotinib in patients with Epidermal Growth Factor Receptor (EGFR)-mutant lung adenocarcinoma who have acquired resistance to EGFR-tyrosine kinase inhibitors. Cancer Res Treatment. 2017;49:10–19. doi:10.4143/crt.2016.058
48. Cereda E, Zagami A, Vanotti A, Piffer S, Pedrolli C. Geriatric Nutritional Risk Index and overall-cause mortality prediction in institutionalised elderly: a 3-year survival analysis. Clin Nutr. 2008;27:717–723. doi:10.1016/j.clnu.2008.07.005
49. Mendes NP, Barros TA, Rosa COB, Franceschini S. Nutritional screening tools used and validated for cancer patients: a systematic review. Nutr Cancer. 2019;71:898–907. doi:10.1080/01635581.2019.1595045
50. Torbahn G, Strauss T, Sieber CC, Kiesswetter E, Volkert D. Nutritional status according to the mini nutritional assessment (MNA)® as potential prognostic factor for health and treatment outcomes in patients with cancer - a systematic review. BMC Cancer. 2020;20:594. doi:10.1186/s12885-020-07052-4
51. Artinyan A, Orcutt ST, Anaya DA, Richardson P, Chen GJ, Berger DH. Infectious postoperative complications decrease long-term survival in patients undergoing curative surgery for colorectal cancer: a study of 12,075 patients. Ann Surg. 2015;261:497–505. doi:10.1097/sla.0000000000000854
52. Nathan H, Yin H, Wong SL. Postoperative complications and long-term survival after complex cancer resection. Ann Surg Oncol. 2017;24:638–644. doi:10.1245/s10434-016-5569-5
53. Cereda E, Pusani C, Limonta D, Vanotti A. The association of Geriatric Nutritional Risk Index and total lymphocyte count with short-term nutrition-related complications in institutionalised elderly. J Am Coll Nutr. 2008;27:406–413. doi:10.1080/07315724.2008.10719718
54. Cereda E, Limonta D, Pusani C, Vanotti A. Assessing elderly at risk of malnutrition: the new Geriatric Nutritional Risk Index versus Nutritional Risk Index. Nutrition. 2006;22:680–682. doi:10.1016/j.nut.2006.02.003
55. Takahashi H, Ito Y, Ishii H, et al. Geriatric nutritional risk index accurately predicts cardiovascular mortality in incident hemodialysis patients. J Cardiol. 2014;64:32–36. doi:10.1016/j.jjcc.2013.10.018
56. Beberashvili I, Azar A, Sinuani I, et al. Comparison analysis of nutritional scores for serial monitoring of nutritional status in hemodialysis patients. Clin J Am Soc Nephrol. 2013;8:443–451. doi:10.2215/cjn.04980512
57. Zhang Y, Zhang Z, Yu Q, Yuan W. [Value of the Geriatric Nutritional Risk Index in predicting mortality of elderly patients undergoing hemodialysis]. Zhonghua Yi Xue Za Zhi. 2015;95:3741–3745.
58. Funamizu N, Nakabayashi Y, Iida T, Kurihara K. Geriatric nutritional risk index predicts surgical site infection after pancreaticoduodenectomy. Mol Clin Oncol. 2018;9:274–278. doi:10.3892/mco.2018.1671
 © 2021 The Author(s). This work is published and licensed by Dove Medical Press Limited. The
full terms of this license are available at https://www.dovepress.com/terms
and incorporate the Creative Commons Attribution
- Non Commercial (unported, 3.0) License.
By accessing the work you hereby accept the Terms. Non-commercial uses of the work are permitted
without any further permission from Dove Medical Press Limited, provided the work is properly
attributed. For permission for commercial use of this work, please see paragraphs 4.2 and 5 of our Terms.
© 2021 The Author(s). This work is published and licensed by Dove Medical Press Limited. The
full terms of this license are available at https://www.dovepress.com/terms
and incorporate the Creative Commons Attribution
- Non Commercial (unported, 3.0) License.
By accessing the work you hereby accept the Terms. Non-commercial uses of the work are permitted
without any further permission from Dove Medical Press Limited, provided the work is properly
attributed. For permission for commercial use of this work, please see paragraphs 4.2 and 5 of our Terms.