Back to Journals » Research and Reports in Tropical Medicine » Volume 11
Geographic Accessibility, Readiness, and Barriers of Health Facilities to Offer Tuberculosis Services in East Gojjam Zone, Ethiopia: A Convergent Parallel Design
Authors Asemahagn MA ![]() , Alene GD, Yimer SA
, Alene GD, Yimer SA
Received 1 October 2019
Accepted for publication 10 January 2020
Published 4 February 2020 Volume 2020:11 Pages 3—16
DOI https://doi.org/10.2147/RRTM.S233052
Checked for plagiarism Yes
Review by Single anonymous peer review
Peer reviewer comments 2
Editor who approved publication: Dr Mario Rodríguez-Pérez
Mulusew Andualem Asemahagn,1 Getu Degu Alene,1 Solomon Abebe Yimer2,3
1School of Public Health, College of Medicine and Health Sciences, Bahir Dar University, Bahir Dar, Ethiopia; 2Department of Microbiology, Unit for Genome Dynamics, Faculty of Medicine, University of Oslo, Oslo, Norway; 3Coalition for Epidemic Preparedness Innovations (CEPI), Oslo, Norway
Correspondence: Mulusew Andualem Asemahagn Email [email protected]
Background: Tuberculosis (TB) remains a foremost global public health threat. Active TB control needs geographically accessible health facilities that have quality diagnostics, equipment, supplies, medicines, and staff.
Objective: This study aimed at assessing the geographic distribution, physical accessibility, readiness and barriers of health facilities for TB services in East Gojjam zone, Ethiopia.
Methods: A convergent parallel design was applied using health facility and geographic data. Data on facility attributes, service availability and readiness were collected by inteviewing TB officers, laboratory heads and onsite facility visits. Coordinates of health facilities and kebele centroids were collected by GPS. We used ArcGIS 10.6 to measure Euclidean distance from each kebele centroids to the nearest health facility. Descriptive statistics were computed by using SPSS version 25. Barriers to TB service readiness were explored by in-depth interviews. NVivo12 was used to thematically analyze the qualitative data.
Results: The overall TB health service coverage (THSC) was 23% (ranging: 10– 85%). The mean distance from the nearest health facility was 8km (ranging: 0.5– 16km). About 132 (32%) kebeles had poor geographic accessibility to TB services (over 10km distance from the nearest health facility) and had poor facility readiness. Although 114 (95%) health facilities offered at least one TB service, 44 (38.6%) of them had no sputum smear microscopy. The overall TB readiness index was 63.5%: first-line anti-TB drugs (97%), diagnostics (63%), trained staffs, diagnostic and treatment guidelines (53%) and laboratory supplies (41%). Lack of health workers (laboratory personnel), inadequate budget, poor management practice and TB program support, inadequate TB commodity suppliers, and less accessible geographic locations of health facilities were identified as barriers to TB service readiness distribution.
Conclusion: Considerable proportion of the population in the study area have poor access to quality TB diagnostic services due to low THSC and poor facility readiness. Barriers to TB service availability and readiness were health system related. Regular refresher training of health workers on TB, creating mechanisms to attract laboratory personnel to work in the study area and scaling up of sputum smear microscopy services, establishing an efficient mechanism for procurement, distribution, utilization and reporting of TB commodity supplies, and good management practices are crucial to enhance TB service readiness in the study zone.
Keywords: tuberculosis, accessibility, readiness, barriers, health facilities, TB services, East Gojjam Zone, Ethiopia
Background
Tuberculosis is the tenth cause of death globally and the first cause of death from a single infectious agent. Although about 10 million new TB cases were reported in 2017, over a third of estimated TB cases are not yet detected globally.1 Developing countries are highly affected by TB incidence, and deaths which might be related to high population growth, poor economy and nutrition,2,3 low healthcare coverage and service quality4–8 drug resistance and high comorbidities with HIV and diabetes mellitus.1,9–12
Similarly, TB is one of the top leading diseases claiming millions of lives in Ethiopia with varying magnitude across its regions.13 Based on a recent data, the TB incidence in Ethiopia is estimated at 80 -172/100,000 population,1,14,15.About 60,000 TB cases are not yet detected in the country,15,16 and the national TB case notificateion rate and treatment success rate were reported to be 56% and 84%, respectively.17,18 The low TB case notification rate may be linked to use of poor TB incidence estimation methods,16,19 relying only on passive case detection approach to identify TB cases,8,20,21 lack of adequate TB dignostic tools, 8,20,22 poor service availability and readiness,8,21,23 high patient and facility delay,24–26 and poor community awareness about TB .14,18,27,28
The burdens of TB could be preventable under effective preventive strategies, early diagnosis and appropriate treatment.18 However, this could be possible if health facilities are easily accessible and ready to offer TB services.5–8,29 Ensuring access and quality of healthcare services is one of the main functions of a health system, but most of the developing countries failed to achieve this due to continuing poverty,1–3,29,30 poor facility readiness,5–8 and not using advanced diagnostic technologies in the health systems.1,7,8,31 Studies from Ghana,4,7 South Africa,32 Nigeria,33 Yemen,34 Mongolia35 and Mozambique5 showed that majority of the health facilities were geographically inaccessible, and had no TB diagnostics.
Correspondingly, the 2017 world bank and WHO report revealed that half of the world’s population lacks access to essential health services and over 100 million were pushed into extreme poverty due to high health expenses.36 As a result, the WHO recommends Universal Health Coverage as a key strategy to achieve the End TB goals.1 Equally, making health facilities capable of offering quality TB services is vital beyond ensuring physical accessibility.
The Ethiopian healthcare delivery system has three tiers consisting of primary healthcare level (primary hospital, health center, and health posts), secondary level healthcare (general hospitals), and tertiary level (spatialized hospitals).37 A 10km distance or two hours walk to a health facility from residential locations is used to measure the physical access to health facilities. Equally, geographic distribution in terms of health service coverage is measured by taking functional health facilities to total population ratio in a given year.38 There is limited evidence from Ethiopia on the geographic distribution of and physical accessibility to the health facilities that offer TB services. This has an impact on decision making for equity, resource allocation, priority setting and targeted intervention in TB control activity. This is a key problem that has contributed more to have a high TB burden in Ethiopia with different magnitudes across its districts.
One of the high TB burden regions in Ethiopia is Amhara Regional State, which is administratively divided into eleven zones (middle-level administration). The East Gojjam Administrtaive Zone is one of those zones which has higher TB incidence and lowest TB case notification rate compared to other administrative zones in the region.39 Therefore, this study aimed at assessing the geographic distribution, physical accessibility, readiness and barriers of health facilities to offer TB control services in East Gojjam Administrative Zone, Northwest Ethiopia. The findings of this study are crucial to policy makers, health system managers, health facilities, and non governmental organizations (NGOs) to enhance universal health coverage, facility readiness and achieve the End TB targets. It will also serve as an important evidence for researchers who are interested in health equity, facility readiness, and TB service quality.
Methods
Study Design and Settings
A convergent parallel design/concurrent triangulation study/was conducted between September and December 2018 in East Gojjam Zone, one of the ten zones in the Amhara Region, Ethiopia. The quantitative approach aimed at assessing geographic distribution, accessibility, service availability and readiness of health facilities to offer TB services, whereas, the qualitative approach was used to explore barriers of facility readiness to offer TB service. The study zone has an estimated population of 2,632,632 (1,282,676 males, 1,349,956 females, and 85% rural farmers). Its area coverage is 14,010 square km which is divided into 18 administrative districts which are further divided into 49 urban and 392 rural kebeles,40 the lowest administrative units.18 There were nine hospitals, 102 HCs and nine private clinics eligible to offer TB services. Although the lives of many TB patients have been saved as a result of the implementation of effective TB control strategies since 1995, TB still continues to be a major public health problem in East Gojjam Zone. The zone has poor performance in TB case notification rates compared to other zones in the Amhara Region.40,41
Sample Size Determination
Due to the nature of the study objectives, and recommendations by the WHO on service availability and readiness assessment, a census of 120 health facilities was applied.42 For the quantitative data collection, we included laboratory heads and TB officers/TB focal persons/ working at Zonal Health Department, District Health Offices and health facility levels. The main reason for the selection of these participants was their day to day exposure in the TB control activities. In the study area, there are 18 District Health Offices where the TB officers (one per office) are responsible for managing the TB control activities. Similarly, there were 120 TB focal persons (one per health facility) and 70 laboratory heads. The number of laboratory heads were limited to 70 as only 70 of 120 health facilities had TB smear microscopy services. Two TB offficers (one assigned by the government and the other one representing one NGO) were working at the Zonal Health Department level to facilitate the overall TB control activities in the study zone. Therefore, by considering all these informants, a toal of 200 participants were included in the quantitative study data collection. For the qualitative data, besides the above participants, we included health facility heads as study participants to assess their management roles in TB control activities. A total of 24 participants were recruited for the qualitative data collection and data saturation level was used to limit the number of participants.
Data Collection Tools and Procedures
Quantitative Data Collection
Data on facility attributes (facility type, managing authority, residence and district), service availability, readiness (availability of trained staff, dignostic and treatment guidelines, diagnostics, anti-TB drugs and laboratory supplies)42 were collected by interviewing TB officers and laboratory heads using a structured interviewer-administered questionnaire adapted from the WHO facility service availability and readiness assessment questionnaire. The WHO questionnaire was contextualized into the Ethiopian situation by incorporating electric power and water supply availability for TB diagnostic services as one domain to the existing WHO facility assessment domains (Annex1). The data collection tool was pretested and validated/tool reliability/before the actual data collection (Cronbach alfa >0.85) was commenced. Coordinates of health facilities and kebele centroids were collected by geographic positioning systems (GPS). Ten data collectors (six health officers and four nurses) and three masters (MPH) holder public health practitioners (supervisors) who took training for three days collected data based on the data collection guideline book. Similarly, data on districts’ populations and other spatial data were obtained from the Amhara Regional Plan Commission Office. Moreover, data on physical accessibility/Euclidean distance between kebele centroids and the nearest health facility was measured using the near function of analysis tools in the ArcGIS10.6.
Qualitative Data Collection
Principal investigators together with three facilitators conducted an in-depth interview on ten TB officers, six laboratory heads and eight facility heads. The in-depth interview was conducted using an interview guide (focusing on barriers of TB service availability and readiness), and audio recorder. The average interview time was 50 mins (43 to 64 mins). Data were supplemented by conducting participant observation. On site visit (observation) of health facilities, TB clinics, laboratory departments, pharmacy departments, and facility stores were done to validate/cross-check/the quantitative and qualitative data.
Variables and Operational Definitions
Geographic distribution defined as the physical presence of health facilities as per the country’s standard for HSC and measured by functional health facility to the population ratio. The WHO sets two facilities per10000 population as a target for health facility density. To get the percentage of HSC, we divided the HSC by two (WHO target).38,42
Physical accessibility is the ability of the population to get TB services when they need it. It is measured by taking the mean distance from the nearest health facility, and a10km distance or two hours walk is used as a standard to measure access to health facilities in Ethiopia.38
It is the physical presence of TB services in each health facility. It is measured by using the proportion of health facilities that offer at least one of the following TB services: Diagnosis, treatment follow up or both.42
Facility readiness to TB services is the ability of health facilities to offer TB services. It was measured by the availability of trained staff, diagnistic and treatment guidelines, diagnostics, equipment, laboratory supplies, and anti-TB drugs. Health facilities that did not offer TB services were excluded from the denominator to compute service readiness statistics.42
Data Quality Assurance
The clarity and consistency of the questionnaire were checked by conducting a pretest in a similar setting. The tool was also validated using the Cronbach alfa test (ά > 0.85). Besides these, data collectors and supervisors took three days training and used a user-friendly data collection guide book. Supervisors and principal investigators gave regular supportive supervision to data collectors. Convenient data collection offices were arranged for data collection in each health facility. Triangulation of data sources and methods (TB officers at different levels, laboratory and facility heads), and data collection techniques (structured interview, in-depth interview and onsite observation) were applied to keep data quality/trustworthiness. Qualitative and quantitative data were supplimented by conducting onsite observation of health facilities and the respective departments.
Data Management and Analysis
Quantitative Data
The geographic distribution of health facilities was measured by using a facility to population ratio of each district. In Ethiopia, one health center is designed to serve 25,000 people: one clinic for 10,000 people, and a health post for about 5000 people.38 Similarly, we described the physical accessibility to the health facilities in terms of the average Euclidean distance between kebele centroids and the nearest health facility that was measured using the near function of analysis tools in the Arc GIS 10.6. Thus, areas located beyond a 10km radius from the nearest health facility were considered poorly accessible. The geographic distribution and accessibility of health facilities were mapped using ArcGIS 10.6 based on the coordinates of facility and kebele centroids. The spatial district and health facility data were managed using the world Geodetic coordination system of 1984 (WDS84), and Universal Transverse Mercator Zone 37°N projection system.
TB service availability was measured by taking the percentage of health facilities that offer at least one TB service. Likewise, facility readiness was assessed using 16 tracer items grouped into four core domain indicators, namely trained staff and diagnostic and treatment guidelines, diagnostics, anti-TB drugs, and laboratory supplies. Then the readiness score was computed as the mean percentage in terms of those four core domains. The general service readiness index/overall readiness score/was computed by taking the mean value of the four core domain scores.42
Various descriptive data on facility attributes, health service coverage, mean distance from the nearest health facility, service availability and readiness scores were cleaned and analyzed using SPSS version 25. By taking the mean score value of 16 tracer items as a cutting of point, health facilities that scored a mean value of ≥8 were grouped as having good readiness and those scoring below the mean score value were categorized as poor readiness.42
Qualitative Data Analysis
Data transcription and analysis was started during data collection. The audio records were first transcribed verbatim and then translated into English for analysis. Investigators read and reread the transcripts repeatedly to understand the data and generate initial codes to texts. Then the transcribed codes were refined and organized into categories. By merging similar categories, we got six themes and more sub-themes under each theme through iteration. Data were analyzed by thematic analysis techniques using a QS NVivo12 software program. Identified themes are presented narratively by supporting them with important quotes from the respondents. Selected quotes are presented in the result section.
Ethical Consideration
The ethical review committee of the College of Medicine and Health Sciences, Bahir Dar University reviewed and approved the research protocol, and gave an ethical clearance (protocol No: 091/18-04). The Amhara Regional State Health Bureau and East Gojjam Zone Health Department gave supporting letters. Data were collected after getting written informed consent from each study participant. Participation in the interview was voluntary based including the right to withdraw from the study at any time point without any preconditions.
Results
Geographic Distribution and Accessibility of Health Facilities
Geographical Distribution of Health Facilities
The geographic distribution of health facilities seems dispersed across districts even if the rural and bordering areas had relatively poor facility density. The majority, 102 (85%) of the facilities were public health centers and 80 (66.7%) of them were from rural areas (Table 1). The overall HSC in terms of functional health facilities to TB services was 0.46 per10000 people (23%) ranging from 0.34–1.7 per10000 people. The percentage of HSC varied from 10% to 85% across districts where urban settings had relatively better HSC (Figure 1).
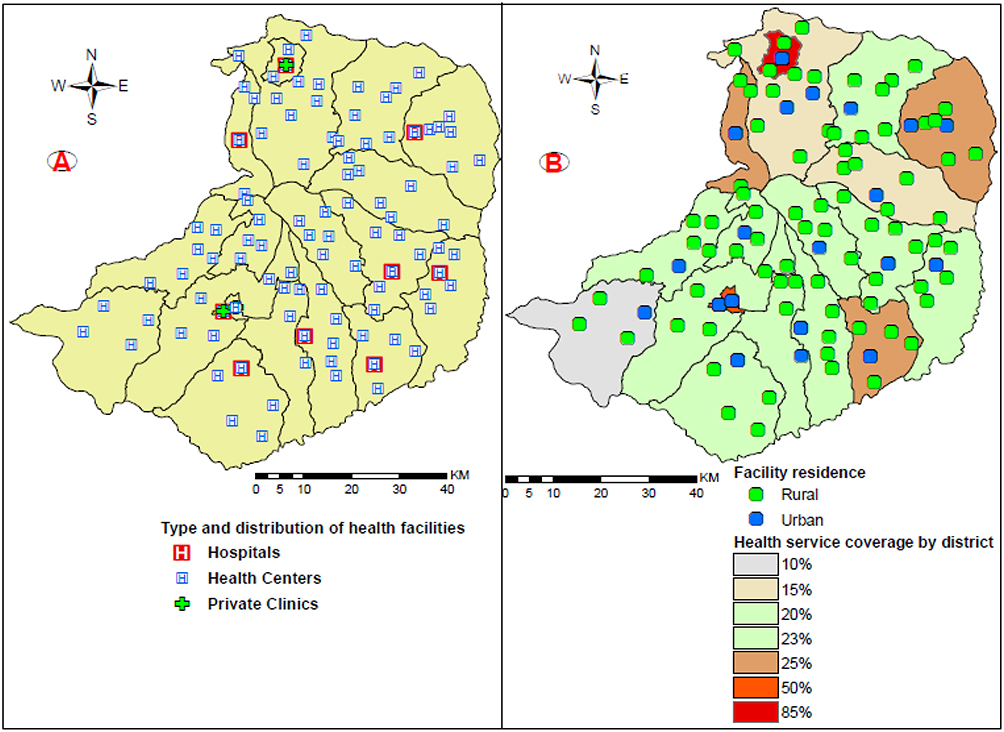 |
Figure 1 Geographical distribution of health facilities by residence in East Gojjam zone, Ethiopia, 2018. |
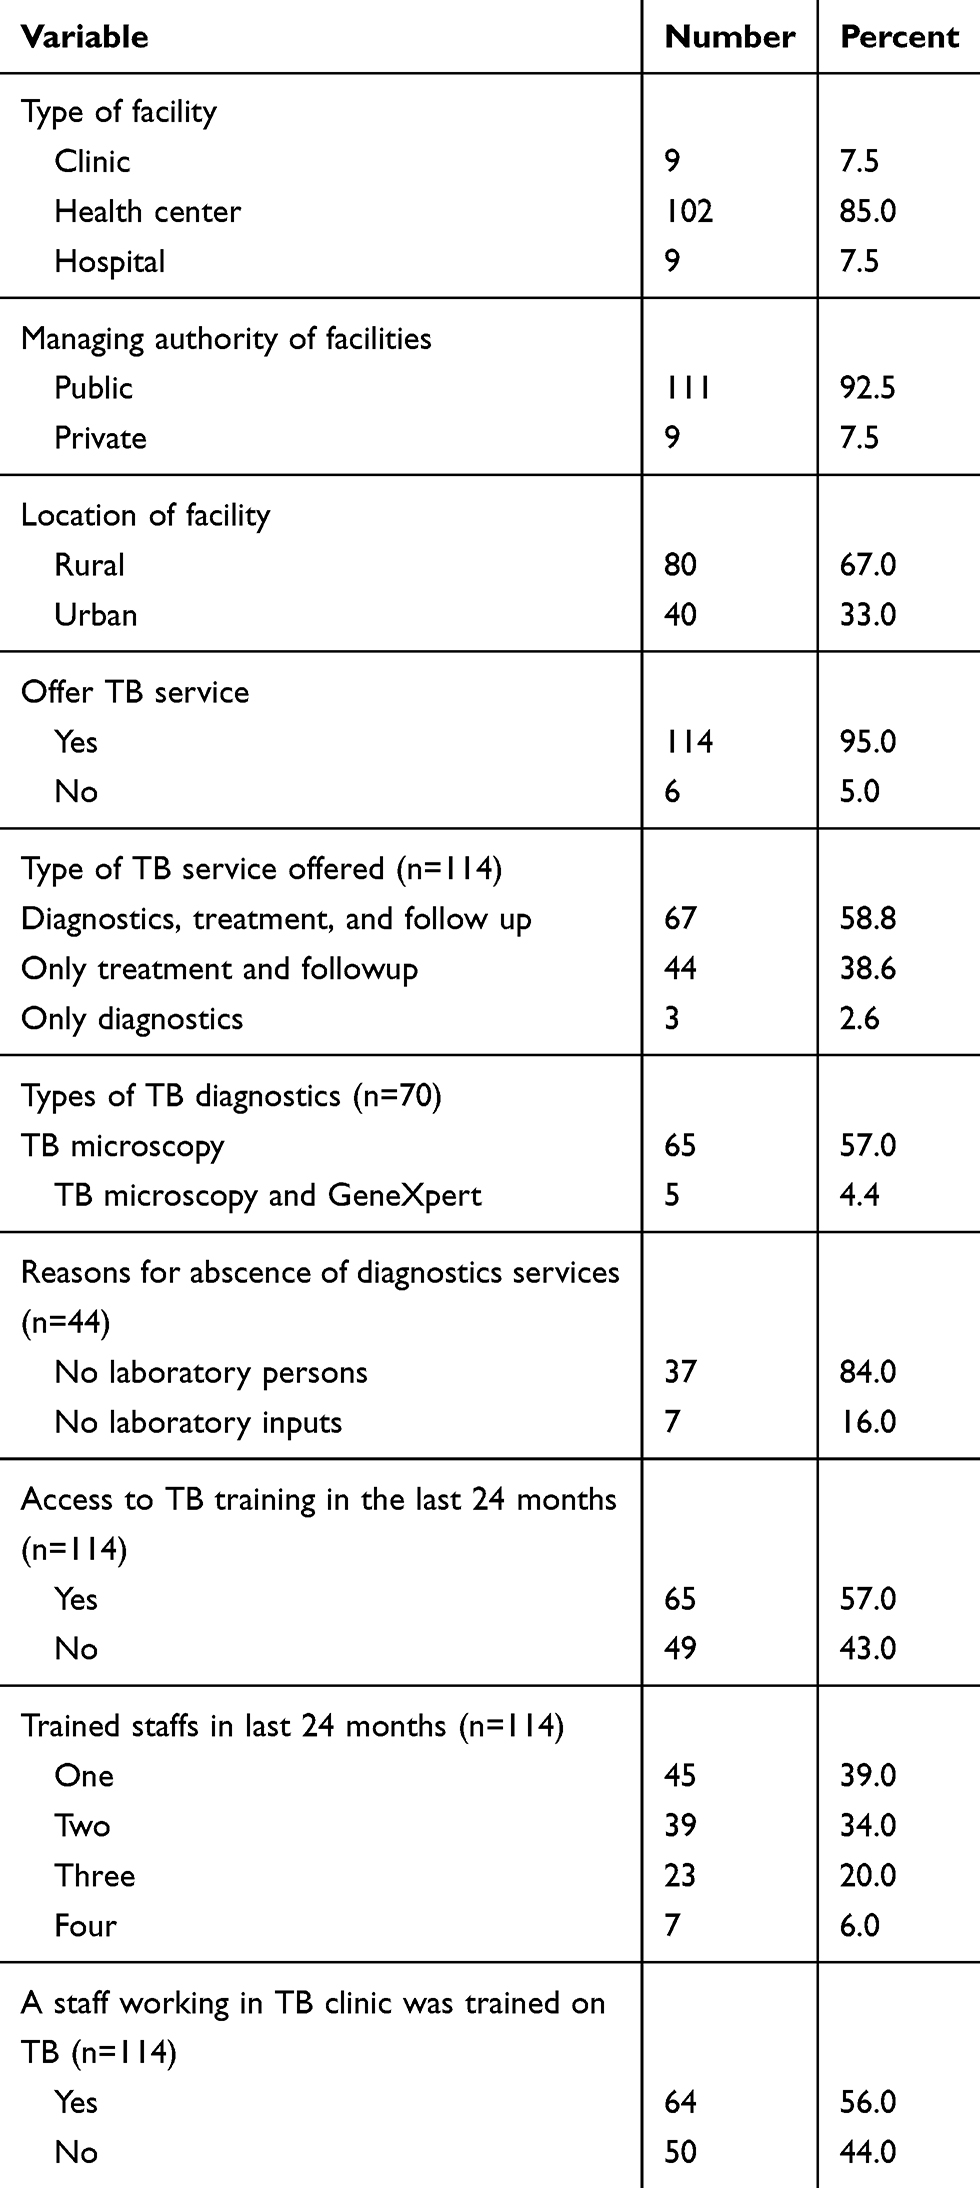 |
Table 1 Facility Variables on TB Service Availability and Readiness in East Gojjam Zone of Ethiopia, 2018 |
Geographic Accessibility of Health Facilities to TB Services
Regarding physical accessibility to TB services, the mean distance from the kebele centroids/census enumeration areas/to the nearest health facilities was 8km ranging from 0.5 to 16 km. Over two-third, 282 (68%) of kebeles were located within 10km distance from the nearest health facilities. Almost all kebeles located around the borders had a mean distance of greater than 10km from the nearest health facilities. All the health facilities located out side of the 10km distance had poor HSC (≤ 25%), offered only TB treatment follow up services and had poor readiness.
Besides those six health facilities that did not offer TB services, 44 (38.6%) of the TB service offering facilities had poor readiness (Figure 2).
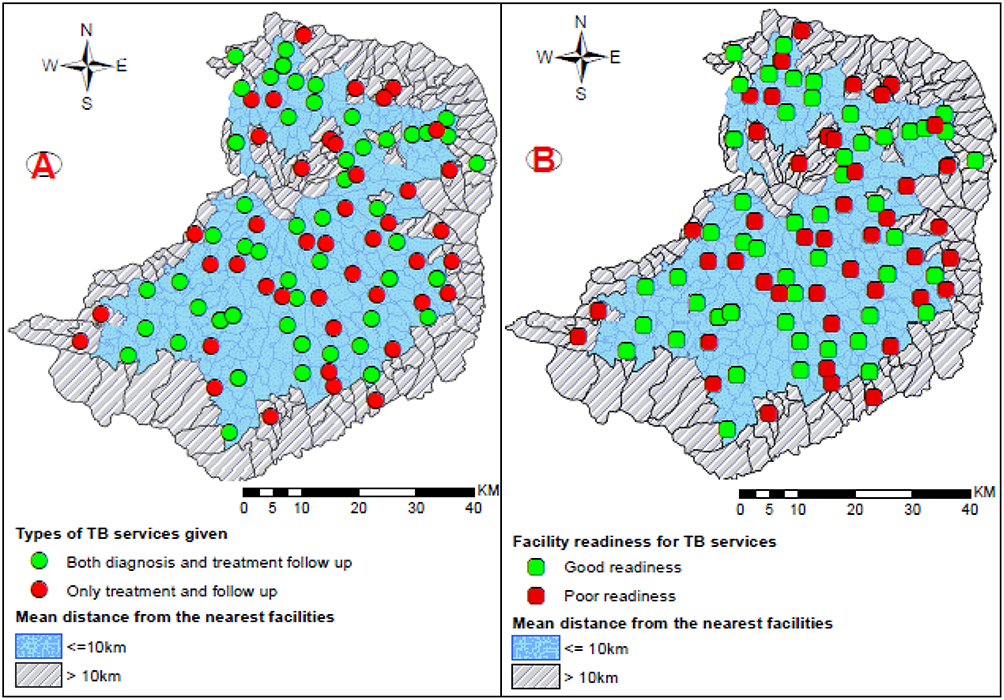 |
Figure 2 Physical accessibility to types of TB services and facility readiness in East Gojjam Zone, 2018. |
Tuberculosis Service Availability and Facility Descriptions
Most of the health facilities, 111 (92.5%) were public and 114 (95%) (95% CI: 91–99) of them offered at least one TB service. Sixty-seven (58.8%) of the health facilities provided both TB diagnostics and treatment follow up services. However, 44 (38.6%) of them had no sputum smear microscopy services due to lack of laboratory personnels (87%) and laboratory inputs (13%). The number of functional sputum smear microscopy service was 2.66 for 100,0000 people. Only five hospitals had GeneXpert services besides sputum smear microscopy services and none of the health facilities had sputum culture services for TB diagnosis during the study period. Over half, 65 (57%) of the facilities had opportunity to TB control training in the last 24 months and 64 (56%) of them had trained TB staff working at TB clinics during the data collection period (Table 1).
Health Facility Readiness to Deliver TB Services
Based on the facility readiness assessment, 79 (69%) of the health facilities had guidelines for the diagnosis and treatment of TB. Similarly, 68 (60%) health facilities had guidelines for the management of TB-HIV coinfection. Over two-third, 79 (69%) health facilities had at least one staff trained on diagnosis and treatment of TB followed by 74 (65%) trained on TB-HIV coinfection. Only 40 (35%) health facilities had at least one staff trained on MDR-TB. Most of the health facilities, 111 (97%) had access to first-line anti-TB drugs. Similarly, 72 (63%) of them had HIV diagnostic capacity and only 23 (20%) had all the 16 tracer items (Figure 3).
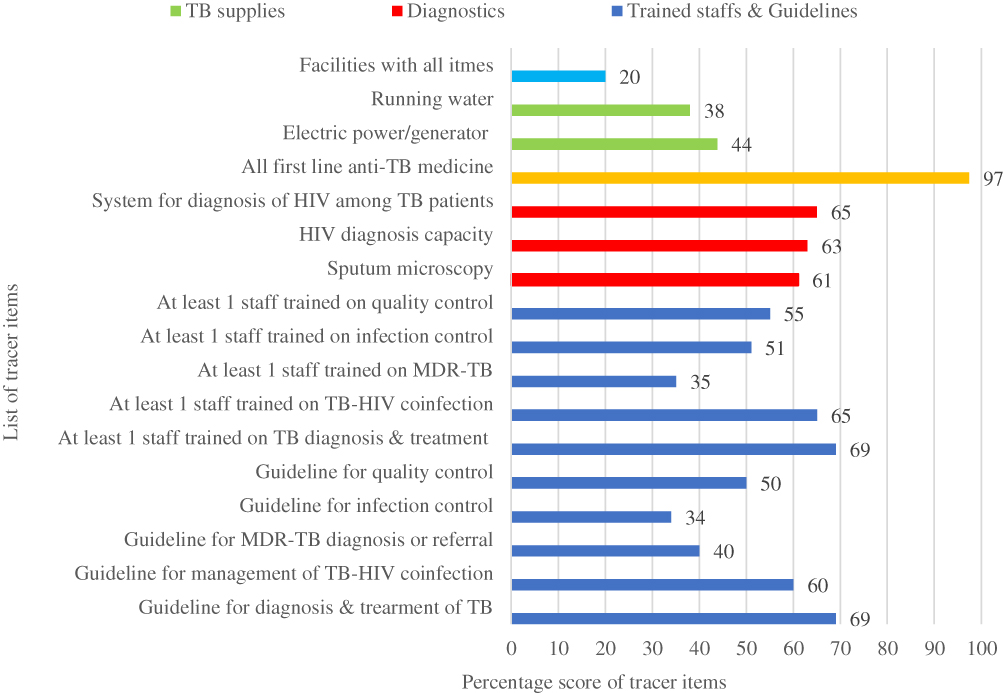 |
Figure 3 Percentage score of 16 tracer items on TB service readiness in the East Gojjam zone of Ethiopia. |
By assuming that the four core domains have equal weight to measure facility readiness, we computed the overall readiness index by taking the mean value of four core domains, which is 63.5%(95% CI; 25%-101.8%). The first-line anti TB drugs had the highest readiness score whereas basic TB service supplies had the smallest score (Figure 4).
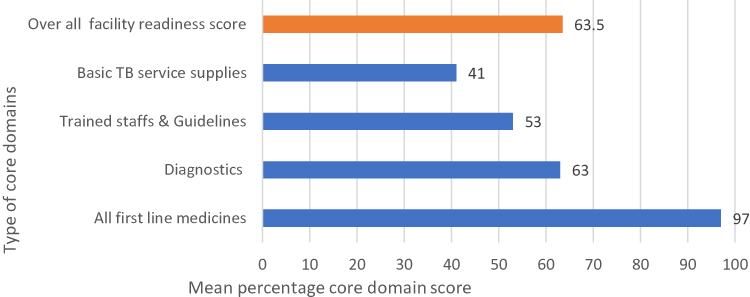 |
Figure 4 Mean percentage score of four core domain TB readiness indicators in East Gojjam zone of Ethiopia, 2018. |
Barriers of Service Availability and Readiness for TB Services
A total of 24 participants: 10 TB officers, eight facility heads and six laboratory heads were interviewed. The majority (18 of 24) participants were males, 14 had ≥10 years work experiences, and only five were second-degree graduates (Table 2).
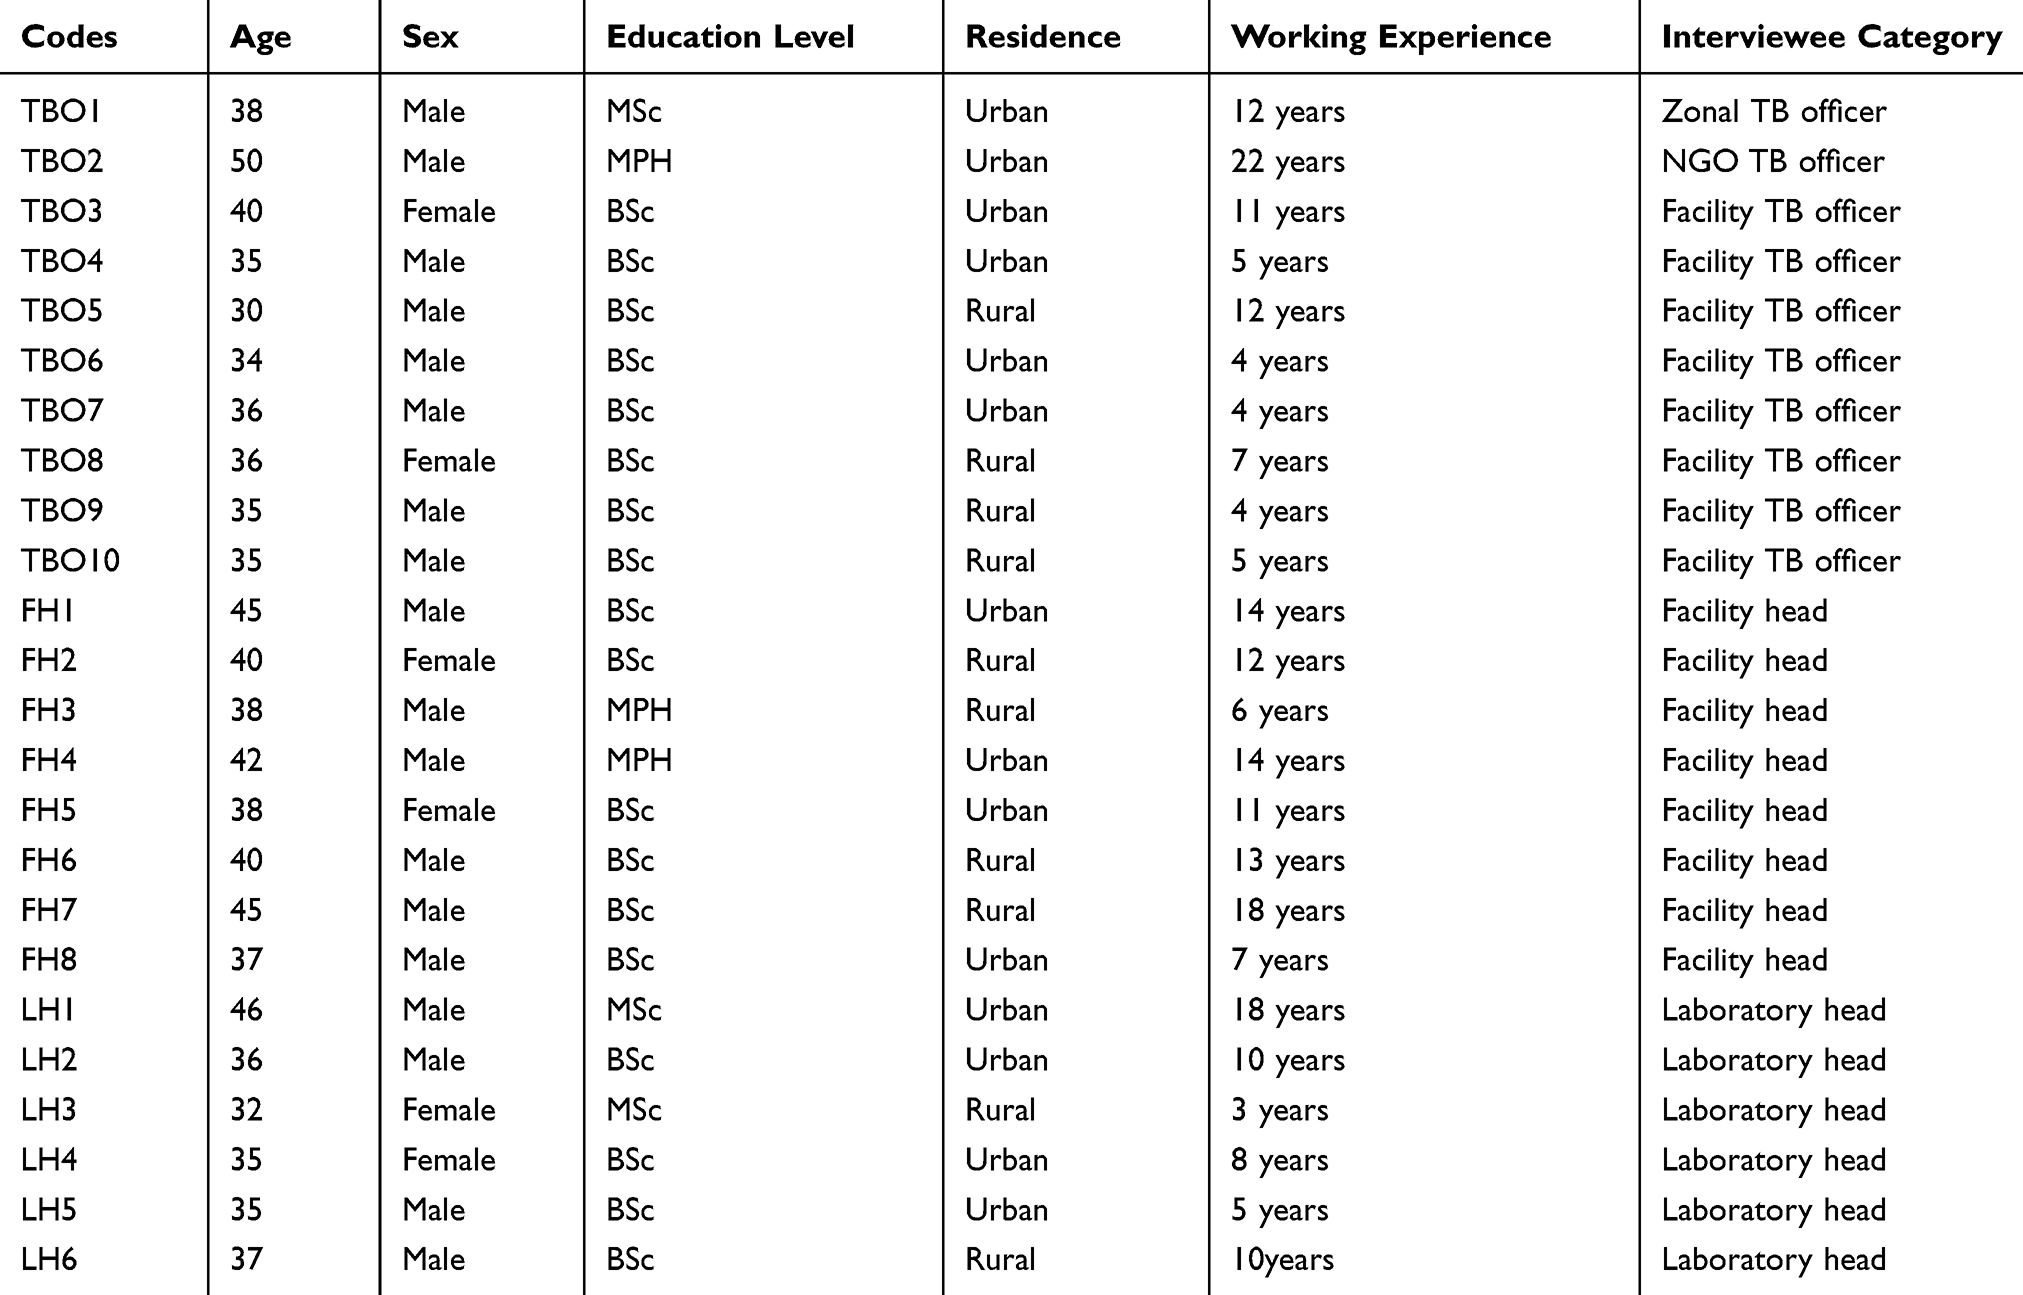 |
Table 2 Profile of Interviewed People in East Gojjam Zone of Ethiopia, 2018 |
Barriers to TB service availability and readiness were summarized into six themes: 1) Shortage of trained manpower; 2) Shortage of suppliers; 3)Scarcity of budget; 4) Poor TB program supports; 5). Poor health system management practices and 6) geographic location and community settlements.
Shortage of Trained Manpower
All participants agreed that skilled manpower is the backbone of TB control programs. The shortage of laboratory professionals was identified as a key challenge in the study area. They said that TB detection and treatment follow up were unthinkable without quality laboratory services. They pointed out that the absence of laboratory graduates and high staff turnover were reasons for the manpower shortage.
“ … laboratory services are the cornerstones of TB control programs, but the scarcity of laboratory staffs poses a serious problem on access to laboratory services that contribute to poor readiness of health facilities and low TB case detection. Because of laboratory staff shortage, many health facilities are not offering sputum smear microscopy services, and we have started sample transportation system to transfer samples to other facilities that have TB diagnostic services.” TBO2
All the interviewed participants agreed that the government is accountable for the laboratory staff shortage since this has happend following the government decision to stop the trianing of laboratory technichians as there was less demand of these professionals in the job market for some years. Participants stated that decision making based on a snapshot observation is very dangerous to the overall health system. The health system managers need to be visionary and make decisions based on evidence and thinking about the future.
“ … the absence of laboratory professional University graduates is due to the directions given to the Universities by the government to stop producing laboratory professionals by assuming that there were adequate numbers of graduates, but it was not supported by evidence.” LH1
“ … staff turnover and change of profession due to poor management practice, abscence/low level of incentives and unfair staff treatment have become challenges in the study area.” TBO3
Shortage of Suppliers
All the interviewed participants agreed that giving every responsibility to distribute all materials, equipment, anti-TB drugs, and laboratory supplies of health facilities to a single organization, Pharmaceutical Fund and Supply Agency (PFSA), has many limitations. They described that one single organization may not have the, capacities, resources, and strategies to manage the procurement and timely distribution of TB comodities to all health facilities. It is because of these limitations that most health facilities are suffering from shortage of materials, equipment, anti-TB drugs, reagents and other supplies. procurement and delivery delays of TB commodities is the most frequently observed problems of PFSA.
“ … The limitations of PFSA, and the lengthy procurement bureaucracies practiced in the respective government institutions have been the topic of discussions and reported several times, but it remains to cause an unexpected delay in accessing supplies and is affcting facility readiness for TB services. Shortage of reagents, anti-TB drugs, and supplies are common challenges that are affecting TB control activities.” FH2
In addition, all the study participants stated that the Ethiopian government procurement system and procedures have played a major role in poor PFSA performance which greatly affects the readiness of health facilities to deliver TB services.
“ … PFSA’s procurement system and procedures are extremely time-consuming and have created unnecessary delays in accessing facility inputs. A single procurement procedure will take a minimum of half a year or more. This will affect facility readiness and service provision. The TB control program by its nature requires uninterrupted supply of program inputs. However, facilities are frequently facing shortage of acid-fast-bacilli (AFB) smear microscopy reagents, sputum cups, slides and anti- TB drugs.” TBO1
Shortage of Budget
The interruption of the TB control program budget from the national and local NGOs due to the absence of funders and economic crisis added a huge burden to the Ethiopian government in allocating TB control program budgets. The allocated budget has been inadequate to cover the TB program activities since the nature of the program is resource-intensive, and majority of the budget goes to the procurement of TB commodities, covering costs for outreach services and community mobilization
“ … this limited budget has a direct impact on accessing equipment, anti-TB drugs, reagents, facility equity, supervision, transportation and supports to TB patients.” FH7
Poor TB Program Supports
During the indepth interview, most of the participants mentioned that TB program supports incuded program management, technical, training, materials and financial supports which were mostly covered by NGOs. They also stated that a significant number of non-health political leaders did not give proper attention to TB control programs compared to other health intervention programs. All these directly/indirectly affect TB control program belongingness, budget allocation and other supports which can affect facility readiness to TB services.
“ … many political leaders assumed that TB is only the responsibility of the World Health Organization (WHO) and NGOs. As a result, less attention was given to TB control from political leaders that compromised the performance of TB control programs and staffs’ motivation at large these days. Integration of TB control activities with other programs such as HIV/AIDS is limited.” LH3
Study participants noted that lack of regular supportive supervision can affect facility readiness and TB control program performance.
“ … the trend of supervision is just a type of superficial inspection, and is biased towards facilities which are easily accessible and located at urban and semi-urban settings than facilities located at rural areas that have poor infrastructures. Also, there is no proper and timely post-supervision feedback .” TBO4
Poor Health System Management Practices
Study participants described that poor management practice has become an issue to the health system. We are hearing frequent complaint from health workers and are also observing high staff turnover that is possibly linked to poor management practice. This is usually manifested by excercising unfair decision making interms of staff motivation and provision of incentives. The problem is observed at the time of new staff recruitment or assignment of staff members at the different departments in the health facilities.
“ … exercising partiality among staff members, denying incentives and working with intentionally formed and favored groups have become common practices among many facility managers. Poor program management practice contributes to high staff turnover, poor access to TB control inputs such as anti-TB drugs, equipment, reagents, inadequate electric power and water supplies, lack of training, and poor staff motivating strategies. These can directly affect the quality of TB control program activities.” LH6
Geographic Location and Community Settlement
Geographic location of health facilities highly affects population access to health services, distribution of health facilities, service provision and facility readiness to TB services. East Gojjam zone has many hard to reach areas, and the scattered settlement of the community has a great impact on the provision of quality TB control services.
“There are difficult geographic features in East Gojjam zone and over 85% of the population is living in rural settings in a scattered manner. This affects access to transportation, water sources, communication and quality health service. For example, transportation is a key challenge to access anti-TB drugs, equipment, laboratory reagents, to conduct supervision, and seek health care service.” TBO9
Discussion
This study indicated that there is a need for more efforts to improve health facility readiness for the provision of quality TB services to the population in East Gojjam Zone of Amhara Region, Ethiopia. The status of health service coverage for TB services was low and greatly varied across the districts (10%-85%). Rural and border areas had poor health service coverage, ≤25% (Figure 1). The HSC based on sputum smear microscopy services was 13% (0.26 per10000 people). This is very far from the national and WHO HSC targets: 2 facilities per10000 population.42 This implies that many people are not getting TB diagnostic services and/or those limited functional health facilities are overloaded to serve the whole population in the study area. This might be due to limited functional health facilities, population size, and geographic location. The overall HSC for TB services (23%) in the study zone was lower compared to findings from Southern Ethiopia where the TB control service coverage was 73%.23 This variation could be due to differences in population size and the number of functional health facilities. In the Southern Ethiopia study, there were 81 facilities offering sputum smear microscopy which were 70 in our study. Former study findings also showed that most of the developing countries had low HSC4–6,34,43 which might be related to poor facility readiness, lack of adequate budget, high population size and poor infrastructure. The health authorities in the study zone should work in scaling up of sputum smear microscopy services in the areas where this service is not available.
Concerning physical accessibility to TB services, a third of kebeles were located out side of the 10km radius from the nearest health facilities. Most of the rural and bordering areas had poor physical accessibility to TB services (Figure 2). This indicates that the population residing in those areas are underserved as a result of geographic locations and low HSC which is related to the uneven health facility distribution and scattered population settlements. We also know that access to health facilities is not necessarily a guarantee for TB service utilization.29 The distant location of health facilities will affect access to transportation, delivery of TB program inputs and information sources. This will then lead to low facility readiness, poor health seeking behavior, and high patient delay which encourages patients to search for alterantive health care including self treatment, visiting traditional healers and religious places for treatment.23,32 Similarly, the qualitative part of this study identified that geographic location and scattered community settlements were barriers to TB service availability and readiness.
The present physical accessibility status, estimated at a mean distance of 8km from the nearest facility, was higher compared to findings from Southern Ethiopia,23 where the mean distance from the nearest health facility was 3.2km (1.5–12.4km). The potential explanation for this variation might be differences in population settlement and distribution of functional health facilities. This finding is supported by previous study results from Ghana,4,6 Mozambique,5 and South Africa32 where many localities had limited access to health facilities (≥10km distance).
Although 114 of the 120 facilities offered at least one TB service in the study area, 44 of the 114 had no sputum smear microscopy services in addition to those six facilities that did not offer any of the TB services. Forty seven (41%) health facilities also had poor readiness scores for TB services. This indicates that the problems of TB control in East Gojjam Zone are not only poor facility distribution and accessibility, but also poor TB service readiness as only 70 health facilities were serving the total population for TB diagnostic services at the time of the study period. This may suggest that many TB cases remain undetected in the community. This is supported by recent study findings from the study area39 where the total TB infectious pool was estimated at 56,496 infectious person-days, which is alarming. This is mainly due to the shortage of laboratory staff and facility inputs.39,44 The qualitative part of this study also supported this where manpower shortage, limited facility input suppliers, poor management practices and TB program supports were barriers of TB service availability and readiness.
Based on the 2018 East Gojjam Zone Health Department's annual report, 112 laboratory staff were working in those 120 health facilities. The Ethiopian facility standard guideline, however, requires 285 laboratory staff for those facilities (2 for each clinic and health center, and 6–11 for each hospital).45 But there were only 112/285 (39.3%) laboratory staff, hence most of the facilities did not fulfill the standard requirements (Table 1). This finding is related to the absence of new laboratory University graduates, high staff turnover and change of profession as a result of poor incentives, poor management and desire for better position and work at other preferred work places.
The present service availability score was higher compared to findings from the Ethiopian national service availability and readiness assessment8 where the average national TB service availability was 57% (34% to 83%) and sputum smear microscopy was 50%. The variation could be due to differences in area coverage, sampling (census vs sampled), study period and sample size. The finding was also larger compared to study results from other countries including Ghana,7 Somalia46 and Tanzania43 where only 10%, 8%, and three facilities offered TB services, respectively. The low service availability observed in these countries were attributed to lack of diagnostic tests, anti-TB drugs, laboratory staff and poor infrastructures.
In contrast, the service availability score in our study was lower than a study finding from Nepal47 in which about 90% of health facilities offered TB services. The probable explanation for this disparity might be variations in HSC, facility readiness, TB service inputs, and TB program supports. Likewise, the present 70 (61.4%) sputum smear microscopy service was lower compared to findings from a former Ethiopian study [23] where 81 (71%) health facilities had sputum smear microscopy services. This variation was due to differences in facility readiness, presence of laboratory staff, training access, and TB control inputs. In the former study, about 90% of staff were trained on TB control, no report on staff shortage, 80% facilities had necessary reagents and supplies for sputum smear microscopy, and 65% facilities had electric power. But, in our study, only 57% had training access, 77 facilities had laboratory staff, 61.4% facilities had necessary reagents and supplies for sputum smear microscopy, and only 44% facilities had electric power/functional generator. This implies that significant number of health facilities lacked the required inputs for implementing the TB control activities that lowered the TB control program performance in the study zone.
Similarly, the overall TB readiness score of this study was 63.5% ranging from 41% (basic supplies) to 97% (first line anti-TB drugs supplies). This shows that there is a 36.5% readiness gap to offer TB services, which is another problem in addition to low HSC. This finding was lower compared to the national TB readiness score (68%). The variation was due to differences in the scores of core domains (staff and training, and diagnostics availability) that had higher scores during the national assessment. However, the first-line anti TB drug domain had a higher score (97%) in this study compared to the national score (94%). Besides this, the national readiness score was only based on 12 tracer items, but was based on 16 items in our study including four items which are basic to evaluate TB readiness (Figure 3). The sample size could also be a factor for the variation where the national assessment used a larger sample size than ours.
On the other hand, the current readiness score (63.5%) was relatively higher compared to research findings from Mongolia35 where the readiness index score for TB services was 53%. This was due to unavailability of diagnostic tests and essential drugs where only 44% of the health facilities could provide basic health services.
This study also showed that most of the rural health facilities had poor readiness and offer only treatment and follow up services (Figure 2). Since more than 85% of the population in the study area is living in rural areas,40 the population are not getting the appropriate TB diagnostic services mainly due to the absence of laboratory staff, electric power, AFB reagents, sputum smear microscopy and water supply services (Figure 3). This finding agrees with study results from other part of Ethiopia44 where lack of laboratory staff, electric power, reagents and water sources were barriers to TB diagnosis. The qualitative part of this study also supported this where staff shortage, poor TB program support, lack of budget, shortage of suppliers, poor management and distant geographic location of health facilities were barriers to TB service availability and readiness.
Similar results were also reported from previous studies in Ethiopia,8,23,39,44 Ghana,4,6,7 Mozambique,5 South Africa,32 Nigeria,33 Tanzania,43 Nepal47 and Mongolia35 where most of the rural health facilities had uneven health facility distribution, inaccessible, and poor readiness (lack of staff, reagents, electric power, and equipment) of health facilities.
Although this is the first study in Ethiopia that considers geographic distribution of and access to TB services, TB service readiness status and barriers to readiness for TB services, it has potential limitations that need to be considered while interpreting the findings of the current study. The THSC was determined using only hospitals, health centers and private clinics. If health posts were considered, the THSC would be slightly changed since they have roles in DOTS.8 Similarly, this study did not assess road accessibility, which can determine accessibility to TB services. The distance we measured between kebele centroids and nearest health facility was Euclidean/straight line distance, which might not always be true. Moreover, we only assessed the availability of TB diagnistic and treatment guidelines, but not the adherence to those guidelines.
Conclusions
The geographical distribution of and accessibility to TB services were low in the study area compared to the previous studies and were worse in rural and border areas. A third of the studied kebeles had poor accessibility (>10km) to the nearest health facility. Many health facilities had poor readiness score and no sputum smear microscopy service was available. Absence of adequate laboratory personnel, inadequate TB commodity supplier, lack of budget, poor TB program support, lack of good management practice, and distant geographic location of health facilities were identified as barriers of health facility readiness to offer quality TB services. Improving the laboratory personnel shortage and scalling up sputum smear microscopy availability, exercising good management practices at health facilities, and providing regular refresher training to health workers will improve the current low level of readiness to TB services in the study area.
Ethical Clearance
This study was conducted in accordance with the declaration of Helsinki. The research was ethically cleared and got approval from the ethical review committee of the College of Medicine and Health Sciences, Bahir Dar University (Protocol No: 091/18-04). Data were collected after getting written informed consent from each study participant. Participation was fully voluntary based and data confidentiality was ascertained through anonymity.
Data Sharing Statement
All the raw data supporting the findings can be obtained from the corresponding author with a reasonable request.
Acknowledgments
We would like to thank Bahir Dar University for providing financial support and ethical clearance. We would also like to thank the staff of the Amhara Regional Health Bureau and East Gojjam Zone Health Department, study participants, data collectors, and supervisors for their unreserved supports during data collection.
Disclosure
The authors declared that they have no competing interests to this work.
References
1. World Health Organization. Global tuberculosis report 2018. Geneva: Licence: CC BY-NC-SA 3.0 IGO; 2018.
2. de Andrade KVF, Nery JS, de Souza RA, Pereira SM. Effects of social protection on tuberculosis treatment outcomes in low or middle-income and in high-burden countries: systematic review and meta-analysis. Cad Saúde Pública. 2018;34(1):e00153116. doi:10.1590/0102-311x00153116
3. Tanimura T, Jaramillo E, Weil D, Raviglione M, Ln K. Financial burden for tuberculosis patients in low- and middle-income countries: a systematic review. Eur Respir J. 2014;43:1763–1775. doi:10.1183/09031936.00193413.
4. Kuupie D, Adu KM, Apiribu F, et al. Geographic accessibility to public health facilities providing tuberculosis testing services at point-of-care in the upper east region, Ghana. BMC Publ Health. 2019;19:718. doi:10.1186/s12889-019-7052-2
5. Luis ADA, Cabral P. Geographic accessibility to primary healthcare centers in Mozambique. Int J Equity Health. 2016;15:173. doi:10.1186/s12939-016-0455-0
6. Asare-Akuffo F, Twumasi-Boakye R, Appiah-Opoku S, O. Sobanjo J. Spatial accessibility to hospital facilities: the case of Kumasi, Ghana. Afr Geog Rev. 2019. doi:10.1080/19376812.2019.1636667
7. Amenuvegbe GK, Francis A, Fred B. Low tuberculosis case detection: a community and health facility based study of contributory factors in the Nkwanta South district of Ghana. BMC Res Notes. 2016;9:330. doi:10.1186/s13104-016-2136-x
8. EPHI, EFMoH, WHO. Ethiopian service availablity and readiness assessment summary report. 2016.
9. Alemu G. Mama M: intestinal helminth co-infection and associated factors among tuberculosis patients in Arba Minch, Ethiopia. BMC Infect Dis. 2017;17(1):68. doi:10.1186/s12879-017-2195-1
10. Belay M, Bjune G. Abebe F: prevalence of tuberculosis, HIV, and TB-HIV co-infection among pulmonary tuberculosis suspects in a predominantly pastoralist area, northeast Ethiopia. Glob Health Action. 2015;8:27949. doi:10.3402/gha.v8.27949
11. Ekeke N, Ukwaja KN, Chukwu JN, et al. Screening for diabetes mellitus among tuberculosis patients in Southern Nigeria: a multi-centre implementation study under programme settings. Sci Rep. 2017;7(44205). doi:10.1038/srep44205.
12. Pizzol D, Di Gennaro F, Chhaganlal KD, et al. Prevalence of diabetes mellitus in newly diagnosed pulmonary tuberculosis in Beira, Mozambique. Afr Health Sci. 2017;17(3):773–779. doi:10.4314/ahs.v17i3.20
13. Deribew A, Deribe K, Dejene T, Tessema GA, Melaku YA, Lakew Y. Tuberculosis burden in Ethiopia from 1990 to 2016: evidence from the Global Burden of Diseases 2016 Study. Ethiop J Health Sci. 2018;28:5.
14. Asemahagn MA. Are shopkeepers sufferring from TB infection in Bahir Dar City, Northwest Ethiopia. Tuberc Res Treat. 2017;2017(2569598):7. doi:10.1155/2017/2569598
15. Datiko DG, Guracha EA, Michael E, et al. Sub-national prevalence survey of tuberculosis in rural communities of Ethiopia. BMC Publ Health. 2019;19(1):295. doi:10.1186/s12889-019-6620-9
16. Shaweno D, Trauer JM, Denholm JT, McBryde ES. A novel Bayesian geospatial method for estimating tuberculosis incidence reveals many missed TB cases in Ethiopia. BMC Infect Dis. 2017;17:662. doi:10.1186/s12879-017-2759-0
17. EFMoH.
18. Alene KA, Viney K, Gray DJ, McBryde ES, Wagnew M, Clements ACA. Mapping tuberculosis treatment outcomes in Ethiopia. BMC Infect Dis. 2019;19:474. doi:10.1186/s12879-019-4099-8
19. Gebreegziabher SB, Bjune GA, Yimer SB. Applying tuberculosis management time to measure the tuberculosis infectious pool at a local level in Ethiopia. Infect Dis Poverty. 2017;6:156. doi:10.1186/s40249-017-0371-6
20. Kebede AH, Alebachew Z, Tsegaye F, Lemma E, Abebe A, Agonafir M, Kebede AJ, Demissie D, Girmachew F, Yaregal Z, Dana F. The first population-based national tuberculosis prevalence survey in Ethiopia, 2010–2011. The International Journal of Tuberculosis and Lung Disease. 2014 Jun 1;18(6):635–639.
21. Fekadu L, Hanson C, Osberg M, Makayova J, Mingkwan P. Increasing access to tuberculosis services in Ethiopia: findings from a patient-pathway analysis. J Infect Dis. 2017;216(Suppl7):696–701. doi:10.1093/infdis/jix378
22. Ethiopian Federal Ministry of Health. National Comprehensive Tuberculosis, Leprosy and TB/HIV Training Manual for Health Care Workers. Updated version: November. Addis Ababa, Ethiopia; 2018.
23. Dangisso MH. Tuberculosis control in Sidama zone: program persofmance and Spatial Epidemiology. 2016.
24. Asres A, Jerene D, Deressa W. Delays to treatment initiation is associated with tuberculosis treatment outcomes among patients on directly observed treatment short course in Southwest Ethiopia: a follow-up study. BMC Pulm Med. 2018;18:64. doi:10.1186/s12890-018-0628-2
25. Awoke N, Dulo B, Wudneh F. Total delay in treatment of tuberculosis and associated factors among new pulmonary TB patients in selected health facilities of Gedeo Zone, Southern Ethiopia, 2017/18. Interdiscip Perspect Infect Dis. 2019;2019. doi:10.1155/2019/2154240
26. Getnet F, Demissie M, Assefa N, Mengistie B, Worku A. Delay in diagnosis of pulmonary tuberculosis in low-and middle-income settings: systematic review and metaanalysis. BMC Pulm Med. 2017;17:202. doi:10.1186/s12890-017-0551-y
27. Abebe G, Deribew A, Apers L, Woldemichael K, Shiffa J. Knowledge, health seeking behavior and perceived stigma towards tuberculosis among tuberculosis suspects in a rural community in Southwest Ethiopia. PLoS One. 2010;5(10):e13339. doi:10.1371/journal.pone.0013339
28. Gelaw SM. Socioeconomic factors associated with knowledge on tuberculosis among adults in Ethiopia. Tuberc Res Treat. 2016;2016:11. doi:10.1155/2016/6207457
29. O’Connell T, Rasanathan K, Chopra M. What does universal health coverage mean? Lancet. 2014;383(9913):277–279. doi:10.1016/S0140-6736(13)60955-1
30. Jayasuriya NA, Derore K. Food security and nutrition among the tuberculosis-infected patients. A case study among patients at the chest clinic in Sri Lanka. 2015.
31. Lorent N, Choun K, Malhotra S, et al. Challenges from tuberculosis diagnosis to care in community-based active case finding among the Urban Poor in Cambodia: a mixed-methods study. PLoS One. 2015;10(7):e0130179. doi:10.1371/journal.pone.0130179
32. Stellenberg EL. Accessibility, affordability and use of health services in an urban area in South Africa. Curationis. 2015;38(101):1–7. doi:10.4102/curationis.v38i1.102
33. Oyekale AS. Assessment of primary health care facilities’ service readiness in Nigeria. BMC Health Serv Res. 2017;17(1):172. doi:10.1186/s12913-017-2112-8
34. Al-Taiar A, Clark A, Longenecker JC, Whitty CJM. Physical accessibility and utilization of health services in Yemen. Int J Health Geogr. 2010;9:38. doi:10.1186/1476-072X-9-38
35. Jigjidsuren A, Byambaa T, Altangerel E, Batbaatar S, Saw YM, Kariya T. Free and universal access to primary healthcare in Mongolia: the service availability and readiness assessment. BMC Health Serv Res. 2019;19:129. doi:10.1186/s12913-019-3932-5
36. World Bank, WHO. Half the world lacks access to essential health services, 100 million still pushed into extreme poverty because of health expenses. 2017.
37. EFMoH. Health sector transformation plan (HSTP): 2015/16-2019/20. 2015.
38. FMoH. HMIS Indicator Definitions: Technical Standards. Addis Ababa: Federal Ministry of Health; 2014.
39. Asemahagn MA, Alene GD. Yimer SA: tuberculosis infectious pool and associated factors in East Gojjam Zone, Northwest Ethiopia. BMC Pulm Med. 2019;19:229. doi:10.1186/s12890-019-0995-3
40. East Gojjam zone health office. The 2018 annual performance report of East Gojjam zone health office. 2018.
41. Amhara Regional Health Bureau. Regional health Bureau Annual performance report. 2018.
42. World Health Organization. Service Availability and Readiness Assessment (SARA): an annual monitoring system for service delivery: a reference manual, Version 2.1. 2013.
43. Mremi IR, Mbise M, Chaula JA. Distribution of primary health care facilities in Mtwara District, Tanzania: availability and accessibility of services. Tanzan J Health Res. 2018;20:4.
44. Dabaro D. Factors affecting tuberculosis case detection in Kersa District, South West Ethiopia. J Clin Tuberculosis Other Mycobacterial Dis. 2017;9:1–4. doi:10.1016/j.jctube.2017.08.003
45. FMoH. Ethiopian standard first edition final: medium clinic/health center/primary hospital/general hospital/specilized hospital – requirements, 2012.
46. Somali health authorities, WHO. Somali service availability and readiness assessment: summary report. 2016.
47. Aryal KK, Dangol R, Gartoulla P, Subedi GR. Health services availability and readiness in seven provinces of Nepal:further analysis of the 2015 Nepal health facility survey. 2018.
 © 2020 The Author(s). This work is published and licensed by Dove Medical Press Limited. The
full terms of this license are available at https://www.dovepress.com/terms
and incorporate the Creative Commons Attribution
- Non Commercial (unported, 3.0) License.
By accessing the work you hereby accept the Terms. Non-commercial uses of the work are permitted
without any further permission from Dove Medical Press Limited, provided the work is properly
attributed. For permission for commercial use of this work, please see paragraphs 4.2 and 5 of our Terms.
© 2020 The Author(s). This work is published and licensed by Dove Medical Press Limited. The
full terms of this license are available at https://www.dovepress.com/terms
and incorporate the Creative Commons Attribution
- Non Commercial (unported, 3.0) License.
By accessing the work you hereby accept the Terms. Non-commercial uses of the work are permitted
without any further permission from Dove Medical Press Limited, provided the work is properly
attributed. For permission for commercial use of this work, please see paragraphs 4.2 and 5 of our Terms.