Back to Journals » Diabetes, Metabolic Syndrome and Obesity » Volume 12
Genistein diet improves body weight, serum glucose and triglyceride levels in both male and female ob/ob mice
Authors Rockwood S, Mason D ![]() , Lord R, Lamar P, Prozialeck W, Al-Nakkash L
, Lord R, Lamar P, Prozialeck W, Al-Nakkash L ![]()
Received 19 May 2019
Accepted for publication 30 August 2019
Published 3 October 2019 Volume 2019:12 Pages 2011—2021
DOI https://doi.org/10.2147/DMSO.S216312
Checked for plagiarism Yes
Review by Single anonymous peer review
Peer reviewer comments 2
Editor who approved publication: Professor Ming-Hui Zou
Schuyler Rockwood,1 Daniel Mason,1 Ryan Lord,1 Peter Lamar,2 Walter Prozialeck,2 Layla Al-Nakkash3
1Arizona College of Osteopathic Medicine, Midwestern University, Glendale, AZ, USA; 2Department of Pharmacology, College of Graduate Studies, Midwestern University, Downers Grove, IL, USA; 3Department of Physiology, College of Graduate Studies, Midwestern University, Glendale, AZ, USA
Correspondence: Layla Al-Nakkash
Department of Physiology, College of Graduate Studies, Midwestern University, 19555 N. 59th Avenue, Glendale, AZ 85308, USA
Tel +1 623 572 3719
Fax +1 623 572 3673
Email [email protected]
Purpose: Diabetic obesity in the leptin-deficient ob/ob mouse is associated with weight gain, and hyperglycemia, along with hyperinsulinemia. We have previously examined the effects of genistein (a naturally occurring isoflavone found in soy) on metabolic disturbances in the ob/ob mouse and demonstrated beneficial effects of genistein (600 mg genistein/kg diet, for 4-weeks) on T3 production and corticosterone status. The goal of this study was to examine whether dietary genistein could prevent, or at least lessen, the typical phenotype in this murine model of diabetic-obesity, and to assess potential sex-differences.
Patients and methods: The ob/ob mice (male and female) aged 4–5 weeks were randomly assigned to one of two diets for a period of 4-weeks: standard rodent diet, or genistein-containing diet (600 mg genistein/kg diet). Comparisons were made to a lean control group.
Results: Genistein diet significantly reduced body weight by 12% in females and 9% in males. Genistein significantly lowered serum glucose levels by 18% in females and 43% in males, yet had no effect on serum insulin. Genistein diet significantly lowered serum triglyceride levels in both ob/ob male and female mice returning them to lean levels. In females only, genistein significantly reduced serum pancreatic polypeptide levels by 56% and increased serum GIP levels 2.3-fold. Genistein had sex-dependent effects on hepatic steatosis: in females, genistein further increased the % fat area and the fat droplet diameter 2.6-fold, along with additionally increasing hepatic TBARS.
Conclusion: The results from this study indicate interesting beneficial effects of genistein diet for both male and female ob/ob mice.
Keywords: genistein, ob/ob, diabetes, phenotype
Introduction
The ob/ob leptin-deficient mouse is a commonly used murine model for diabetes and obesity. These mice are hyperglycemic, hyperinsulinemic and hyperlipidemic.1 Hypoleptinemia, while uncommon, has been reported clinically.2 In addition, humans with congenital leptin deficiencies secondary to mutations in the ob gene exhibit impaired cell-mediated immune responses, and an increased rate of infections in the absence of hypercortisolemia and hyperglycemia.3–7 In the current study we utilized ob/ob male and female mice aged 9–10 weeks, which is comparable to previous studies that have demonstrated hyperinsulinemia and hyperglycemia at this age.8,9
Genistein is a naturally occurring phytoestrogen, with a plethora of beneficial effects. The following examples highlight the usefulness of genistein as a tool to ameliorate symptoms associated with diabetes and obesity. Genistein has been shown to: (1) improve cardiac inflammation and oxidative stress in a model of streptozotocin-induced diabetic cardiomyopathy,10 (2) exhibit antioxidant and tyrosine kinase activities,11–14 (3) improve systemic glucose tolerance via enhanced expression of GLUT4 in female Zucker diabetic fatty rats (dietary administration for 17 weeks: 30–55 mg/kg/day),15 (4) reduce lipogenesis and triglyceride accumulation via increased PPAR-γ expression and improve hepatic glucose uptake in obese female Wistar rats,16 and have antiadipogenic actions, thereby playing a role in lipid metabolism.17,18 Recently, we demonstrated that genistein diet (600 mg genistein/kg diet) consumed for 4-weeks, could have beneficial effects on energy expenditure in male ob/ob mice; increasing both body temperature and serum T3 levels, with an accompanied reduction in hypercorticosteronism.19
Interestingly, the production of several intestinal peptides is known to be either altered in the obese-diabetic state or to have effects upon metabolic state. For example, over-expression of glucose-dependent insulinotropic polypeptide (GIP) in mice has been shown to reduce diet-induced obesity and steatosis and to improve glucose homeostasis.20 GIP, potentiates glucose-stimulated insulin secretion during a meal, and promotes nutrient uptake and storage. Peptide YY (PYY) and pancreatic polypeptide (PP) have effects on energy balance, indeed obese individuals have been reported to have less circulating PYY.21 Moreover, administration of gut hormones such as PYY and PP can lead to reduced food intake and weight loss.22,23 Resistin has also been linked to metabolic syndrome, and is known to play a role in promoting hepatic steatosis and hyperlipidemia in obese mice.24 Previous evidence indicates that both glucagon and PP levels are elevated in the ob/ob model.25,26 Glucagon release is modified to some extent by the type of dietary intake (suppressed by glucose intake and stimulated by protein intake) and indeed, in obese humans, glucagon levels are elevated.27 Thus, as part of this study we aimed to determine whether or not genistein’s beneficial effects were mediated, at least in part, via modulation of these intestinal peptides.
Here, we provide an assessment of the effects of consuming genistein for a period of 4-weeks on the physical characteristics, serum profile, hepatic steatosis and hepatic oxidative stress of male and female obese/diabetic ob/ob mice. We hypothesized that the diabetic obese phenotype of the ob/ob mouse would be diminished (appear more lean-like) by administration of genistein diet. Genistein significantly reduced body weight in ob/ob females and males (12–9% respectively). Genistein significantly lowered serum glucose levels in ob/ob females and males (18–43% respectively), yet had no effect on serum insulin. Genistein diet significantly lowered serum triglyceride levels in both ob/ob male and female mice returning them to lean-like levels. In females, genistein significantly reduced serum pancreatic polypeptide levels and increased serum GIP levels. Genistein had sex-dependent effects on hepatic steatosis: in females, genistein increased the % fat area and the fat droplet diameter 2.6-fold, along with further increasing hepatic TBARS. The results from this study indicate interesting beneficial effects of genistein diet for both male and female ob/ob mice on body weight, serum glucose and serum triglyceride levels.
Methods
Mice
Male and female ob/ob and lean littermate C57BL/6J mice aged 4-5-weeks were purchased from Jackson Laboratory (Bar Harbor, ME) and housed in an animal care facility with 12:12 hr light-dark cycle. Mice were randomly assigned to one of two diet groups: ob/ob mice fed either a standard rodent chow (std, ob/ob-Std), or fed a genistein-containing diet (Gen, ob/ob-Gen). Mice we compared to lean controls, fed standard rodent show (std, ln-Std). In this study we did not have a lean group that was fed genistein. The goal of the current study was first to compare lean to ob/ob both fed identical standard chow, and then second to feed ob/ob mice the genistein diet to ascertain genistein effects.
The genistein-containing diet (600 mg genistein/kg diet, Gen) was purchased from Dyets Inc. (Bethlehem, PA). The composition of the genistein diet has been published previously.28–30 Food and water were provided ad libitum. Body weight and general health were monitored weekly for the duration of the 4-week diet study period. At ~9–10-weeks of age, mice were asphyxiated in an atmosphere of 100% CO2, followed by surgical pneumothorax. At the completion of the diet study organs were harvested, immediately weighed and either frozen in liquid nitrogen for storage at −80ºC until use, or flash frozen in Optimal Cutting Temperature compound (OCT) for sectioning.
Institutional approval for the study
Animal care was conducted in accordance with established guidelines, and all protocols were approved by the Midwestern University Institutional Animal Care and Use Committee and carefully followed the National Institutes of Health’s Guide for the Care and Use of Laboratory Animals.
Histology
Freshly isolated pieces of liver were embedded and flash frozen in O.C.T. (Tissue-Tek, Torrance, CA). Oil Red O staining was performed on liver 8–10 µm sections according to the manufacturers recommendations (Abcam, Cambridge, MA).31 Assessment, using Image J Pro Premier Software (Media Cybernetics, Rockville, MD), was made of the % fat/image from images taken at 10× magnification. Averages of 3 measurements per mouse were taken and data are presented as the average of multiple mice per group.
Determination of non-protein sulfhydryls and thiobarbituric acid-reactive substances (TBARs)
Pulverized samples of frozen liver tissue were homogenized in 10 volumes of cold phosphate buffer (pH 6.8). A portion (0.4 mL) of each homogenate was drawn off and assayed for TBARs by previously published methods,32 using 1,1,3,3-tetramethoxypropane (TMP) as an external standard. Results were reported as nmoles/g tissue. For the determination of non-protein thiols, the remaining portions of the original homogenates were deproteinized by adding trichloroacetic acid to a final concentration of 5%, incubating at 0ºC for 1 hr, and centrifuging at 3000 × g for 10 mins at 4ºC. Aliquots (200 μl) of the deproteinized samples were drawn off, neutralized to pH 7.0 by the addition of 100 μl of 2 M Tris base and then reacted with 2.5 mL of 5.5’-dithio-bis (2-nitrobenzoic acid, 1.18 mg/mL) according to the method of Ellman.33 We have used this methodology in previous studies to assess oxidative stress in cardiac tissue.34
Serum measures
Serum was collected from whole blood taken from each mouse via cardiac puncture at the time of euthanasia. Serum samples were then stored at −80°C until use. For murine studies, this is a preferred method to obtain blood (and subsequently serum) at the time of euthanasia.19 Measures of serum levels of the following were obtained using commercially available assay kits (the coefficient of variation, CV, is shown where possible); glucose (Wako Diagnostics, Richmond, VA: assay has no CV data on inter- or intra-assay variation), triglycerides (Cayman Chemical, Ann Arbor, MI: intra-assay CV is 1.34% and inter-assay CV is 3.17%, with a lower detectable limit of 0.5 mg/dl) and cholesterol (Cayman Chemical, Ann Arbor, MI, USA; intra-assay variation CV is 6.4% and inter-assay variation CV is 3.4%, with a detectable range of 2–20 μm). Measures of serum levels of resistin, PYY, PP, GIP, insulin and glucagon were performed using the metabolic hormone kit Milliplex-MMHMAG-44K-07 (Millipore, Billerica, MA; intra-assay CV is <10–15% and inter-assay CV is <10–20%, with detectable ranges between 1–43 pg/mL).
Chemicals
All other chemicals were obtained from Sigma Aldrich (St. Louis, MO).
Statistics
Data are expressed as mean ± SEM. Numbers in parentheses represent numbers of tissues used from separate individual mice. One-way Anova with Neuman Keuls test or unpaired t-tests, were performed using GraphPad (San Diego, CA) and P<0.05 was considered statistically significant.
Results
Physical characteristics
At the completion of the 4-week diet study, ob/ob female mice fed genistein-supplemented diet gained ~12% less weight (P<0.05) compared to those ob/ob mice fed standard diet, Figure 1. Similarly, male ob/ob mice fed genistein diet gained ~9% less weight (P<0.05) compared to those males fed standard diet, Figure 1. Measures of heart and liver weights at the end of the diet study are shown in Table 1. Liver weight normalized to body weight was significantly increased in the ob/ob males and females and subsequently changed by genistein diet in females. Total abdominal fat pat weight was significantly reduced by ~1 g with genistein diet in female ob/ob mice, whereas male ob/ob mice tended to have a greater variability in fat pad mass (Table 1).
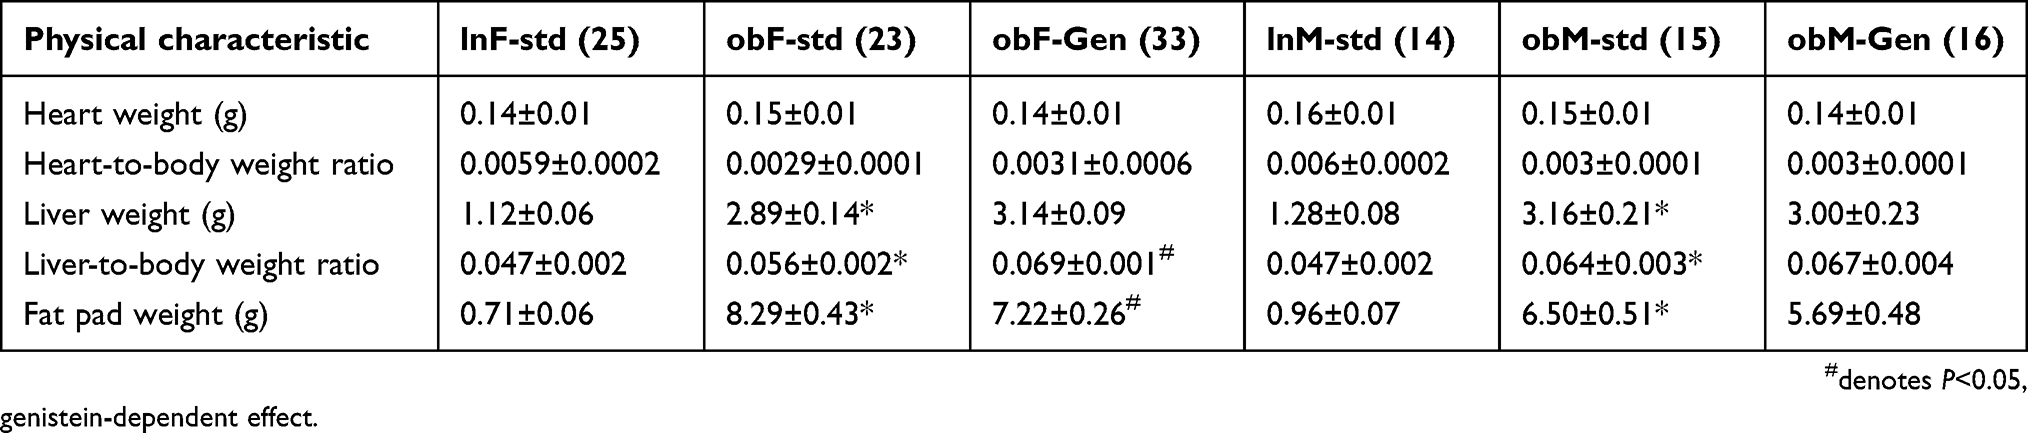 |
Table 1 The effects of a 4-week genistein diet treatment period on physical characteristics of ob/ob female and male mice |
Serum profile
Typical for the ob/ob model of diabetic obesity, serum glucose levels (Figure 1C) were significantly elevated in ob/ob females (476.7±15.2 mg/dL, n=11, P<0.05) compared to lean controls (240.6±8.1 mg/dL, n=13), and genistein diet significantly reduced glucose levels by 18% (to 389.1±39.7 mg/dL, n=11, P<0.05). Serum glucose levels were similarly elevated in ob/ob males (604.0±56.2 mg/dL, n=7, P<0.05) compared to leans (259.6±18.7 mg/dL, n=6), and genistein diet significantly reduced glucose levels 43% (to 345.8±21.1 mg/dL, n=7, P<0.05). In addition, and characteristic for the ob/ob model, serum insulin levels (Figure 1D) were significantly elevated in ob/ob females (8244.0±1131.7 pg/mL, n=6, P<0.05) compared to leans (1284.6±377.4 pg/mL, n=6). Serum insulin was similarly significantly increased in ob/ob males (7387.4±266.8 pg/mL, n=5, P<0.05) compared to leans (1987.3±402.3 pg/mL, n=6). Interestingly, genistein diet had no effect on insulin levels for either sex.
Serum triglyceride (TG) levels were significantly increased in ob/ob mice compared to lean counterparts (Figure 2A): ob/ob females, 257.74±26.07 mg/dL (n=6, P<0.05) versus leans 103.49±7.64 mg/dL (n=6) and ob/ob males 227.50±30.76 mg/dL (n=6, P<0.05) versus leans 123.22±18.42 mg/dL (n=6). Genistein significantly lowered levels of triglycerides in all ob/ob mice returning levels to that of leans (Figure 2A): in ob/ob females TG levels were reduced by 73% (to 94.74±6.73 mg/dL, n=7, P<0.05), and in ob/ob males TG levels were reduced by 70% (to 67.31±5.39 mg/dL, n=7, P<0.05). Serum cholesterol levels were significantly increased in ob/ob mice compared to leans (Figure 2B): ob/ob females 163.07±9.53 mg/dL (n=14, P<0.05) versus leans 59.71±3.04 mg/dL (n=13) and ob/ob males 186.63±14.20 mg/dL (n=7, P<0.05) versus leans 95.96±7.17 mg/dL (n=6). Interestingly, genistein significantly further increased levels of cholesterol in all ob/ob mice (Figure 2B): genistein increased cholesterol levels in ob/ob females 1.58-fold (to 258.24±13.83 mg/dL, n=14, P<0.05), and in ob/ob males 1.71-fold (to 319.18±29.31 mg/dL, n=7, P<0.05).
Serum levels of a series of five metabolic markers are shown in Figure 3. Both sexes of ob/ob mice had increased levels of serum pancreatic polypeptide, PP, compared to leans (Figure 3A): ob/ob females 33.22±9.37 pg/mL (n=6, P<0.05) versus leans 6.75±1.29 pg/mL (n=6), and ob/ob males 48.54±13.69 pg/mL (n=6, P<0.05) versus leans 18.67±6.90 pg/mL, (n=6). Genistein significantly lowered levels of PP in ob/ob females by 56% (to 14.59±4.41 pg/mL, n=7, P<0.05), but had no effect in males (although there is trending decrease). Serum peptide YY (PYY), levels were significantly increased in both sexes of ob/ob mice compared to leans (Figure 3B): ob/ob females 66.89±6.78 pg/mL (n=6, P<0.05) versus leans 49.34±4.08 pg/mL (n=6), and ob/ob males 87.99±4.63 pg/mL (n=6, P<0.05) versus leans 30.01±11.15 pg/mL (n=6). Genistein diet was without effect. Serum resistin levels were significantly increased 1.72-fold in male ob/ob mice (7904.00±290.78 pg/mL, n=6, P<0.05) compared to leans (4569.60±801.29 pg/mL, n=6, Figure 3C). Genistein diet further significantly increased resistin levels 1.48-fold in ob/ob males (11,684.00±809.88 pg/mL, n=7, P<0.05). Serum resistin levels were comparable within all female groups. Serum glucagon levels were significantly increased 7-fold in female ob/ob mice (175.57±27.08 pg/mL, n=6, P<0.05) compared to leans (25.08±8.68 pg/mL, n=6, Figure 3D), and genistein diet was without effect. Glucagon levels were comparable within all male groups. Serum GIP levels were comparable in both sexes of ob/ob mice compared to lean counterparts (Figure 3E). Genistein diet significantly increased GIP levels by 2.3-fold in ob/ob females (from 258.79±47.37 pg/mL (n=6), to 5584.21±73.14 pg/mL (n=7), P<0.05). While GIP levels were statistically comparable between all male groups of mice, genistein diet trended to increase serum GIP levels.
Evaluation of liver steatosis using oil-red O staining indicated sex-dependent effects of genistein (Figure 4). As expected, both female and male ob/ob mice had a significantly greater % hepatic fat area compared to lean controls (Figure 4B): ob/ob females 14.20±2.37% (n=15, P<0.05) versus female leans 3.42±0.90% (n=11) and ob/ob males 20.81±1.54% (n=16, P<0.05) versus male leans 2.64±1.06% (n=9). Genistein diet further significantly increased the hepatic % fat content in ob/ob females 2.6-fold (to 36.87±3.40%, n=14), yet was without effect in ob/ob males (16.67±1.47%, n=19). The average fat droplet area followed a similar pattern (Figure 4C), a significant increase in droplet size in the ob/ob females (74.76±16.78 µm2, n=15) and ob/ob males (36.72±3.09 µm2, n=16) compared to their respective leans. Droplet size was further increased in the genistein-fed ob/ob females (402.59±122.17 µm2, n=14). Similarly, the median droplet diameter followed the same profile: significantly increased in ob/ob females 5.77±0.56 µm (n=15, P<0.05) versus lean controls 1.17±0.10 µm (n=11) and increased in ob/ob males 3.97±0.20 µm (n=16, P<0.05) versus lean controls 1.68±0.35 µm (n=9). Genistein diet further significantly increased the droplet median diameter in ob/ob females 2.6-fold (to 14.78±2.61 µm, n=14).
Hepatic oxidative stress as measured by non-protein sulfhydryls (Figure 5A), indicated sex-dependent differences: ob/ob females fed standard chow (6.78±0.70 μmoles/g, n=6) exhibited comparable levels to lean controls (7.13±0.52 μmoles/g, n=6) and genistein diet was without effect (8.18±0.47 μmoles/g, n=5), whereas ob/ob males had significantly elevated levels of non-protein sulfhydryls (10.05±0.73 µmoles/g, n=4, P<0.05) compared to leans (7.46±0.65 µmoles/g, n=5). Interestingly, genistein was without effect in male mice also (10.73±0.36 μmoles/g, n=10). Hepatic oxidative stress as measured by thiobarbituric acid-reactants (TBARS (Figure 5B), indicated diabetes-related oxidative stress: ob/ob females had significantly elevated levels of TBARS (124.70±25.32 nmoles/g, n=6, P<0.05) compared to leans (51.64±5.45 nmoles/g, n=5)., and ob/ob males had significantly elevated levels of TBARS (125.80±44.86 nmoles/g, n=4, P<0.05) compared to leans (52.33±10.27 nM/g, n=6). Interestingly, genistein significantly exacerbated TBAR levels in ob/ob females 1.54-fold (to 192.76±20.95 nmoles/g, n=5, P<0.05), but was without effect in ob/ob males (202.65±15.35 nmoles/g, n=8).
Discussion
The ob/ob mouse is hyperphagic, obese, hyperglycemic and insulin resistant.9,35 Estrogens are known to influence adipocyte mass mediated by estrogen receptor dependent activation.36 Not surprisingly, isoflavonic phytoestrogens such as genistein have similar effects to estrogen. Genistein has been shown to, (a) decrease adipose deposition (fat pad weight) in ovariectomized mice prone to metabolic syndrome,37 (b) inhibit adipose deposition and increase adipocyte mass in lean female mice,36 and (c) increase epididymal fat pad weight, renal fat pad weight and adipocyte size in lean males but not females,17 along with reducing plasma triglyceride levels ~50%.17 Our data fit with those previously published studies using ovariectomized mice, indicating a genistein-mediated decrease in fat pad weight in females (with a similar trend in males).
We predicted that fat pad weight would correlate with liver steatosis and serum TG and cholesterol levels. This is important since ob/ob mice as old as 10 weeks typically show severe hepatic steatosis compared to age-matched leans, which show minimal to nil steatosis.38 Here, we provide evidence that a genistein-mediated significant reduction in fat pad weight in females was associated with decreased serum TG (not cholesterol), but with an increase in hepatic steatosis. Our data also indicated that genistein was without effect on fat pad weight in males, yet was associated with a similar decrease in serum TG (not cholesterol), and no effect in hepatic steatosis, thus suggesting these parameters are not necessarily linked and likely genistein mediates different sex-dependent tissue pathways. It is possible that potential genistein-mediated beneficial effects on hepatic steatosis could be noted with longer duration of genistein exposure (8 or 12-weeks versus 4-weeks diet study). Other potential explanations for the genistein-mediated effects could include the following; (1) a metabolomic analysis of obesity indicated sex-dependent differences in ob/ob mice, in male mice obesity was associated with insulin signaling, whereas in female mice obesity was associated with lipid metabolism,39 (2) effects on adiposity could involve modifications in adipocyte genes that are regulated by estrogen, eg monocyte chemoattractant protein-1 and androgen receptor genes,40 and (3) alterations in the regulation of estrogen receptor-ERα in the hypothalamic arcuate nucleus via circulating estrogen and/or genistein (ERα expression is key to maintain body weight and adiposity).41
Hepatic steatosis in ob/ob mice has been shown to be associated with increased oxidative stress, as demonstrated via an elevated production of ROS.42 Here we demonstrate that ob/ob mice had increased TBARS (compared to leans) suggesting significant lipid peroxidation, and genistein diet further exacerbated this in females. Glutathione is an antioxidant involved in scavenging ROS,43 and we demonstrate increased glutathione levels ob/ob males, and note that genistein has no effect.
Of interest relating to the treatment of obesity are a series of gut-derived hormones, ie peptide YY (PYY) and pancreatic polypeptide (PP), since both have known effects on energy balance and food intake.44 Serum levels of PYY have been shown to be reduced with obesity,21 and enhancement of PYY levels has been shown to be associated with improvements in glucose homeostasis presumably via effects on the hypothalamo-pituitary-thyroid axis.45 Our data demonstrating that PYY levels were increased in the ob/ob mice are in contrast to those previous findings, moreover, we note that genistein had no effect on PYY levels. Our data fit with past observations that both glucagon and pancreatic polypeptide levels are increased in the ob/ob model,25 and interestingly genistein reduced PP levels in females (with a similar trend in males).
Resistin is purported to play a role in promoting hepatic steatosis and hyperlipidemia in obese mice, indeed resistin deficiency has been shown to exaggerate the obese state of ob/ob mice, yet reduce hepatic steatosis.24 Singhal et al noted that resistin levels were increased in the ob/ob mouse, which is comparable with our male data shown here (1.72-fold increase in resistin levels in the ob/ob male mice compared to leans). Here, we also find that genistein-diet further elevated circulating resistin levels in male ob/ob mice (no change in in females), which could explain, at least in part, the decrease in fat pad weight in males, via a resistin-mediated inhibition of adipogensis,46 and in addition, this could be a mechanism for the lack of further hepatic steatosis seen in male ob/ob mice. In females, serum resistin levels were unchanged by genistein diet, and interestingly hepatic steatosis was further evident (increased % fat area and fat droplet size, with concomitant increased levels of TBARS). We find that circulating glucagon levels are increased in the ob/ob females (with a similar trend in males), and genistein had no effect. Experiential effects of GIP on obesity and diabetes are inconsistent; while GIP has been shown to reduce diet-induced obesity and steatosis and to improve glucose homeostasis in mice,20 in contrast, others have shown that ob/ob mice become obese and insulin resistant regardless of GIP presence.47 Our data suggests that the diabetic obese state does not alter GIP production, and that genistein diet induces an increase in GIP production correlating with weight loss and decreased glucose levels in females. We find similar trends in males.
Typically, insulin resistance enhances free fatty acid (FFA) secretion due to increased lipolysis from peripheral adipose tissue.48 This in turn, results in increased hepatic uptake of FFA, which are then converted into TG’s.49 Our data suggest that genistein-mediated improvements in serum levels of TG’s in ob/ob male and female mice could be attributed to decreased adipose lipolysis, and/or decreased hepatic uptake of FFA’s, and/or increased hepatic adipose storage in females. Inhibition of the intestinal bile acid transporter, Slc10a2, has been shown to improve triglyceride metabolism, and normalize plasma glucose and insulin levels in ob/ob male mice.50 Whether or not genistein-mediated benefits on the ob/ob phenotype in the current study, ie decreasing glucose levels by 18–43% and reducing triglyceride levels by 70–73%, are mediated via effects on the Slc10a2 (at least in part) remains to be seen.
In conclusion, this study compares the effects of genistein and sex differences on the diabetic-obese phenotype of the ob/ob mouse. We find that in female ob/ob mice, genistein supplementation results in: decreased weight gain, decreased serum TG and PP, increased hepatic steatosis and hepatic TBARS, whereas in ob/ob males genistein supplementation results in: decreased weight gain, decreased serum TG and increased resistin, and increased hepatic TBARS. Future studies are needed to examine and elucidate specific sex-dependent mechanisms of action.
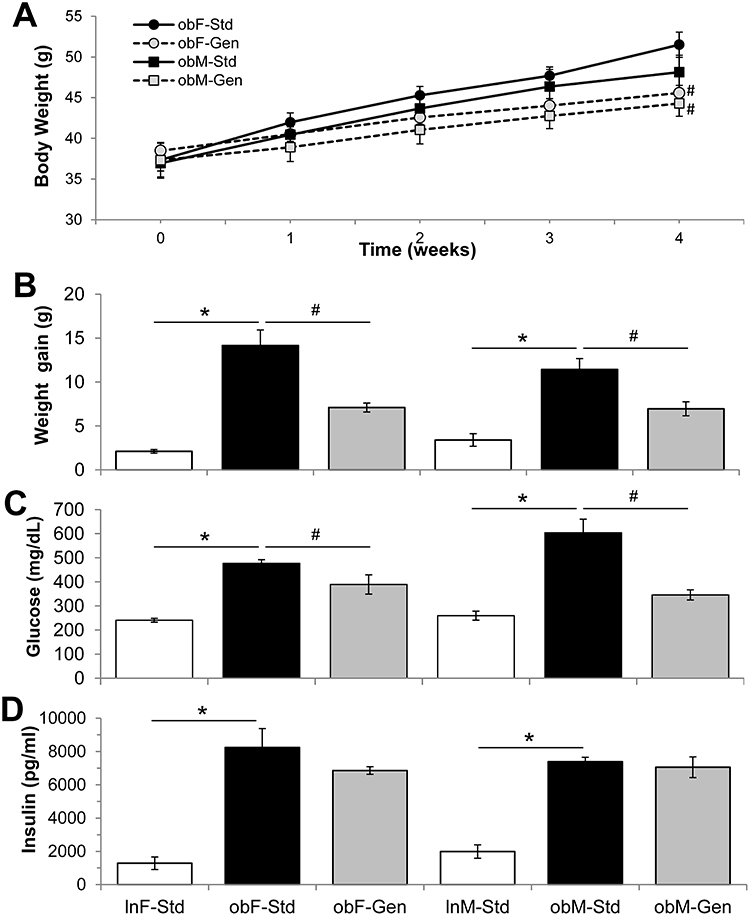 |
Figure 1 Effect of genistein on body weight, serum glucose and insulin levels. (A) Average body weight of ob/ob mice. Average weights of ob/ob mice taken at each week of the 4-week diet is shown. Fed standard diet (Std, solid lines and solid markers) and genistein diet (Gen, dotted lines and gray markers). (B) Average weight gain. Weight gain over the 4-week diet study is shown: ob/ob mice (solid bars) gained significantly more weight than lean controls (open bars), and genistein diet (gray bars) significantly reduced weight gain (n=14–33). (C) Average serum glucose. Serum glucose levels taken at the end of the 4-week study are shown: ob/ob mice (solid bars) had significantly higher glucose levels than lean controls (open bars), and genistein diet (gray bars) significantly reduced serum glucose (n=6–13). (D) Average serum insulin. Serum insulin levels taken at the end of the 4-week study are shown: ob/ob mice (solid bars) had significantly higher insulin levels than lean controls (open bars), and genistein diet (gray bars) was without effect (n=5–6). Values are mean ± SEM *denotes significant difference to leans P<0.05 and #denotes significant genistein mediated effect P<0.05. |
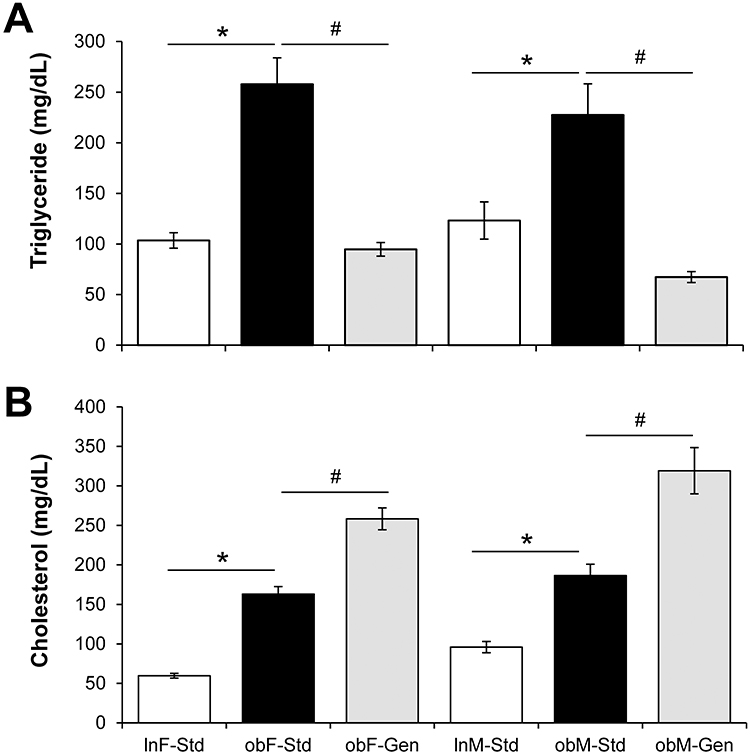 |
Figure 2 Effect of genistein on serum trigylceride and cholesterol levels. (A) Triglyceride. Serum triglyceride levels were significantly elevated in ob/ob mice (solid bars) compared to leans (open bars). Genistein diet (gray bars) significantly reduced triglyceride levels. n=6–7. (B) Cholesterol. Serum cholesterol levels were significantly elevated in ob/ob mice (solid bars) compared to leans (open bars), and genistein diet further increased levels (gray bars). n=6–14. Values are mean ± SEM. *denotes significant difference from lean, P<0.05 and #denotes significant genistein-mediated effect P<0.05. |
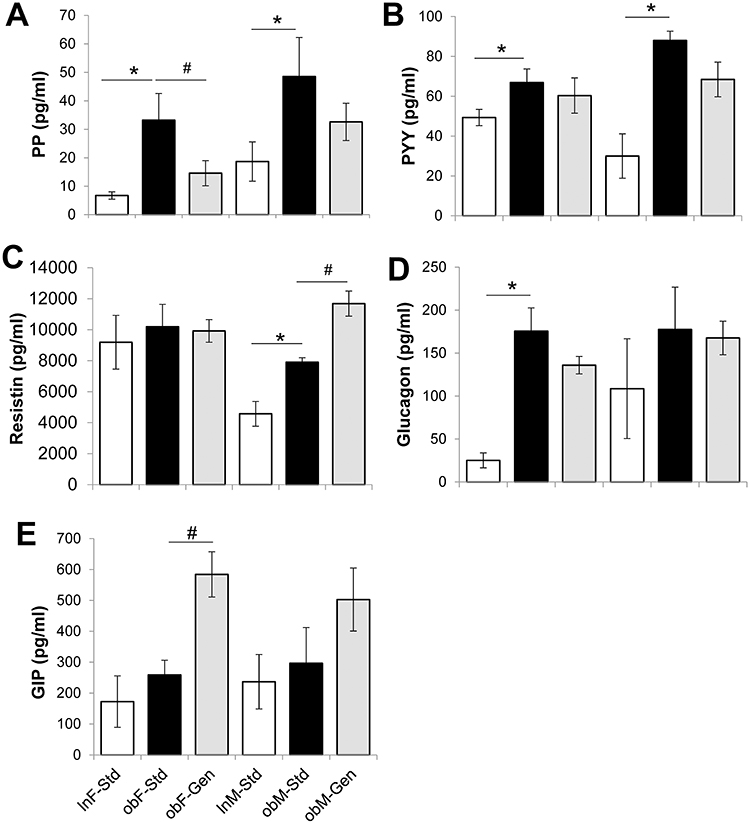 |
Figure 3 Effect of genistein on serum markers of metabolism. (A) PP. Pancreatic polypeptide, PP, levels were significantly elevated in the ob/ob control groups. Genistein diet reversed this in females. (B) PYY. Peptide YY, PYY, levels were significantly elevated in the ob/ob control groups. Genistein had no effect. (C) Resistin. Resistin levels were comparable in all female groups. In males, resistin levels were significantly elevated in the ob/ob controls, and genistein diet further increased this. (D) Glucagon. Glucagon levels were significantly elevated in the ob/ob control females. Genistein had no effect. Glucagon levels were comparable in all male groups. (E) GIP. GIP levels were unchanged in the ob/ob groups versus lean controls. Genistein diet further increased GIP in ob/ob females. Lean mice fed standard-diet (gray bar), ob/ob mice fed standard-diet (open bar), and ob/ob mice fed genistein-diet (solid bar). n=6–7. Values are mean ± SEM *denotes significant difference to leans P<0.05 and #denotes significant genistein mediated effect P<0.05. |
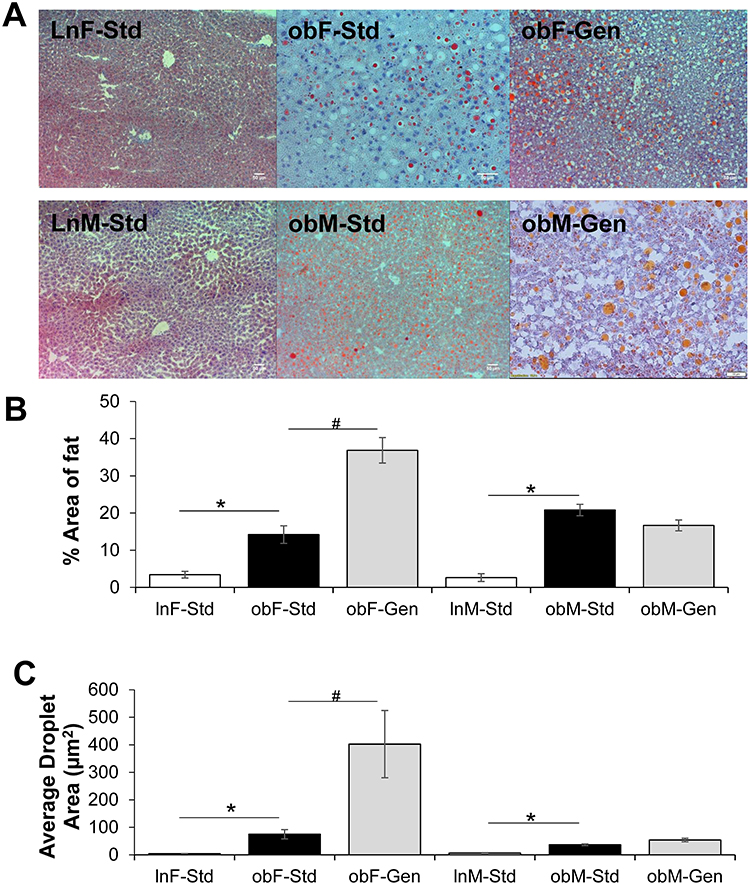 |
Figure 4 Effect of genistein on hepatic steatosis. (A) Representative images of hepatic sections stained with Oil-Red-O, for each of the groups. All images are at 10X. scale bar is 50 µm. (B) Percentage fat in liver. The % fat/liver section increased in ob/ob mice (solid bars), compared to leans (open bars). Genistein diet further increased % fat/liver section in female ob/ob mice, and was without effect in males (gray bars). (C) Average droplet area in liver. The average droplet area increased in ob/ob mice (solid bars), compared to leans (open bars) and genistein diet further increased droplet area in female ob/ob mice, and was without effect in males (gray bars). n=9–16. Values are mean ± SEM. *denotes significant difference from lean, P<0.05 and #denotes significant genistein-mediated effect P<0.05. |
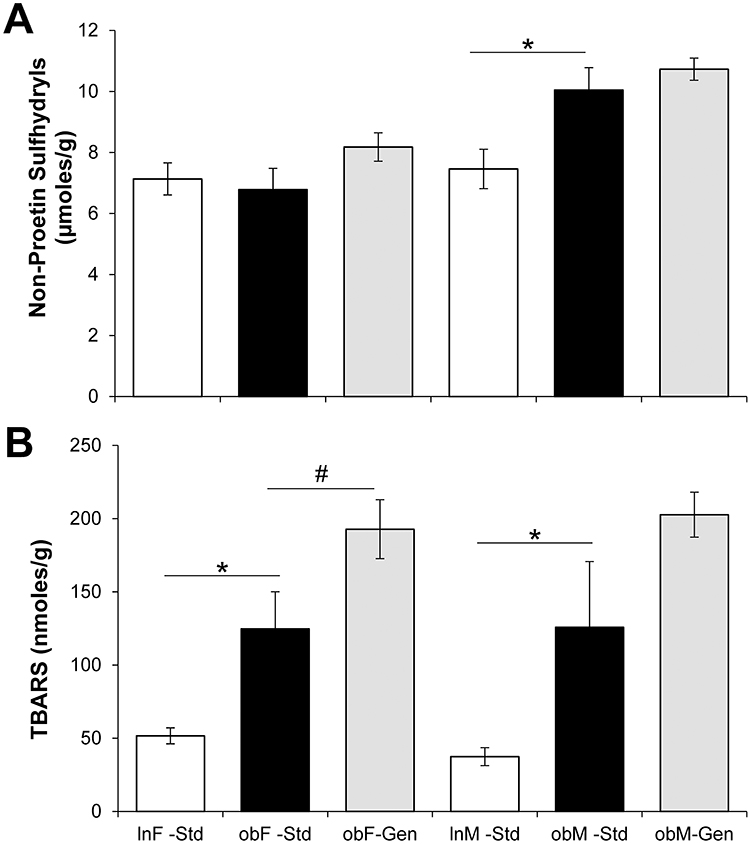 |
Figure 5 Effect of genistein on hepatic glutathione and TBARS. (A) Glutathione. Hepatic glutathione levels were increased in male ob/ob mice (solid bars) compared to leans (open bars). Genistein diet increased glutathione levels in females (gray bars). n=4–10. (B) TBARS. Hepatic TBARS were increased in male and female ob/ob mice (solid bars) compared to leans (open bars). Genistein diet increased glutathione levels in females (gray bars). n=4–8. Values are mean ± SEM. *denotes significant difference from lean, P<0.05 and #denotes significant genistein-mediated effect P<0.05. |
Acknowledgments
Schuyler Rockwood was supported through the Department of Biomedical Sciences, College of Health Sciences and the MWU Summer Research Fellowship. This work was supported by Midwestern University Intramural funds (to LA) and Diabetes Action and Research Education Foundation (to LA). We thank Mr. Tatum Banayat for helpful technical assistance.
Disclosure
The authors report no conflicts of interest in this work.
References
1. Halaas JL, Gajiwala KS, Maffei M, et al. Weight-reducing effects of the plasma protein encoded by the obese gene. Science. 1995;28:543–546. doi:10.1126/science.7624777
2. Roden M, Ludwig C, Nowotny P, et al. Relative hypoleptinemia in patients with type 1 and type 2 diabetes mellitus. Int J Obes. 2000;24:976–981. doi:10.1038/sj.ijo.0801266
3. Ozata M, Ozdemir IC, Licinio J. Human leptin deficiency casused by a missence mutation: multiple endocrine defects, decreased sympathetic tone, and immune system dysfunction indicate new targets for leptin action, greater central than peripheral resistance to the effects of leptin, and spontaneous correction of leptin-mediated defects. J Clin Endo Metab. 1999;84:3686–3695.
4. Montague CT, Farooqi IS, Whitehead JP, et al. Congenital leptin deficiency is associated with severe early-onset obesity in humans. Nature. 1997;387:903–908. doi:10.1038/43185
5. Larcher F, Del Rio M, Serrano F, et al. A cutaneous gene therapy approach to human leptin deficiences: correction of the murine ob/ob phenotype using leptin-targeted keratinocyte grafts. Faseb J. 2001;15:1529–1538. doi:10.1096/fj.01-0082com
6. Valerio CM, Zajdenverg L, Do Oliveira JE, Mory PB, Moyses RS, Godoy-Matos AF. Body composition study by dual-energy x-ray absorpiometry in familial partial lipodystrophy: finding new tools for an objective evaluation. Diabetol Metab Syndr. 2012;4:40. doi:10.1186/1758-5996-4-40
7. Meehan CA, Cochran E, Kassai A, Brown RJ, Gorden P. Metreleptin for injection to treat the complications of leptin deficiency in patients with congenital or acquired generalized lipodystrophy. Expert Re Clin Pharmacol. 2016;9:59–68. doi:10.1586/17512433.2016.1096772
8. Bhetwal BP, An C, Baker SA, Lyon KL, Perrino BA. Impaired contractile responses and latered protein expression and phosphorylation of Ca2+ sensitization proetins in gastric antrum smooth muscles from ob/ob mice. J Muscle Res Cell Motil. 2013;34:137–149. doi:10.1007/s10974-013-9341-1
9. Leung L, Kang J, Rayyan E, et al. Decreased basal chloride secretion and altered CFTR, villin and GLUT5 protein expression in jejunum from ob/ob mice. Diabetes Metab Syndrome Obesity. 2014;7:1–10.
10. Gupta SK, Dongare S, Mathur R, et al. Genistein ameliorates cardiac inflammation and oxidative stress in streptozotocin-induced diabetic cardiomyopathy in rats. Mol Cell Biochem. 2015;408:63–72. doi:10.1007/s11010-015-2483-2
11. Akiyama T, Ishida J, Nakagawa S, et al. Genistein a specific inhibitor of tyrosine-specific protein kinase. J Biol Chem. 1987;262:5592–5595.
12. Vanden BNL, Novotny NI, Bohl L, et al. Soy genistein administered in soluble chitosan microcapsules maintains antioxidant activity and limits intestinal inflammation. J Nutr Biochem. 2018;62:50–58. doi:10.1016/j.jnutbio.2018.08.009
13. Rahman Mazumder MA, Hongsprabhas P. Genistein as antioxidant and antibrowning agents in in vivo and in vitro: a review. Biomed Pharmacother. 2016;379–392. doi:10.1016/j.biopha.2016.05.023
14. Braxas H, Frafraf M, Karimi Hasanabad S, Ashari Jafarabad M. Effectiveness of genistein supplementation on metabolic factors and antioxidant status in postmenopausal women with type 2 diabetes mellitus. Can J Diabetes. 2019;S1499–S2671:30983.
15. Weigt C, Hertrampf T, Flenker U, et al. Effects of estradiol, estrogen receptor subtype-selective agonists and genistein on glucose metabolism in leptin resistant female Zucker diabetic fatty (ZDF) rats. J Steroid Biochem Mol Biol. 2015;154:12–22. doi:10.1016/j.jsbmb.2015.06.002
16. Weigt C, Hertrampf T, Kluxen FM, et al. Molecular effects of ER-alpha- and beta-selective agonists on regulation of energy homeostasis in obese female Wistar rats. Mol Cell Endocrinol. 2013;377:147–158. doi:10.1016/j.mce.2013.07.007
17. Penza M, Montani C, Romani A, et al. Genistein affects adipose tissue deposition in a dose-dependent and gender-specific manner. Endocrinology. 2006;147:5740–5751. doi:10.1210/en.2006-0365
18. Ahmed B, Liu S, Si H. Antiadipogenic effects and mechanisms of combinations of genistein, epigallocatechin-3-Gallate, and/or resveratrol in preadipocytes. J Med Food. 2017;20:162–170. doi:10.1089/jmf.2016.0115
19. Rockwood SS, Broderick TB, Al-Nakkash L. Feeding obese diabetic mice a genistein diet induces thermogenic and metabolic change. J Medicinal Food. 2018;21:332–339. doi:10.1089/jmf.2017.0084
20. Kim SJ, Nian C, Karunakaran S, Clee SM, Isales CM, McIntosh CHS. GIP-overexpressing mice demonstrate reduced diet-induced obesity and steatosis, and improved gluocse homeostasis. PLoS One. 2012;7:e40156. doi:10.1371/journal.pone.0040156
21. Batterham RL, Cohen MA, Ellis SM, et al. Inhibition of food intake in obese subjects by peptide YY3-36. N Engl J Med. 2003;349:941–948. doi:10.1056/NEJMoa030204
22. Simpson K, Parker J, Plumer J, Bloom S. CCK, PYY, and PP: the control of energy balance. Handbook of Exp Pharmacol. 2012;209:209–230.
23. Mishra AK, Dubey V, Ghosh AR. Obesity: an overview of possible role(s) of gut hormones, lipid sensing and gut microbiota. Metabolism. 2016;65:48–65. doi:10.1016/j.metabol.2015.10.008
24. Singhal NS, Patel RT, Qi Y, Lee Y-S, Ahima RS. Loss of resistin ameliorates hyperlipidemia and hepatic steatosis in leptin-deficient mice. Am J Physiol. 2008;295:E331–E338.
25. Tomita T, Doull V, Kimmel JR, Pollock HG. Pancreatic polypeptide and other hormones in pancreas of obese (ob/ob) mice. Diabetologica. 1984;27:454–459. doi:10.1007/BF00273910
26. O’Harte FP, Franklin ZJ, Irwin N. Two novel glucagon receptor agonists prove effective therapeutic agents in high-fat-fed and obese diabetic mice. Diabetes Obes Metab. 2014;16:1214–1222. doi:10.1111/dom.12360
27. Manell H, Staaf J, Manukyan L, et al. Altered plasma levels of glucagon, GLP-1 and glicentin during OGTT in adolescents with obesity and type 2 diabetes.. J Clin Endo Metab. 2016;101:1181–1189. doi:10.1210/jc.2015-3885
28. Al-Nakkash L, Clarke LL, Rottinghaus GE, Chen YJ, Cooper K, Rubin LJ. Dietary genistein stimulates anion secretion across female murine intestine. J Nutr. 2006;136:2785–2790. doi:10.1093/jn/136.11.2785
29. Al-Nakkash L, Martin JB, Petty D, et al. Dietary genistein induces sex-dependent effects on murine body weight, serum profiles, and vascular function of thoracic aortae. Gender Med. 2012;9:295–308. doi:10.1016/j.genm.2012.07.001
30. Al-Nakkash L, Martin JB, Cannon J, Bhakta A, Leung L, Broderick TB. A 2-month exposure to dietary genistein has sex-dependent effects on serum profile, cardiac protein expresssion, and aortic morphology in mice. Nutr Dietary Suppl. 2014;6:15–23. doi:10.2147/NDS.S57602
31. Zhu X, Bian H, Wang L, et al. Berberine attenuates nonalcoholoc hepatic steatosis through the AMPK-SREBP-1c-SCD1 pathway. Free Radical Biol Med. 2019;141:192–204. doi:10.1016/j.freeradbiomed.2019.06.019
32. Ohkawa H, Ohishi N, Yagi K. Assay for lipid peroxides in animal tissues by thiobarbituric acid reaction. Analyt Biochem. 1979;95:351–358. doi:10.1016/0003-2697(79)90738-3
33. Ellman GL. Tissue sulfhydryl groups. Arch Biochem Biophys. 1959;82:70–77. doi:10.1016/0003-9861(59)90090-6
34. Al-Nakkash L, Janjulia T, Peterson K, et al. Genistein and exercise do not improve cardiovascular risk factors in the ovariectomized rat. Climacteric. 2014;17:136–147. doi:10.3109/13697137.2013.804503
35. Zhang YR, Proenca M, Maffei M, Barone M, Leopold L, Firiedman JM. Positional cloning of the mouse obese gene and its human homologue. Nature. 1994;372:425–432. doi:10.1038/372425a0
36. Cooke PS, Naaz A. Role of estrogens in adipocyte development and function. Exp Biol Med. 2004;229:1127–1135. doi:10.1177/153537020422901107
37. Naaz A, Yellayi S, Zakroczymski MA, et al. The soy isoflavone genistein decreases adipose deposition in mice. Endocrinology. 2003;144:3315–3320. doi:10.1210/en.2003-0076
38. Chu MJJ, Hickey AJR, Tagaloa S, et al. ob/ob mouse livers show decreased oxidative phosphorylation efficiencies and anaerobic capacities after cold ischemia.. PLoS One. 2014;9:1–10. doi:10.1371/journal.pone.0100609
39. Won EY, Yoon MK, Kim SW, et al. Gender-specific metabolomic profiling of obesity in leptin-deficient ob/ob mice by 1H NMR spectroscopy. PLoS One. 2013;8:e75998. doi:10.1371/journal.pone.0075998
40. Shinozaki S, Chiba T, Kokame K, et al. Site-specific effect of estradiol on gene expression in the adipose tissue of ob/ob mice. Horm Metab Res. 2007;39:192–196. doi:10.1055/s-2007-970417
41. Chakraborty S, Sachdev A, Salton SR, Chakraborty TR. Stereological analysis of estrogen receptor expression in the hypothalamic arcuate nucleus of ob/ob and agouti mice. Brain Res. 2008;1217:86–95. doi:10.1016/j.brainres.2008.04.031
42. Yang S, Zhu H, Li Y, et al. Mitochondrial adaptatins to obesity-related oxidant stress. Arch Biochem Biophys. 2000;378:259–268. doi:10.1006/abbi.2000.1829
43. Townsend DM, Tew KD, Tapiero H. The importance of glutathione in human disease. Biomed Pharmacother. 2003;57:145–155. doi:10.1016/S0753-3322(03)00043-X
44. Ueno H, Inui A, Iwamoto M, et al. Decreased food intake and body weight in pancreatic polypeptide over-expressing mice. Gastroenterology. 1999;117:1427–1432. doi:10.1016/S0016-5085(99)70293-3
45. Boey D, Lin S, Enriquez RF, et al. PYY transgenic mice are protected against diet-induced and genetic obesity. Neuropeptides. 2008;42:19–30. doi:10.1016/j.npep.2007.11.003
46. Kim K-H, Zhao L, Moon Y, Kang C, Sul S. Dominant inhibitory adipocyte-specific secretory factor (ADSF)/resistin enhances adipogenesis and improves insulin sensitivity. PNAS USA. 2004;101:6780–6785. doi:10.1073/pnas.0305905101
47. Shimazu-Kuwahara S, Harada N, Yamane S, et al. Attenuated secretion of glucose-dependent insulinotropic polypeptide (GIP) does not alleviate hyperphagic obesity and insulin resistance in ob/ob mice. Mol Metab. 2017;6:288–294. doi:10.1016/j.molmet.2017.01.006
48. Jensen MD, Haymond MW, Rizza RA, Cryer PE, Miles JM. Influence of body fat distribution on free fatty acid metabolism in obesity. J Clin Invest. 1989;83:1168–1173. doi:10.1172/JCI113997
49. Donnelly KL, Smith CI, Schwarzenberg SJ, Jessurun J, Boldt MD, Parks EJ. Sources of fatty acids stored in liver and secreted via lipoproteins in patients with nonalcoholic fatty liver disease. J Clin Invest. 2005;115:1343–1351. doi:10.1172/JCI23621
50. Lundasen T, Andersson E-M, Snaith M, et al. Inhibition of intestinal bile acid transporter Slc10a2 improves triglyceride metabolism and normalizes elevated plamsa glucose levels in mice. PLoS One. 2012;7:1–14. doi:10.1371/journal.pone.0037787
 © 2019 The Author(s). This work is published and licensed by Dove Medical Press Limited. The
full terms of this license are available at https://www.dovepress.com/terms
and incorporate the Creative Commons Attribution
- Non Commercial (unported, 3.0) License.
By accessing the work you hereby accept the Terms. Non-commercial uses of the work are permitted
without any further permission from Dove Medical Press Limited, provided the work is properly
attributed. For permission for commercial use of this work, please see paragraphs 4.2 and 5 of our Terms.
© 2019 The Author(s). This work is published and licensed by Dove Medical Press Limited. The
full terms of this license are available at https://www.dovepress.com/terms
and incorporate the Creative Commons Attribution
- Non Commercial (unported, 3.0) License.
By accessing the work you hereby accept the Terms. Non-commercial uses of the work are permitted
without any further permission from Dove Medical Press Limited, provided the work is properly
attributed. For permission for commercial use of this work, please see paragraphs 4.2 and 5 of our Terms.