Back to Journals » Diabetes, Metabolic Syndrome and Obesity » Volume 11
Genistein diet does not modify crypt morphology in the ob/ob mouse jejunum: a comparison of cryostat and clearing techniques
Authors Sandoval-Skeet N, Kaufman JA ![]() , Castro MJ
, Castro MJ ![]() , Al-Nakkash L
, Al-Nakkash L ![]()
Received 3 August 2018
Accepted for publication 19 October 2018
Published 29 November 2018 Volume 2018:11 Pages 863—873
DOI https://doi.org/10.2147/DMSO.S182501
Checked for plagiarism Yes
Review by Single anonymous peer review
Peer reviewer comments 3
Editor who approved publication: Dr Steven F. Abcouwer
Supplementary video 3D reconstruction of optically cleared jejunum stained with DAPI
Views: 84
Noemy Sandoval-Skeet,1 Jason A Kaufman,2 Monica J Castro,2 Layla Al-Nakkash3
1Department of Biomedical Sciences, 2Department of Anatomy, 3Department of Physiology, Midwestern University, Glendale, AZ 85308, USA
Introduction: Diabetes is commonly associated with gastrointestinal dysfunction. We have previously shown that transepithelial short circuit current, Isc (chloride secretion), is significantly reduced in the jejunum from ob/ob mice vs lean controls, and consumption of 600 mg genistein/kg of diet (600 G) for 4 weeks significantly rescues Isc. We aimed to evaluate whether morphological changes in the jejunal crypts contribute to the rescue of Isc.
Methods: Male mice (ob/ob and lean controls) were fed either a genistein-free diet or genistein-containing diet (600 G). Comparisons of crypt morphology were made for crypt depth, length, and numbers of proliferative cells. Assessments of crypt measures using DAPI and 5-ethynyl-2′-deoxyuridine (EdU) were performed using traditional cryostat sectioning and an innovative 3D optical clearing method.
Results: We found that crypt length in the ob/ob genistein-fed group was significantly greater when measured with cleared tissue (85.19±4.73 µm, P<0.05, n=8) compared to lengths measured with cryostat (65.42±3.48 µm, n=8). In addition, proliferative EdU+ counts were approximately fivefold greater with clearing, compared to counts obtained via single plane images from cryostat sections for all groups measured. The average length to EdU+ ratio was unchanged between groups.
Conclusion: Thus, we conclude that genistein diet does not affect overall cellular proliferation or crypt morphology, other than for the modest increased crypt length measured via clearing in the ob/ob genistein group. The increase in crypt length is likely indicative of the greater accuracy of the 3D measures compared to single plane. Genistein diet-induced increases in the intestinal Isc are therefore likely not attributed to changes in intestinal crypt morphology.
Keywords: genistein, intestine epithelia, jejunum, optical clearing, diabetes
Introduction
The ob/ob leptin-deficient mouse is frequently utilized as a model of obesity-induced type 2 diabetes.1 The ob/ob model is deficient in functional leptin, which leads to hyperphagia, insulin resistance, and obesity.1 In addition, the ob/ob murine model exhibits slow gastrointestinal tract movement and delayed gastric emptying time, ie, gastroparesis.2 Relatively little is currently known regarding intestinal secretory function in the ob/ob mouse. Recently, we provided the first evidence to demonstrate that basal Isc (chloride secretion) is significantly reduced in male and female ob/ob mice compared to lean counterparts.3 Moreover, we also demonstrated that feeding both male and female ob/ob mice a genistein-containing diet (600 mg genistein/kg diet) for 4 weeks had beneficial effects on basal Isc, returning levels back to those measured in leans.4 The current study is an exploration to evaluate whether structural changes in the intestinal crypts (ie, the site of chloride secretion) are responsible for the genistein-mediated increases in basal Isc in ob/ob mice.
The small intestine is the primary site of digestion and absorption. Specifically, the small intestinal crypts are the site of Cl− secretion. Chloride enters the crypt epithelial cells via the Na+/K+/2Cl− (NKCC1) co-transporter, and recycling of K+ across the basolateral membrane provides a mechanism to maintain the driving force for Cl− exit across the apical membrane. The Na+/K+-ATPase maintains Na+ and K+ concentration gradients across the basolateral membrane. The cystic fibrosis transmembrane conductance regulatory (CFTR) protein (a Cl− channel) provides the major route for Cl− exit across the apical membrane in the normal murine intestine.5–7 Aside from our initial published findings describing the loss of Cl− secretory function in the small intestine of the ob/ob mouse,3 and recovery of Cl− secretory function following intake of dietary genistein,4 there have been no further studies aimed to better understand the consequence or the mechanisms involved.
Genistein is an isoflavonic phytoestrogen found in soy-based products.8 We and others have shown using in vitro techniques, such as patch-clamp electrophysiology on single cells, that genistein stimulates the CFTR protein chloride channel.9–12 However, the mechanisms underlying dietary genistein’s ability to stimulate chloride secretion across ob/ob jejunum remain relatively unclear. For example, we previously demonstrated that ob/ob mice consuming genistein-containing diet have rescued basal Isc (ie, chloride secretion is increased by genistein diet to resemble that of lean controls) via sex-dependent differences, an increase in KCa-sensitive Isc in ob/ob females and an increase in Na+/K+-ATPase activity along with an increased NKCC1 expression in ob/ob males.4 However, what remained to be determined was the effect of genistein on the intestinal structure. Hypothetically, a decrease in crypt depth could provide less available secretory epithelial cells and therefore could have explained (at least in part) the reduced basal Isc in ob/ob mice. Moreover, a potential increase in crypt depth could provide more available secretory epithelial cells and may have partially explained the increased basal Isc in ob/ob mice after genistein treatment. The dose of genistein used is important since it should be physiologically relevant and readily achievable via dietary means. To that end, we have previously demonstrated that dietary exposure to genistein (600 mg genistein/kg diet) for a 4-week period generated significant stimulation in basal Isc (ie, chloride secretion) across freshly isolated segments of the jejunum from female lean mice.11 This dose of genistein is a key since low micromolar levels of genistein are known to augment the CFTR channel activity in vitro.9,13,14
Following consumption of a genistein-containing diet (600 mg genistein/kg diet) for 4 weeks, serum genistein levels of C57BL/6J lean mice reached low micromolar range, ~4–7 µM11, and these serum levels are comparable to those measured in humans (~2–4 µM) consuming soy milk in their diet,15 and thus, these serum levels are readily achievable with modest intake of soy.
The objective of this current study was to determine whether dietary genistein improved intestinal secretory function in the ob/ob diabetic model via effects on epithelial proliferation and overall crypt structure in ob/ob mice. The dose of genistein used in this study was the same as in our previous studies: 600 mg genistein/kg diet (consumed ad libitum) for a period of 4 weeks.3,4,16,17 We utilized two methodologies, traditional cryostat sectioning and novel 3D optical clearing to evaluate morphological metrics (numbers of epithelial proliferative cells, crypt depth, and crypt width). Recently, we demonstrated the feasibility of this methodology using optical clearing, which protects intestinal structure and affords the ability to visualize intact 3D intestinal tissue structure, specifically with the staining of individual cells undergoing proliferation using 5-ethynyl-2′-deoxyuridine (EdU).18
We provide evidence that genistein does not affect cellular proliferation in the ob/ob intestine. Moreover, we found that dietary genistein increased crypt length, but this was only quantifiable with the 3D method and not with the cryostat method. These data support the notion that the measurement of subtle biological changes could be missed by traditional histological analysis. These data indicate that although morphometric measurements assessed with cryostat sections are relatively easy to determine, they may not be as accurate as the same measures with a 3D optical cleared section of the same tissue.
Materials and methods
Mouse model of obesity and diet
Male ob/ob and lean C57BL/6J mice aged 4–5 weeks were purchased from Jackson Laboratory (Bar Harbor, ME, USA) and housed in an animal care facility with 12:12-hour light–dark cycle. Mice were randomly assigned to two diet groups: genistein-free (0 mg genistein/kg diet) or genistein-containing diet (600 mg genistein/kg diet, 600G) and given food and water ad libitum for 4 weeks. The specially formulated diets were purchased from Dyets Inc. (Bethlehem, PA, USA), and the composition has been previously published.11,19 Body weight and general health were monitored weekly. At the completion of the 4-week diet study, the mice were given an intraperitoneal injection of 10 mM EdU (10 µL of 2.5 mg/mL EdU in dimethyl sulfoxide [DMSO]/kg body weight) using the Click-iT EdU Alexa Fluor 488 Imaging Kit (Thermo Fisher Scientific, Waltham, MA, USA), approximately 1.5–2 hours prior to being euthanized, which was achieved by asphyxiation in an atmosphere of 100% CO2, followed immediately by surgical thoracotomy to induce pneumothorax. Animal care was conducted in accordance with established guidelines, and all protocols were approved by the Midwestern University Institutional Animal Care and Use Committee and carefully followed the National Institutes of Health’s Guide for the Care and Use of Laboratory Animals.
Assessments of serum insulin and glucose
Glucose and insulin levels were measured using commercially available kits per the assay instructions; glucose was measured with the Wako Autokit Glucose kit (Wako Pure Chemical Industries, Ltd., Osaka, Japan), and insulin was measured with the Millipore Rat/Mouse Insulin enzyme-linked immunoabsorbent assay (Merck Millipore, Billerica, MA, USA).
Histology and morphology
Cryostat
Small segments of jejunum (3–4 mm) were embedded and frozen in optimal cutting temperature (OCT) compound (Tissue-Tek; Torrance, CA, USA) and maintained at –80°C until use. Blocks were sectioned (8–10 µm) with a Microm HM550 cryostat (Thermo Fisher Scientific). Slides were then stained for EdU using a Click-iT EdU Alexa Fluor 488 Imaging Kit (Thermo Fisher Scientific) according to the manufacture’s recommendations. Click-iT reaction cocktail (1x Click-iT reaction buffer, CuSO4, Alexa Fluor Azide 488, reaction buffer additive) was applied to each slide. Slides were then incubated in a darkened humidifier for 30 minutes. Slides were then washed with PBS (Thermo Fisher Scientific) containing 3% BSA (Thermo Fisher Scientific) for 5 minutes, followed by three subsequent washes with PBS for 5 minutes each. Slides were then incubated at room temperature (light protected) with Hoechst from the Click-iT EdU Imaging Kit to stain nuclei (1:2,000) for 30 minutes and then washed twice (5 minutes each) with PBS. Images were taken at 20× magnification on an Olympus IX73 inverted microscope. Crypt length, crypt width, and number of EdU+ cells per crypt were quantified using NIH Image J.20 Measurements were taken from 15 crypts on five separate sections of the jejunum (ie, per mouse), and averages were taken for each mouse. Data are represented as the average of 15 measures/mouse.
Optical clearing
Optical clearing was performed using a method developed in our laboratory.18 Briefly, small segments of jejunum (6–10 mm) were fixed for 3 days in 4% paraformaldehyde (PFA; Electron Microscopy Sciences, Hatfield, PA, USA) at 4°C. Following fixation, tissues were placed in an extended wash with PBS containing 0.02% sodium azide (Technova, Hollister, CA, USA). Jejunum segments were then cut down to 2 mm and placed in tissue clearing solution containing 1× PBS, 20% DMSO (Thermo Fisher Scientific), and 2% Triton (Thermo Fisher Scientific) overnight on a shaker. Samples were then washed with PBS for 1 hour. The samples were incubated in the EdU cocktail (Click-iT EdU Alexa Fluor 488 Imaging Kit) for 2 hours, after which the EdU cocktail was replaced with fresh EdU cocktail and samples were incubated for an additional 2 hours. Samples were washed overnight in PBS. Prior to imaging, samples were placed in refractive index matching solution (RIMS; Histodenz; Millipore-Sigma, St. Louis, MO, USA) containing DAPI (6.25 µg/mL) for 2 days.21 Images were acquired using a 40× oil immersion objective (numerical aperture=1.15) on a Leica SPE confocal microscope (Leica Microsystems, Wetzlar, Germany). Crypt length, crypt width, and EdU+ cells were measured and counted using NIH Image J software.20 Averages were taken from 10 crypts per mouse, and data are presented as the average per mouse.
Image analysis for optical clearing
NIH Image J software was utilized for analysis of crypts in 3D. The images acquired on the Leica SPE confocal microscope were in the blue-green and yellow-green emission spectrum, identifying DAPI and EdU+ cells, respectively. The process of segmenting out individual crypts was initiated by splitting the blue and green channels of the z-stack. The blue channel was used to identify the start and end of each individual crypt. The crypt was then segmented out using the segmentation editor tool in the software. A mask file was then created to subsequently serve as a template to extract a single crypt from the overall z-stack. The result was an isolated z-stack in the blue channel, DAPI-stained cells that allowed for the crypt to be analyzed for crypt length, crypt width, and an isolated z-stack in the green channel that allowed for the identification of EdU+ cells. In total, 10 crypts/mouse were extracted from each z-stack.
Statistical analyses
Data are expressed as mean±standard error of the mean (SEM). Unpaired Student’s t-test was performed using GraphPad (GraphPad Software, Inc., La Jolla, CA, USA), and P<0.05 was considered statistically significant.
Results
Body weights, tibia length, and body weight/tibia length ratio
Validating the obese phenotype of this diabetic model, the ob/ob mice were significantly heavier (1.65-fold) compared to lean controls (Figure 1A), we have previously shown that this increased body weight was associated with significantly higher fat pad and liver weights, along with a fourfold increase in serum insulin levels in the ob/ob control mice (8.45±1.17 ng/mL, n=10, P<0.05) compared to lean controls (1.98±0.32 ng/mL, n=10), and genistein diet had no effect (8.56±0.59 ng/mL, n=8).17 Serum glucose levels were similarly elevated in ob/ob control mice (604.0±56.2 mg/dL, n=7, P<0.05) compared to leans (259.6±18.7 mg/dL, n=6), and genistein diet significantly reduced glucose levels, 43% (345.8±21.1 mg/dL, n=7, P<0.05). Despite a trend for a decrease in tibia length, we noted no significant differences in tibia lengths between the groups (Figure 1B). In concert with the body weight, the ob/ob mice had a 1.7-fold significantly higher body weight to tibia length ratio vs lean controls (Figure 1C).
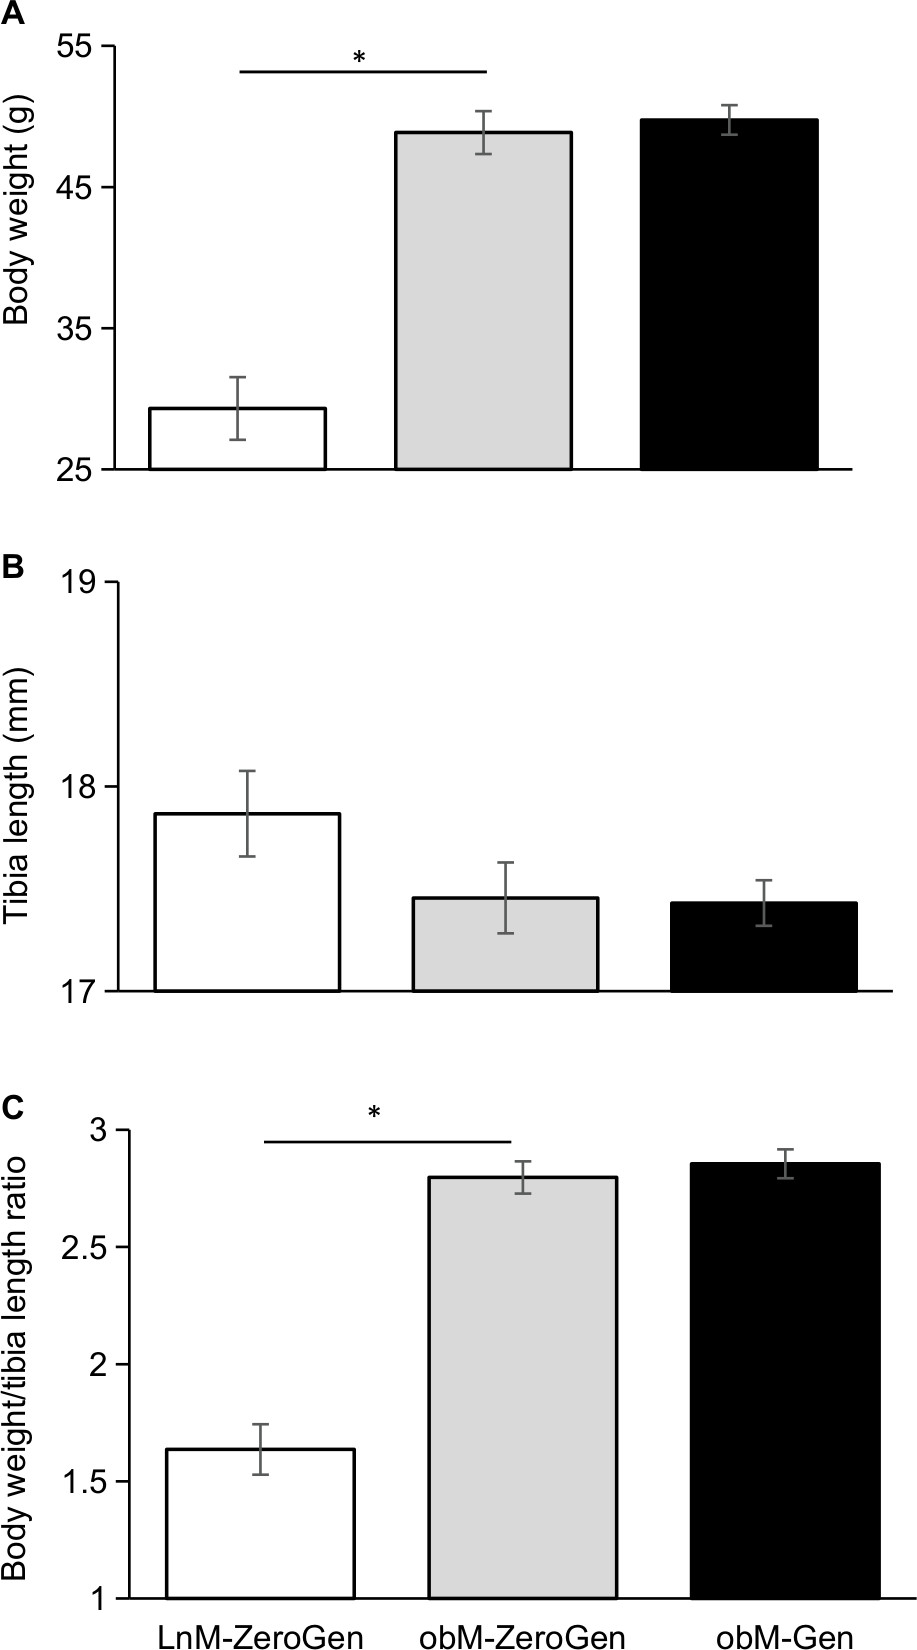 | Figure 1 Effect of dietary genistein on physical characteristics. Notes: (A) Final body weight. The ob/ob control mice were significantly heavier compared to lean controls confirming the obese phenotype of this model. (B) Tibia length. There were no significant differences in tibia length. (C) Body weight/tibia length ratio. The ob/ob control mice had a significantly higher body weight/tibia length ratio compared to lean controls (P<0.05). Data are expressed as mean±SEM (n=6–8). *Significant difference from lean control. LnM-ZeroGen, open bar; obM-ZeroGen, gray bar; obM-Gen, black bars. Abbreviations: EdU, 5-ethynyl-2′-deoxyuridine; LnM-ZeroGen, lean male zero genistein; obM-Gen, ob male with genistein; obM-ZeroGen, ob male zero genistein; SEM, standard error of the mean. |
Histology and morphology
Cryostat
A typical section of jejunum obtained using the cryostat is shown in Figure 2. Staining with Hoechst (blue) tags nuclei and affords the opportunity to visualize key jejunal structures (ie, villi, crypts). All samples were also stained for EdU (green) to track cellular proliferation.
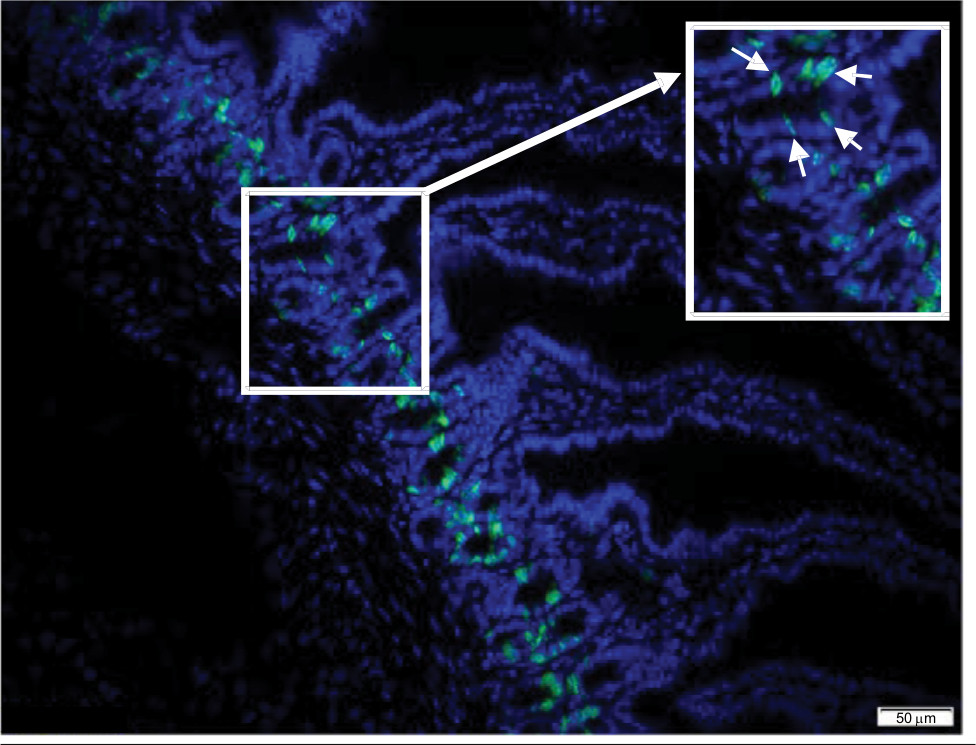 | Figure 2 Representative cryostat section of jejunum. Notes: Cryostat section of jejunum stained for EdU (green) and DAPI (blue). Imaged with a 20× objective (scale bar is 50 µm). Inset is an expanded section of crypt region, highlighting several EdU+ cells (arrow heads). Abbreviation: EdU, 5-ethynyl-2′-deoxyuridine. |
Clearing
Video S1 highlights a 3D reconstruction of optically cleared jejunum stained with DAPI (nuclei, blue) and EdU+ (proliferative cells, green) cells. Typical images obtained using a confocal microscope at 40× magnification are shown in Figure 3. All samples were stained with DAPI (blue) to visualize all cells within the jejunal structure. Figure 3A shows an example of a 3D image of the jejunum when the z-stack is rendered. All samples were also stained for EdU (green) to measure cellular proliferation. An extracted crypt is shown with DAPI- and EdU-stained cells (Figure 3B and C, respectively). Analyzing images from the confocal acquisition allows for each crypt to be extracted out from the entire z-stack to better identify EdU+ cells/crypt. Video S2 highlights a single isolated 3D jejunum crypt via clearing methods. As shown in Figure 4, there were no differences in crypt width (Figure 4B) or EdU+ cells/crypt between groups (Figure 4F). There was a significant increase in crypt length in ob/ob genistein-fed mice (85.19±5.06 µm, n=8, P<0.05) compared to ob/ob-zero genistein mice (72.66±3.46 µm, n=10; Figure 4D). As shown in Figure 4A, C, and E, there were no differences in crypt width, length, or EdU+ cells/crypt between groups from sections using cryostat methodology.
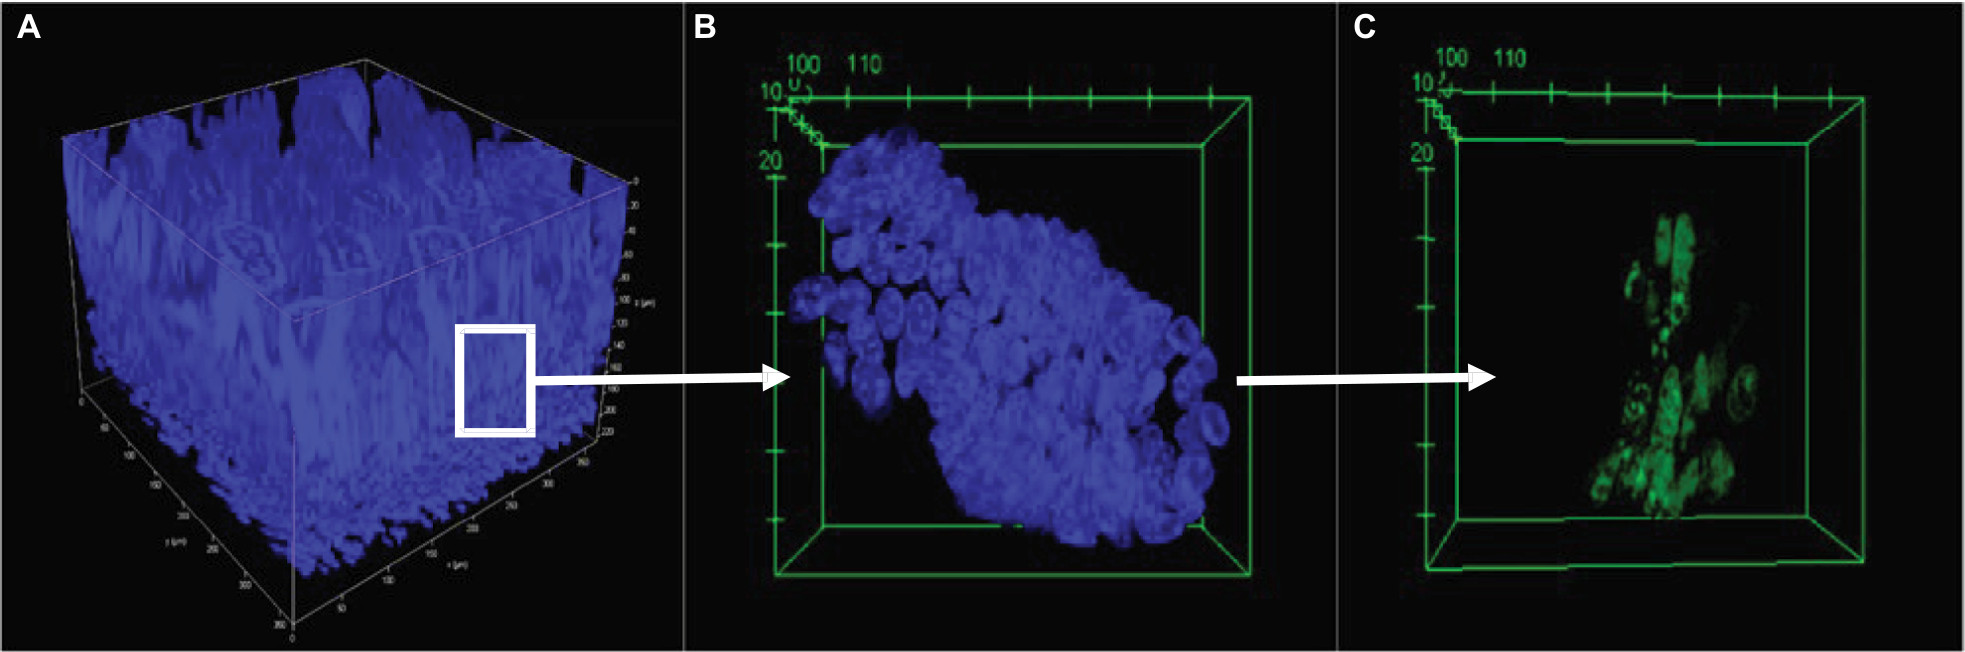 | Figure 3 Representative cleared section of jejunum. Notes: (A) Cleared 3D jejunum tagged with DAPI (blue); imaged with a 20× objective, 223 µm total depth. (B) Isolated crypt tagged with DAPI, 20× objective. (C) Isolated crypt stained for EdU, 20× objective. Abbreviation: EdU, 5-ethynyl-2′-deoxyuridine. |
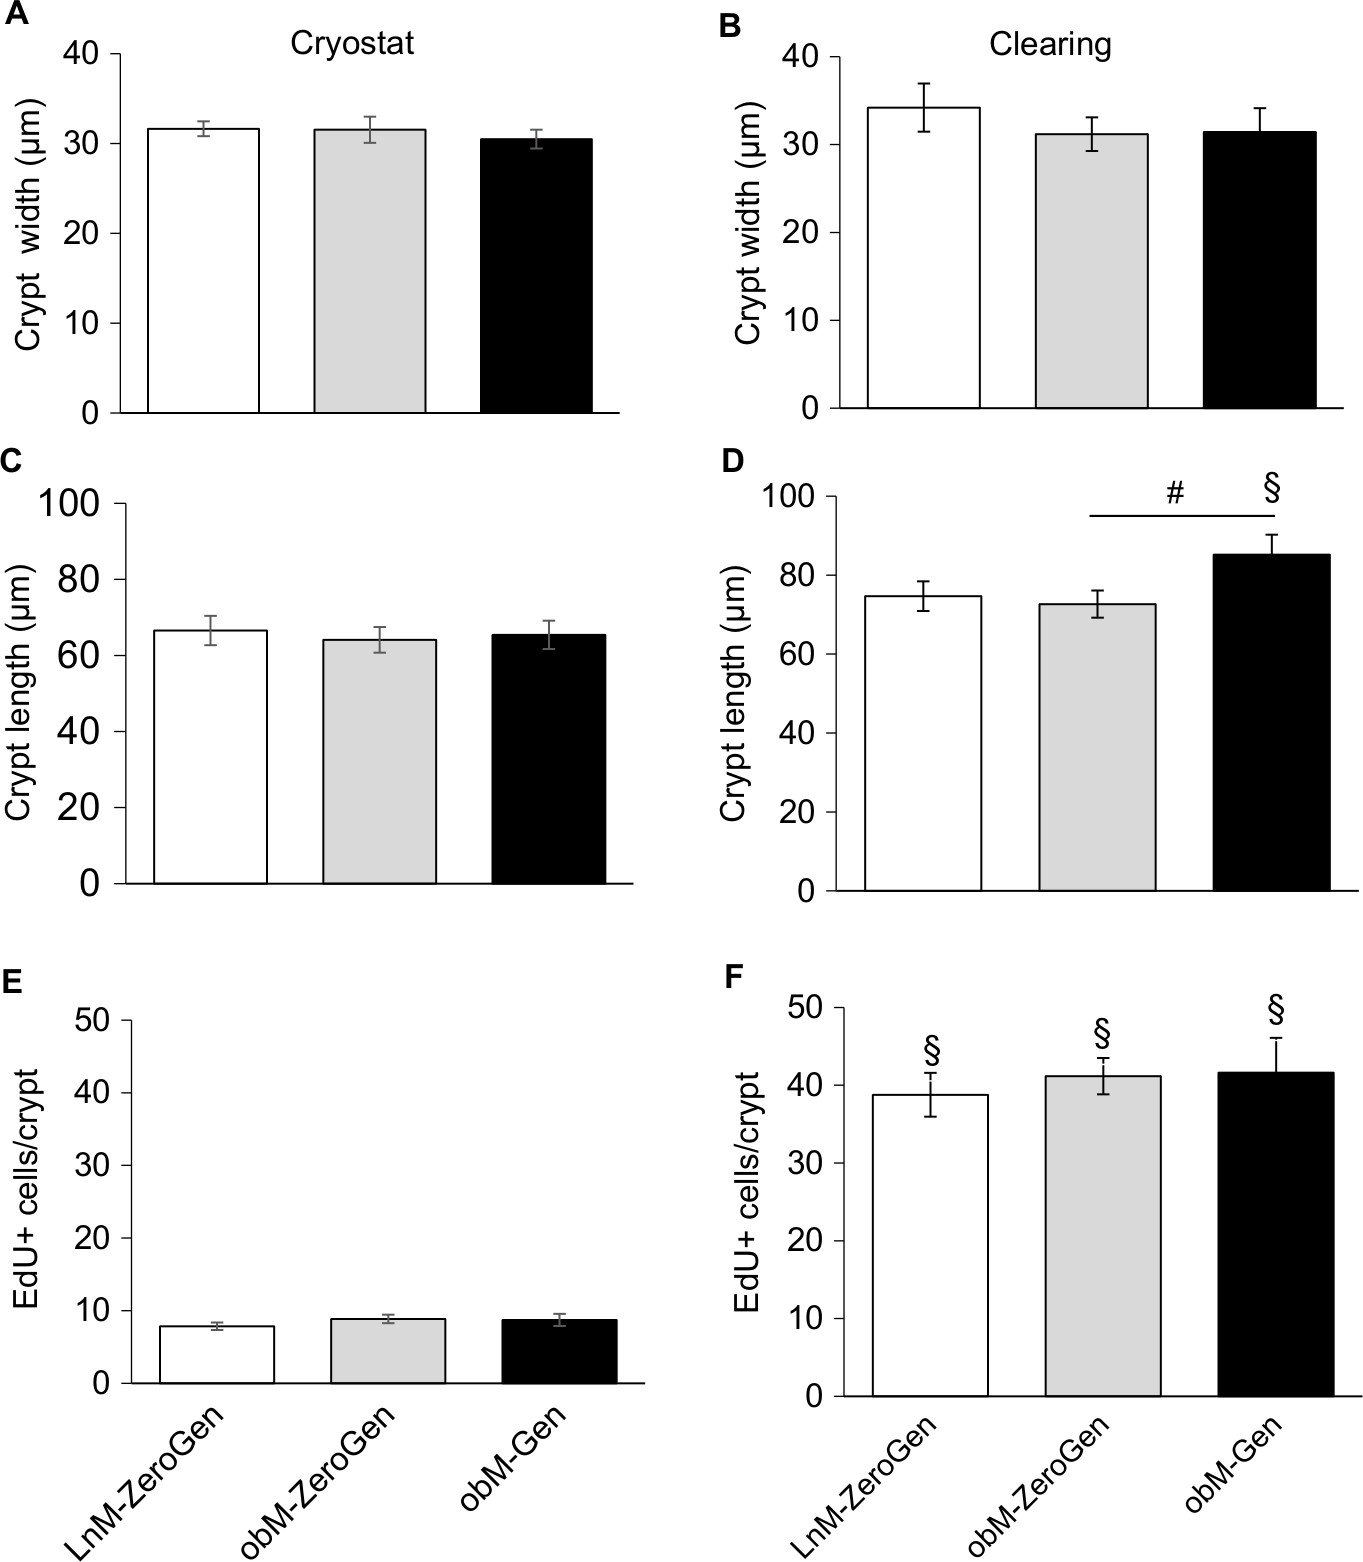 | Figure 4 Comparison of crypt dimensions and number of EdU-positive cells measured with cryostat and clearing techniques. Notes: (A) Crypt width: cryostat method: no differences between groups. (B) Crypt width: clearing method: no differences between groups. Crypt width measures were comparable between methodologies. (C) Crypt length: cryostat method: no differences between groups. (D) Crypt length: clearing method: a significant increase in length in ob/ob mice that fed genistein compared to ob/ob controls. There was a significant difference in crypt length between methodologies for the ob/ob mice that fed genistein. (E) EdU-positive cells per crypt: cryostat method: no differences between groups. (F) EdU-positive cells per crypt: clearing method: no differences between groups. There were significant differences between methodologies when comparing the same groups across methods (clearing greater than cryostat). Values are expressed as mean±SEM (n=8–10). #Significant genistein-mediated effect (P<0.05). §Significant difference between methodologies (P<0.05). LnM-ZeroGen, open bar; obM-ZeroGen, gray bar; obM-Gen, black bar. Abbreviations: EdU, 5-ethynyl-2′-deoxyuridine; LnM-ZeroGen, lean male zero genistein; obM-Gen, ob male with genistein; obM-ZeroGen, ob male zero genistein; SEM, standard error of the mean. |
Cryostat vs clearing
When comparing the two methods, no differences were noted with regards to crypt width. In contrast, there was a significant increase in the amount of EdU+ cells/crypt in the clearing method (LnM-ZeroGen, 38.78±2.81 [n=8]; obM-ZeroGen, 41.16±2.34 [n=10]; obM-Gen, 41.61±4.47 [n=8], P<0.05) vs the cryostat method (LnM-ZeroGen, 7.84±0.51 [n=8]; obM-ZeroGen, 8.86±0.59 [n=10]; obM-Gen, 8.72±0.84 [n=8]; Figure 4E, F). Furthermore, there was a significant difference in crypt length between methodologies for the ob/ob genistein group only; cryostat: 65.42±3.72 µm (n=8) and clearing: 85.19±5.06 µm (n=8, P<0.05; Figure 4C and D). However, there were significant differences for average number of EdU+ cells/length ratio between methodologies (clearing: LnM-ZeroGen, 0.50±0.05 [n=5]; obM-ZeroGen, 0.59±0.06 [n=8]; obM-ZeroGen, 0.48±0.03 [n=8]; compared to cryostat: LnM-ZeroGen, 0.12±0.01 [n=5]; obM-ZeroGen, 0.13±0.01 [n=8]; obM-ZeroGen, 0.14±0.02 [n=8], P<0.05; Figure 5A and B).
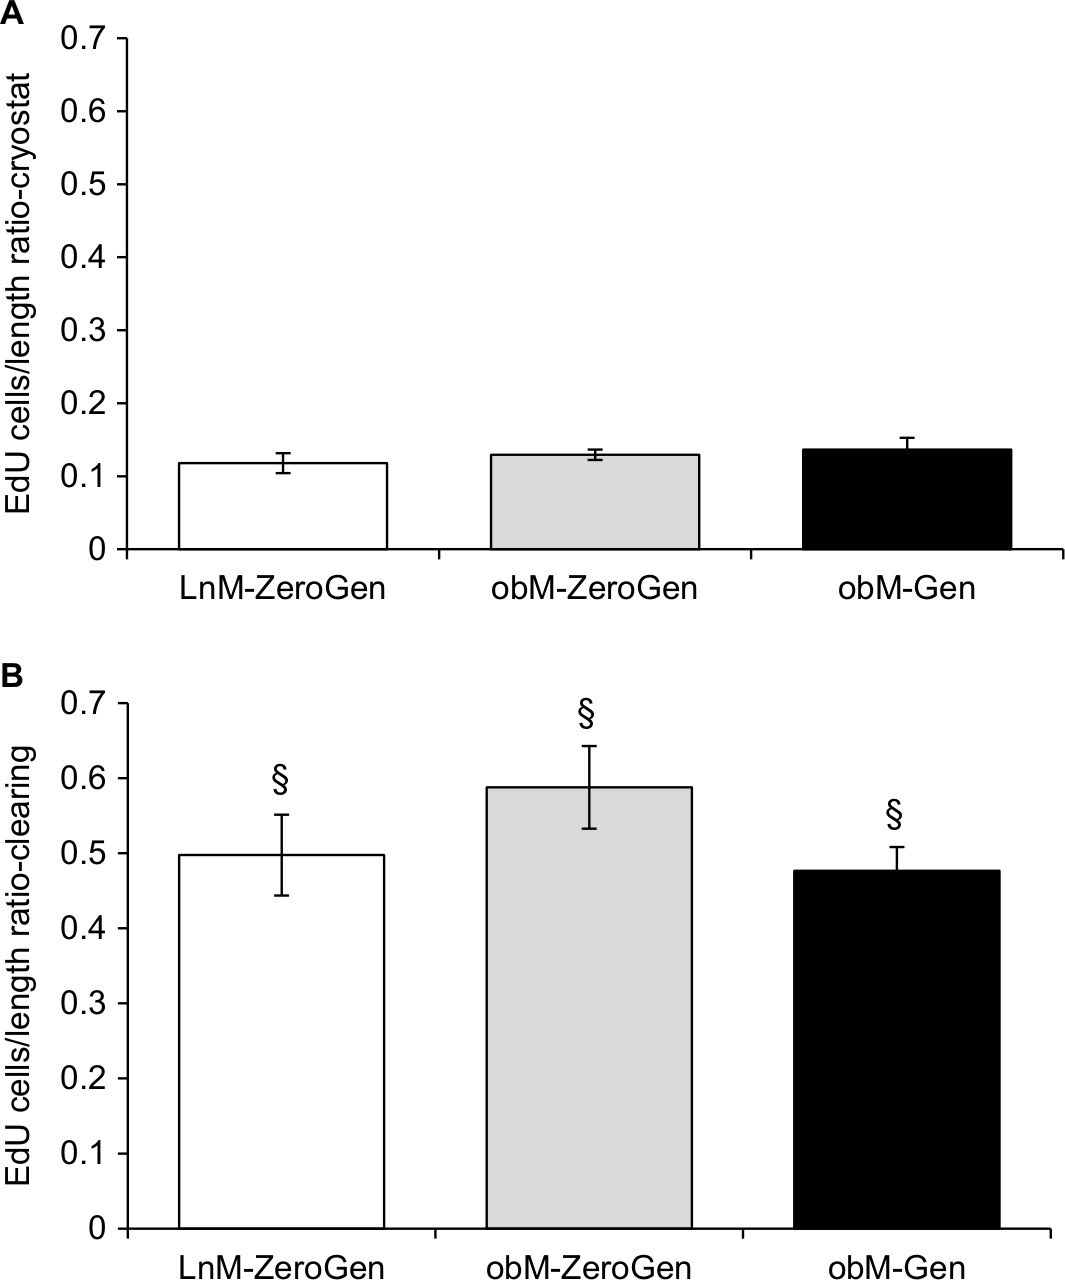 | Figure 5 Comparison of the number of EdU-positive cells per length of crypt using cryostat and clearing methods. Notes: (A) EdU/length ratio with cryostat method. No differences between groups. (B) EdU/length ratio with clearing method. No differences between groups. There were significant differences for average EdU/length ratio across methodologies (clearing greater than cryostat). Values are expressed as mean±SEM (n=8–10). §Significant difference between methodologies (P<0.05). LnM-ZeroGen, open bar; obM-ZeroGen, gray bar; obM-Gen, black bar. Abbreviations: EdU, 5-ethynyl-2′-deoxyuridine; LnM-ZeroGen, lean male zero genistein; obM-Gen, ob male with genistein; obM-ZeroGen, ob male zero genistein; SEM, standard error of the mean. |
Comparison of the coefficient of variation for each method for the measures taken (number of EdU cells/crypt, crypt width, and crypt length) was lower for the clearing method compared to the cryostat method (Figure 6). Some significant differences were noted in the ob/ob zero-genistein and genistein groups for EdU+ cells/crypt and crypt length and in the lean zero-genistein group for crypt width. These data indicate that the clearing method is more precise because measurements were deliberately taken at peak distances within each crypt. In addition, the EdU+ counts per crypt as measured in cleared samples were five times greater compared to cryostat counts due to the ability to count an entire crypt.
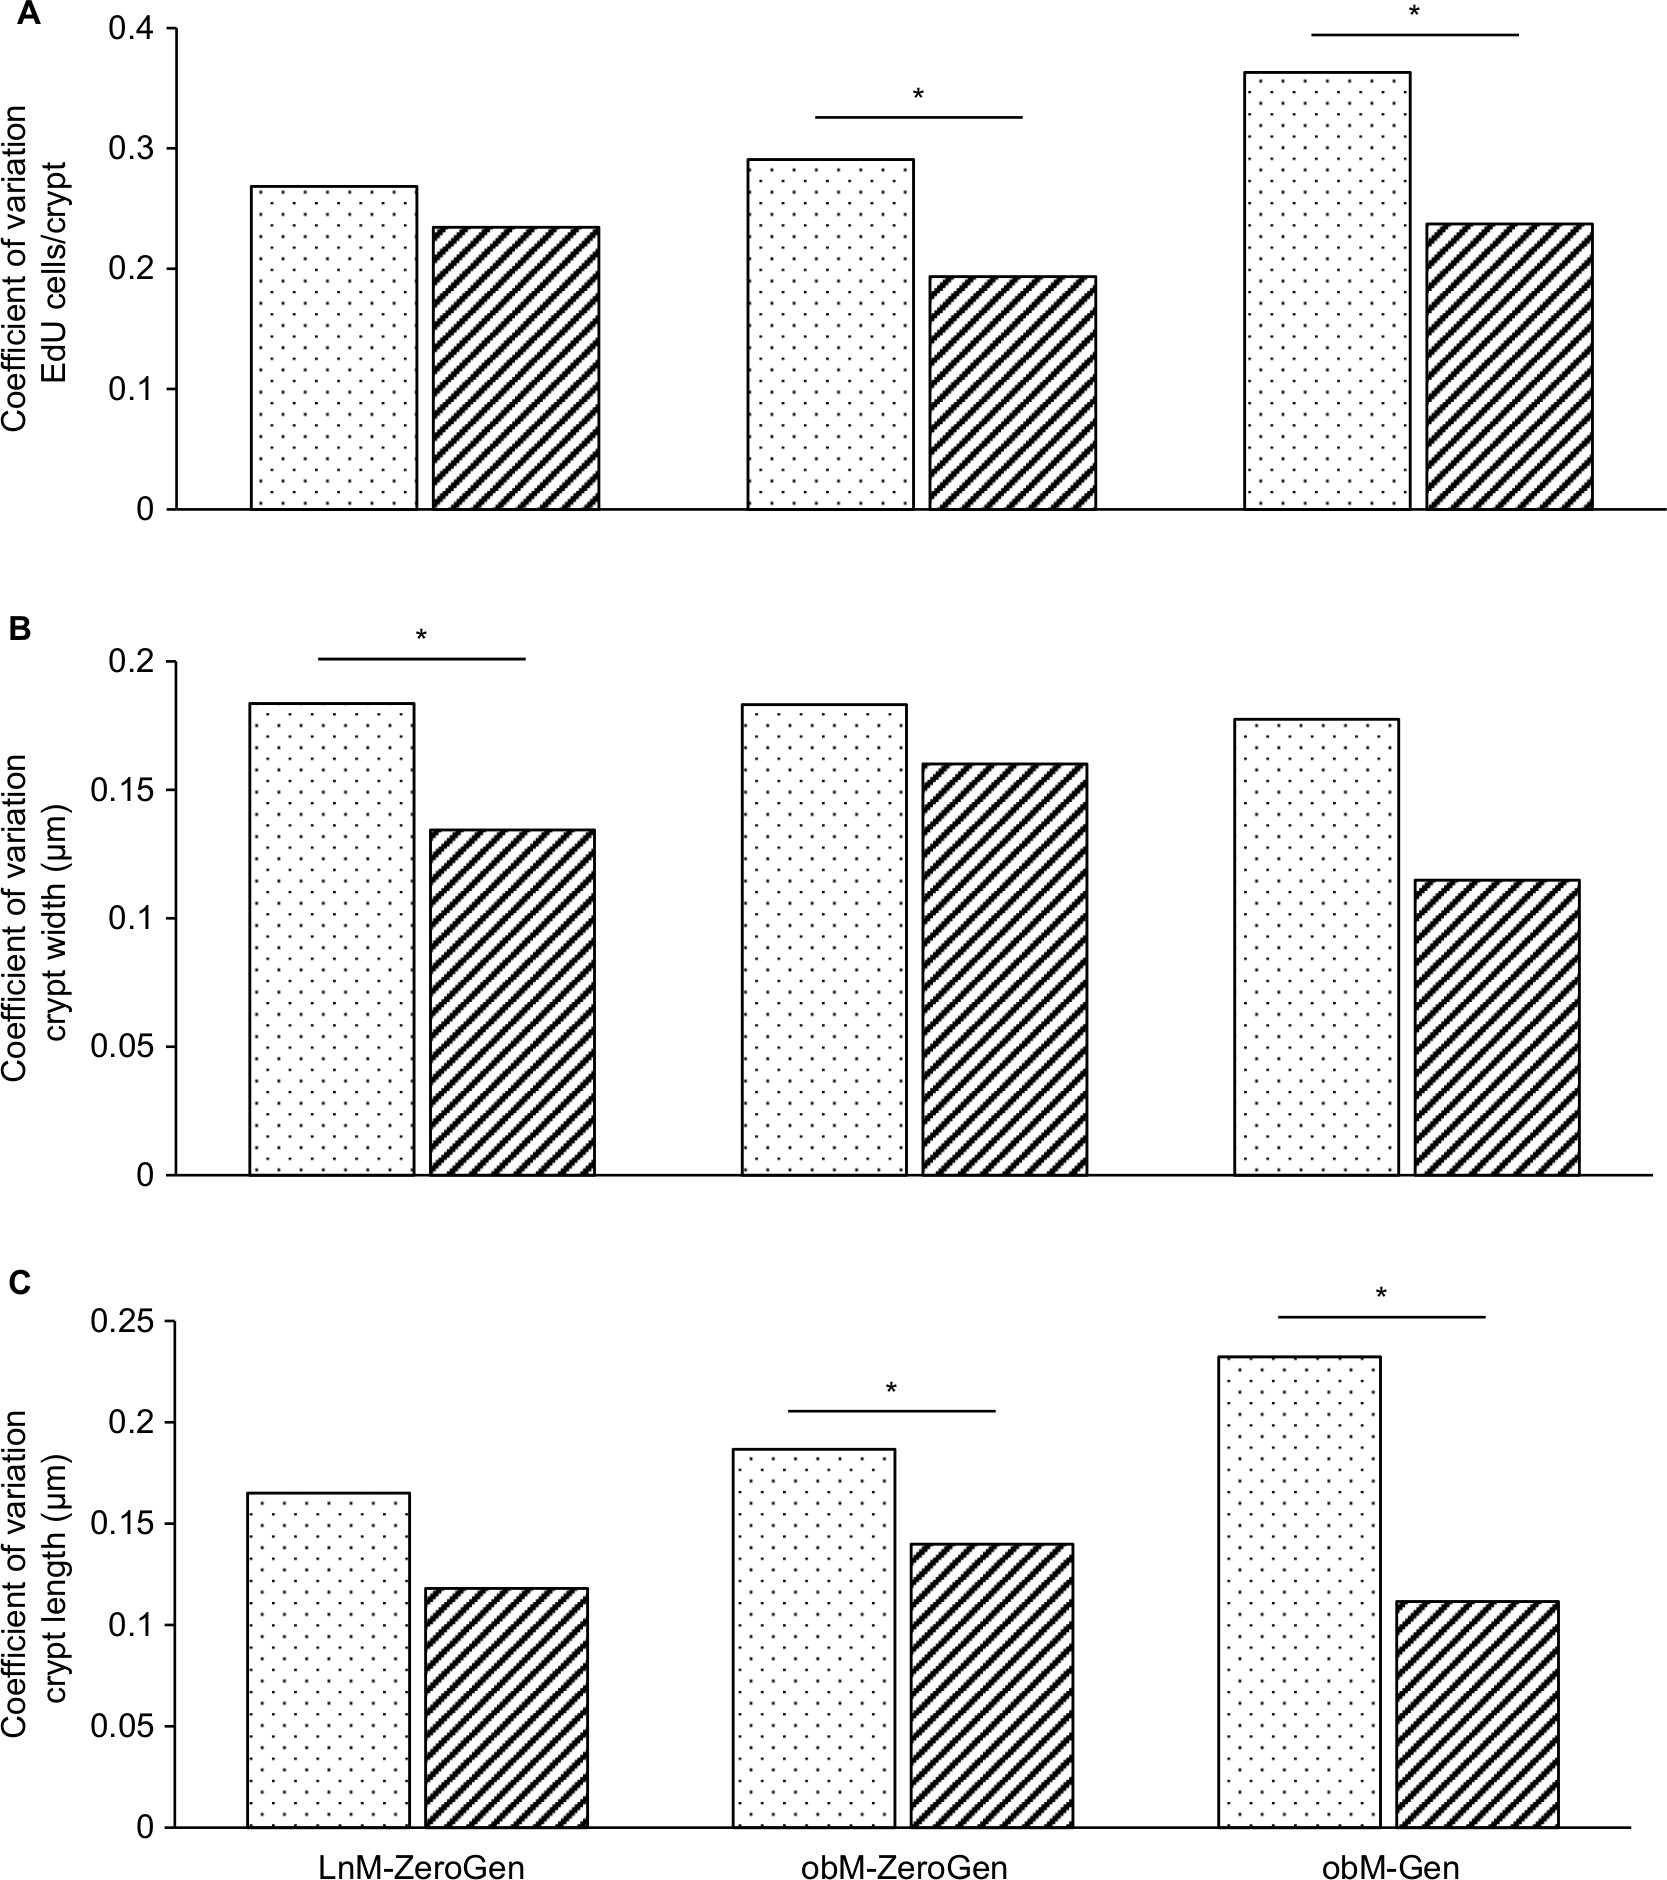 | Figure 6 Comparison of the coefficient of variation for cryostat vs clearing method. Notes: (A) EdU+ cells/crypt: the amount of variation around the mean for the clearing method was significantly lower for the obM-ZeroGen and obM-Gen groups (P<0.05). (B) Crypt width: the amount of variation around the mean for the clearing method was significantly lower for the LnM-ZeroGen group (P<0.05). (C) Crypt length: the amount of variation around the mean for the clearing method was significantly lower for both the obM-ZeroGen and obM-Gen groups (P<0.05). *Significant difference (P<0.05; n=6–8). Cryostat measures are represented as dotted bars and clearing method is represented as hashed bars. Abbreviations: EdU, 5-ethynyl-2′-deoxyuridine; LnM-ZeroGen, lean male zero genistein; obM-Gen, ob male with genistein; obM-ZeroGen, ob male zero genistein. |
Discussion
This study aimed to evaluate the effect of dietary genistein (600 mg genistein/kg of diet) on jejunal crypt morphology in the ob/ob obese diabetic murine model. Previously, we have shown that basal Isc (ie, chloride secretion) is significantly less in jejunal tissue from both male and female ob/ob mice, compared to lean mice.3 In addition, we have previously shown that consuming dietary genistein (600 mg genistein/kg of diet) for 4 weeks significantly increases or rescues jejunum chloride Isc in both male and female ob/ob mice.4 The ability of dietary genistein to modify physiological function has been explored in other capacities. For example, in the same ob/ob mouse model, we have previously shown that 1) genistein diet has beneficial effects on energy expenditure, T3 production, and corticosterone status in ob/ob males,17 2) genistein diet has been shown to rescue the number of acetylcholine receptors and decreases the distance between consecutive contractile events in jejunum from female ob/ob mice,16 3) genistein diet improves femur fracture resistance in response to bending loads in ob/ob females.22 Furthermore, literature evidence from others indicates that dietary genistein has a variety of other effects: 1) increases weight of gastrocnemius muscle in mice,23 2) modulates β2-adrenergic receptor expression in mouse skeletal muscle,24 3) ameliorates nonalcoholic fatty liver disease,25 4) has protective effects against neuronal degeneration in ApoE mice that fed a high-fat diet (Park et al26), and 5) attenuates intestinal architecture in broiler chicken following lipopolysaccharide-induced deterioration of intestinal morphology.27
The current study evaluated the possible role of genistein-induced morphological changes in jejunal crypts of male ob/ob mice in mediating the rescue of chloride secretory Isc. Male ob/ob mice were fed either a genistein-free diet (Zero-Gen) or genistein-containing diet (Gen) and compared with lean controls (fed Zero-Gen). Assessments of crypt morphology were performed via two methodologies: traditional cryostat sections in OCT compound and an innovative 3D optical clearing method.
Biological tissues are complex 3D structures. Traditionally, tissues are evaluated histologically via a two-dimensional methodology providing a single-plane image. Cryostat sections of jejunal tissue require the physical sectioning of tissue samples, and consequently, single-plane images are obtained with no clear indication of tissue orientation. This study focused on the crypts within the jejunum, and ideally the most accurate measurements for width and length should be taken at the approximate center of the crypt. However, with cryostat sections, there is no clear indication as to the orientation of a single crypt, and therefore, the measures for length and width could possibly be, and likely are, taken in the beginning, middle, or end of the crypt. Therefore, a major aim of this study was to assess the merits of using an alternative technique to provide more accurate morphological measures of jejunal crypts.
Optical clearing allows larger tissue samples to be imaged with minimal disassembly to achieve 3D images at depths greater than 200 µm, with a confocal step size as thin as 0.44 µm. Optical sections of the jejuna are acquired after the tissue has undergone a clearing process. These optical sections are then sequentially stacked, forming a z-stack resulting in the generation of a 3D image. Theoretically, this could also be completed with traditional histological techniques. However, each physical section of tissue would need to be collected on a slide, and the single-plane images would need to be taken in a sequential order. In practice, this is more complicated due to occasional tissue tear, resulting in the loss of a section(s) and therefore yielding inaccurate z-stacks. This is not the case with the optical clearing technique since the confocal microscope produces images of focal planes deep within thick samples, without physically cutting through the tissue. Although there are several clearing techniques, each method sets out to attain the following three objectives: 1) efficiently clear central organs and peripheral tissues; 2) preserve cellular and subcellular structures; and 3) be compatible with fluorescent protein expression and detection of DNA, RNA, and peptides.21 As described in this study, jejunum samples were fixed, placed in a clearing solution for de-lipidation to reduce tissue opacity, and placed in a RIMS.21 Matching the tissue’s refractive index to that of the mounting medium and immersion medium reduces light scattering, thereby rendering the tissue as transparent as possible to allow for deeper imaging.
Some of the tradeoffs for using clearing vs cryostat techniques are time and information. Overall, the clearing method takes longer to acquire 3D images as opposed to the cryostat 2D images: cryostat methodology may take a maximum of 2 days for sectioning, staining, and imaging, whereas in contrast, clearing methodology takes longer than a week. Analysis of images obtained for both techniques is similarly a more arduous process for clearing (10 hours/sample) vs cryostat (1 hour/sample). Despite these challenges, more information can be gained with a 3D image. For example, visualizing how crypts are situated in relation to one another and their relationship to the whole gastrointestinal tract wall is important. Prior to the capabilities of imaging today, researchers were limited to imaging small portions of tissue at high resolution or large tissue areas at low resolution.28 Although there are a variety of optical clearing methods available, there is not one single protocol that works for all tissue types, and therefore, subtle modifications are required depending on the tissue type. The protocol used for this study was first developed on testis and modified from other clearing protocols.29
The results from this study reveal that the major difference within these two methodologies is the ability to accurately count all the EdU+ cells/crypt and to measure the peak width and peak length of each crypt, based on the ability to view a single crypt in its entirety. The parameters that were measured in this study revealed 1) the number of EdU+ cells per crypt was greater with the clearing method compared to the cryostat method, 2) crypt length measured with clearing method was 1.3-fold longer, which is significant, in the ob/ob genistein diet group compared with the cryostat method, likely since all measurements are taken at the peak length of each crypt.
It is interesting to note that there was no linear correlation between crypt width and length regardless of method, indicating that crypt morphology is relatively unconstrained, ie, crypts are merely of varying dimensions (long and narrow, short and narrow, long and wide, or short and wide). As shown in Figure 6, the coefficient of variation for each measurement was lower for the clearing method compared to the cryostat method for each parameter, indicating that the clearing method was more precise.
These data indicate that genistein does not affect cellular proliferation or crypt morphology, other than the increased crypt length measured via clearing in the ob/ob genistein-fed group (not indicated when measured with cryostat). This study was developed based on our previous studies that assessed chloride secretion from the jejunum of ob/ob mice.3,4 Hypothetically, an increase in chloride section in the ob/ob mouse, following genistein consumption, could be partially explained by modifications in crypt dimensions. Indeed, over nutrition has been shown to stimulate intestinal epithelial proliferation in the db/db diabetic mouse.30 Moreover, Dorfman et al31 found an accumulation in β-catenin levels in diabetic rats, indicating an upregulation of the WNT/β-catenin pathway that controls epithelial cell proliferation. Therefore, an evaluation of the potential upregulation of cellular proliferation was reasonable in this study of male ob/ob diabetic mice. Here, we measured DNA synthesis using EdU, which is a nucleoside analog of thymidine that incorporates into the DNA during active DNA synthesis,32 and the tagged DNA is detected in a click reaction.33,34 The data obtained from this study indicated that there was no increase in cellular proliferation in the male ob/ob control mice compared to the lean controls, and genistein diet had no effect. Therefore, the increase in chloride secretion that we have previously observed in male ob/ob mice following consumption of the genistein diet4 is not due to modifications in crypt morphology. However, we note that this may or may not be the case for female ob/ob mice since sex-dependent differences have previously been present regarding genistein and chloride secretions.35 It is conceivable that modifications in crypt morphology could play a role in mediating the genistein-mediated increase in female ob/ob mice and not in male ob/ob mice. Future studies will evaluate this hypothesis.
The beneficial effects of dietary genistein on basal Isc from ob/ob male mice are, therefore, likely not due to major morphological changes of the crypts. The increased crypt length measured via clearing in the ob/ob genistein group is not associated with increased EdU cell numbers. We conclude that this is likely not a mechanism that is contributing toward genistein-mediated increases in chloride secretion, which we predict are attributed to modifications in the enterocyte cellular transporters or the regulation thereof. Our previous work supports this conclusion; we previously demonstrated that ob/ob mice consuming genistein-containing diet have rescued basal Isc (ie, resembles lean controls) via sex-dependent differences (increased KCa-sensitive Isc in ob/ob females and increased Na+/K+-ATPase activity and NKCC1 expression in ob/ob males).4 In addition, we conclude that the use of the optical clearing approach demonstrates more accurate and precise measurements regarding crypt morphology. The ability to obtain a 3D view of jejunal morphology yields more accurate measurements than traditional cryostat sections because the crypt can be analyzed in its entirety. The lower measurement variation we observed in optically cleared samples compared to measures taken from “random” cryostat sections indicates a more precise approach to quantify intestinal crypts. This insight may lead to an increased usage of optical clearing methods for targeted morphological evaluations in various models of clinically relevant intestinal pathology.
Acknowledgments
This work was supported by a DAREF grant (LA-N), Midwestern University intramural funding (JAK and LA-N), and CHS Biomedical Science funds (NS-S). This article (in preliminary form) was presented at the Experimental Biology 2017 as a poster presentation with interim findings. The poster’s abstract was published in “Poster Abstracts” in The FASEB Journal, abstract 894.2: https://www.fasebj.org/doi/abs/10.1096/fasebj.31.1_supplement.894.2.
Author contributions
LA-N and JAK conceived and designed the experiment. MJC and JAK developed and optimized the protocol for optical clearing and imaging. LA-N and NS-S performed the EdU injections and animal euthanasia. NS-S and MJC processed the samples for optical clearing and performed confocal imaging. NS-S performed all the measures and analyses. LA-N and NS-S wrote the manuscript. All of the authors reviewed the final version of the manuscript and provided their consent before submission. All authors contributed toward data analysis, drafting and critically revising the paper, gave approval for the final version to be published and agree to be accountable for all aspects of the work.
Disclosure
The authors report no conflicts of interest in this work.
References
Drel VR, Mashtalir N, Ilnytska O, et al. The leptin-deficient (ob/ob) mouse: a new animal model of peripheral neuropathy of type 2 diabetes and obesity. Diabetes. 2006;55(12):3335–3343. | ||
El-Salhy M. Gastrointestinal transit in an animal model of human diabetes type 2: relationship to gut neuroendocrine peptide contents. Ups J Med Sci. 2002;107(2):101–110. | ||
Leung L, Kang J, Rayyan E, et al. Decreased basal chloride secretion and altered cystic fibrosis transmembrane conductance regulatory protein, Villin, GLUT5 protein expression in jejunum from leptin-deficient mice. Diabetes Metab Syndr Obes. 2014;7:321–330. | ||
Catmull S, Masood F, Schacht S, et al. Dietary genistein rescues reduced basal chloride secretion in diabetic jejunum via sex-dependent mechanisms. Cell Physiol Biochem. 2016;40(1–2):335–346. | ||
Anderson MP, Welsh MJ. Calcium and cAMP activate different chloride channels in the apical membrane of normal and cystic fibrosis epithelia. Proc Natl Acad Sci U S A. 1991;88(14):6003–6007. | ||
Clarke LL, Grubb BR, Yankaskas JR, Cotton CU, Mckenzie A, Boucher RC. Relationship of a non-cystic fibrosis transmembrane conductance regulator-mediated chloride conductance to organ-level disease in Cftr(-/-) mice. Proc Natl Acad Sci U S A. 1994;91(2):479–483. | ||
Grubb BR. Ion transport across the normal and CF neonatal murine intestine. Am J Physiol. 1999;277(1 Pt 1):G167–G174. | ||
Murphy PA. Phytoestrogen content of processed soybean products. Food Technol. 1982;36:60–64. | ||
Al-Nakkash L, Hu S, Li M, Hwang TC. A common mechanism for cystic fibrosis transmembrane conductance regulator protein activation by genistein and benzimidazolone analogs. J Pharmacol Exp Ther. 2001;296(2):464–472. | ||
Illek B, Fischer H, Santos GF, Widdicombe JH, Machen TE, Reenstra WW. cAMP-independent activation of CFTR Cl channels by the tyrosine kinase inhibitor genistein. Am J Physiol. 1995;268(4 Pt 1):C886–C893. | ||
Al-Nakkash L, Clarke LL, Rottinghaus GE, Chen YJ, Cooper K, Rubin LJ. Dietary genistein stimulates anion secretion across female murine intestine. J Nutr. 2006;136(11):2785–2790. | ||
Chao PC, Hamilton KL. Genistein stimulates electrogenic Cl– secretion via phosphodiesterase modulation in the mouse jejunum. Am J Physiol Cell Physiol. 2009;297(3):C688–C698. | ||
Hwang TC, Wang F, Yang IC, Reenstra WW. Genistein potentiates wild-type and delta F508-CFTR channel activity. Am J Physiol. 1997;273(3 Pt 1):C988–C998. | ||
Wang F, Zeltwanger S, Yang IC, Nairn AC, Hwang TC. Actions of genistein on cystic fibrosis transmembrane conductance regulator channel gating. Evidence for two binding sites with opposite effects. J Gen Physiol. 1998;111(3):477–490. | ||
Xu X, Wang HJ, Murphy PA, Cook L, Hendrich S. Daidzein is a more bioavailable soymilk isoflavone than is genistein in adult women. J Nutr. 1994;124(6):825–832. | ||
Schacht S, Masood F, Catmull S, et al. Dietary genistein influences number of acetylcholine receptors in female diabetic jejunum. J Diabetes Res. 2017;2017:1–9. | ||
Rockwood S, Broderick TL, Al-Nakkash L. Feeding obese diabetic mice a genistein diet induces thermogenic and metabolic change. J Med Food. 2018;21(4):332–339. | ||
Kaufman JA, Castro MJ, Sandoval-Skeet N, Al-Nakkash L. Optical clearing of small intestine for three-dimensional visualization of cellular proliferation within crypts. J Anat. 2018;232(1):152–157. | ||
Simperova A, Al-Nakkash L, Faust JJ, Sweazea KL. Genistein supplementation prevents weight gain but promotes oxidative stress and inflammation in the vasculature of female obese ob/ob mice. Nutr Res. 2016;36(8):789–797. | ||
Schindelin J, Arganda-Carreras I, Frise E, et al. Fiji: an open-source platform for biological-image analysis. Nat Methods. 2012;9(7):676–682. | ||
Yang B, Treweek JB, Kulkarni RP, et al. Single-cell phenotyping within transparent intact tissue through whole-body clearing. Cell. 2014;158(4):945–958. | ||
Odle B, Dennison N, Al-Nakkash L, Broderick TL, Plochocki JH. Genistein treatment improves fracture resistance in obese diabetic mice. BMC Endocr Disord. 2017;17(1):1–8. | ||
Hirasaka K, Saito S, Yamaguchi S, et al. Dietary supplementation with isoflavones prevents muscle wasting in tumor-bearing mice. J Nutr Sci Vitaminol. 2016;62(3):178–184. | ||
Chikazawa M, Sato R. Identification of a Novel Function of Resveratrol and Genistein as a Regulator of β2-Adrenergic Receptor Expression in Skeletal Muscle Cells and Characterization of Promoter Elements Required for Promoter Activation. Mol Nutr Food Res. 2018;303:1800530. | ||
Wang W, Chen J, Mao J, et al. Genistein Ameliorates Non-alcoholic Fatty Liver Disease by Targeting the Thromboxane A2 Pathway. J Agric Food Chem. 2018;66(23):5853–5859. | ||
Park YJ, Ko JW, Jeon S, Kwon YH. Protective effect of genistein against neuronal degeneration in ApoE-/- mice fed a high-fat diet. Nutrients. 2016;8(11):692. | ||
Kamboh AA, Zhu WY. Individual and combined effects of genistein and hesperidin on immunity and intestinal morphometry in lipopolysacharide-challenged broiler chickens. Poult Sci. 2014;93(9):2175–2183. | ||
Seo J, Choe M, Kim SY. Clearing and Labeling Techniques for Large-Scale Biological Tissues. Mol Cells. 2016;39(6):439–446. | ||
Kaufman JA, Castro MJ, Ruiz SA, Rodriguez-Sosa JR. Optical Clearing and 3D-histology of murine testis. FASEB J. 2016; 30(1_supplement):1045–6. | ||
Mao J, Hu X, Xiao Y, et al. Overnutrition stimulates intestinal epithelium proliferation through β-catenin signaling in obese mice. Diabetes. 2013;62(11):3736–3746. | ||
Dorfman T, Pollak Y, Sohotnik R, Coran AG, Bejar J, Sukhotnik I. Enhanced intestinal epithelial cell proliferation in diabetic rats correlates with β-catenin accumulation. J Endocrinol. 2015;226(3):135–143. | ||
Salic A, Mitchison TJ. A chemical method for fast and sensitive detection of DNA synthesis in vivo. Proc Natl Acad Sci U S A. 2008;105(7):2415–2420. | ||
Kolb HC, Finn MG, Sharpless KB. Click chemistry: Diverse chemical function from a few good reactions. Angew Chem Int Ed Engl. 2001;40(11):2004–2021. | ||
Wang Q, Chan TR, Hilgraf R, Fokin VV, Sharpless KB, Finn MG. Bioconjugation by copper(I)-catalyzed azide-alkyne [3+2] cycloaddition. J Am Chem Soc. 2003;125(11):3192–3193. | ||
Al-Nakkash L. Genistein stimulates jejunal chloride secretion via sex-dependent, estrogen receptor or adenylate cyclase mechanisms. Cell Physiol Biochem. 2012;30(1):137–150. |
 © 2018 The Author(s). This work is published and licensed by Dove Medical Press Limited. The
full terms of this license are available at https://www.dovepress.com/terms
and incorporate the Creative Commons Attribution
- Non Commercial (unported, 3.0) License.
By accessing the work you hereby accept the Terms. Non-commercial uses of the work are permitted
without any further permission from Dove Medical Press Limited, provided the work is properly
attributed. For permission for commercial use of this work, please see paragraphs 4.2 and 5 of our Terms.
© 2018 The Author(s). This work is published and licensed by Dove Medical Press Limited. The
full terms of this license are available at https://www.dovepress.com/terms
and incorporate the Creative Commons Attribution
- Non Commercial (unported, 3.0) License.
By accessing the work you hereby accept the Terms. Non-commercial uses of the work are permitted
without any further permission from Dove Medical Press Limited, provided the work is properly
attributed. For permission for commercial use of this work, please see paragraphs 4.2 and 5 of our Terms.