Back to Journals » International Journal of Nanomedicine » Volume 15
Gene Expression Profiling of the Liver and Lung in Mice After Exposure to ZnO Quantum Dots
Authors Yang Y, Li P, Lin Y, Li Z, Cui T, Song Z, Wu W, Lv S ![]() , Ji S
, Ji S
Received 20 January 2020
Accepted for publication 8 April 2020
Published 28 April 2020 Volume 2020:15 Pages 2947—2955
DOI https://doi.org/10.2147/IJN.S246754
Checked for plagiarism Yes
Review by Single anonymous peer review
Peer reviewer comments 3
Editor who approved publication: Dr Linlin Sun
Yanjie Yang, Peisen Li, Yao Lin, Ziqi Li, Tianyi Cui, Zhenhua Song, Weixia Wu, Shuangyu Lv, Shaoping Ji
Henan Provincial Engineering Centre for Tumor Molecular Medicine, Institute of Molecular Medicine, School of Basic Medical Sciences, Henan University, Kaifeng 475004, People’s Republic of China
Correspondence: Shuangyu Lv; Shaoping Ji
School of Basic Medical Sciences, Henan University, Kaifeng 475004, People’s Republic of China
Tel/Fax +86 371 2388 0585
Email [email protected]; [email protected]
Introduction: ZnO quantum dots (QDs) have drawn much attention recently as they are Cd-free, low-cost, and have excellent optical properties. With the expanded production and application of ZnO nanoparticles, concerns about their potential toxicity have also been raised.
Materials and Methods: We used RNA sequencing (RNA-seq) to analyze the global gene expression of liver and lung tissues after ZnO QDs treatment. Differentially expressed genes (DEGs) were screened, with a fold change > 1.5 and padj < 0.05. Gene Ontology (GO) and Kyoto Encyclopedia of Genes and Genomes enrichment analyses were performed, and padj < 0.05 was considered significantly enriched. The RNA-seq results were validated by quantitative real-time polymerase chain reaction (qRT-PCR).
Results: A total of 47 and 218 genes were significantly differentially expressed in the liver and lung. Eight GO terms were enriched in the liver and lung, and retinol metabolism and the peroxisome proliferator-activated receptor (PPAR) signaling pathway were shared in different tissues.
Discussion: According to DEGs and pathway enrichment analyses, inflammation might be induced in liver and lung tissues after intravenous injection of ZnO QDs. These findings will be helpful for future research and application of ZnO QDs.
Keywords: ZnO QDs, transcriptome, differentially expressed genes
Introduction
Quantum dots (QDs) have received much attention recently, as they have unique optical and physical properties.1 The presence of heavy metals makes commercially available Cd-based QDs potentially toxic.1 ZnO QDs have drawn much attention because they are Cd-free, low cost, and have excellent optical properties.2,3 They have been explored in biomedical applications, including fluorescent probes, clinical diagnostics, and drug delivery.4 Their small size and high specific surface area make QDs more reactive, and more complex interaction with biological systems.5 The widespread application of ZnO QDs has raised concerns regarding their safety.6
Changes in genome expression could favorably reflect if an organism responds to a particular abiotic condition.7 Traditional methods only provide limited information on specific biological processes or well-defined molecular pathways,8 while transcriptome sequencing (RNA-seq) can rapidly identify global changes in gene expression.9 Transcriptome analysis helps us understand the genome at the transcription level, including gene structure, function and expression regulation and genome plasticity.10 RNA-seq technology is becoming more popular in toxicology, but still has little application to evaluate the effects of QDs in biological systems.8
According to our study and previous reports, QDs are predominantly trapped in the liver and lung.11–13 The aims of this study were, using advanced whole-genome transcriptional profiling, to investigate the modulation of gene expression in the liver and lung after treatment with ZnO QDs. The changed transcripts were used to infer the toxicity, in view of the functions of appropriate genes. The results of RNA-seq were validated by quantitative real-time polymerase chain reaction (qRT-PCR). A schematic of the experimental design has been given in Figure 1.
 |
Figure 1 Schematic illustration of the study design. Abbreviations: QDs, quantum dots; GO, Gene Ontology; KEGG, Kyoto Encyclopedia of Genes and Genomes; qRT-PCR, quantitative real-time polymerase chain reaction. |
Materials and Methods
Materials
ZnO QDs were synthesized as described in our previous study.11 The characterization of ZnO QDs was described in Supplemental Material. Normal saline (NS, 0.9%) was supplied by Double-Crane Pharmaceutical Co. Ltd. (Beijing, China).
Animals and Treatment
Male Kunming mice aged 6–8 weeks (body weight 22–24 g) were supplied by the Animal Center of Henan Province (Zhengzhou, China). The animals were housed (4 or 5/cage) in a controlled environment at a temperature of 22 ± 1°C and 50–60% humidity with food and water ad libitum, under a 12-h light–dark cycle. The animal experimental procedures were in accordance with the guidelines for “The Research of Toxicity of ZnO Quantum Dots in Mice” approved by the Committee of Medical Ethics and Welfare for Experimental Animals of Henan University School of Medicine (Number: HUSOM2017-221). The animal experiment was performed in accordance with the guidelines of the China Council on Animal Care and Use.
For the experiments, animals were randomly divided into a control group (NS) and treatment group (20 mg/kg ZnO QDs), with six animals in each. Mice were injected with a total volume of 100 μL via the tail vein. After 24 h, mice were sacrificed. Liver and lung samples were excised, and immediately frozen in liquid nitrogen for RNA-seq.
RNA Extraction
Total RNA was extracted using TRIzol reagent (Invitrogen, Carlsbad, CA, USA). RNA degradation and contamination were monitored on 1% agarose gel. The purity of RNA was checked with a NanoPhotometer spectrophotometer (Implen, Westlake Village, CA, USA). The RNA concentration was measured with a Qubit 2.0 Fluorometer (Life Technologies, Carlsbad, CA, USA). The integrity of RNA was assessed with an Agilent 2100 bioanalyzer (Santa Clara, CA, USA).
Library Preparation and Sequencing
Twelve cDNA libraries were constructed from liver and lung tissue samples from ZnO QDs treated and control mice, n=3. Three micrograms of RNA per sample was used as input for RNA sample preparation. The fragmentation of mRNA was obtained using NEBNext First Strand Synthesis Reaction Buffer (Ipswich, MA, USA). M-MuLV reverse transcriptase and a random hexamer primer were used to synthesize the first-strand cDNA. The second-strand cDNA was synthesized with DNA polymerase I and RNase H. After adenylation of the 3′ ends of the DNA fragment, cDNA was ligated with NEBNext adaptor and 150–200-bp cDNA fragments were obtained. PCR was performed using Phusion High-Fidelity DNA Polymerase, universal PCR primers, and index (X) primer. The PCR products were purified by the AMPure XP system (Beckman Coulter, Beverly, MA, USA), and the library quality was assessed with the Agilent Bioanalyzer 2100 system. Clustering was performed on a cBot Cluster Generation System using the TruSeq PE Cluster Kit v3-cBot-HS (Illumina Inc., San Diego, CA, USA). The libraries were sequenced on an Illumina HiSeq 4000 platform (Novogene, Beijing, China).
Transcriptome Data Analysis
Raw reads of the FASTQ format were processed using in-house Perl scripts to obtain clean reads (removing reads containing adapter and poly-N, as well as low-quality reads from the raw data). The Q20, Q30 and GC contents of the clean reads were calculated, and all of the downstream analyses were based on the high-quality clean reads. Reference genome and annotation files were downloaded from the NCBI website. HISAT was used to map the reads to each gene.
The gene expression levels were estimated according to FPKM (fragments per kilobase of exon per million fragments mapped). The differential expression between the ZnO QDs treated and control groups was obtained using DESeq2.14 The P value was adjusted using Benjamini and Hochberg’s approach, and padj <0.05 and fold change >1.5 were set as the thresholds for significant differential expression.
Gene Ontology (GO) and Kyoto Encyclopedia of Genes and Genomes (KEGG) Enrichment Analysis
GO enrichment of the differentially expressed genes (DEGs) was performed by GOSeq R Package.15 GO terms categorized the DEGs functions into three structured controlled vocabularies: biological processes (BP), cellular components (CC) and molecular function (MF). GO terms with padj <0.05 were considered significantly enriched. KEGG is a database that can identify metabolic pathways and signal transduction pathways related to the DEGs. Pathway analysis was conducted using the hypergeometric test in the KOBAS software,16 and padj <0.05 indicated significant enrichment.
qRT-PCR
The RNA-seq results were validated by qRT-PCR. Total RNA was extracted using the TRIzol method and quantified using a NanoDrop 2000 UV-Vis Spectrophotometer (Thermo Scientific, Wilmington, DE, USA). One microgram of total RNA was reverse transcribed to synthesize cDNA using the High Capacity cDNA Reverse Transcription kit (Applied Biosystems, Foster City, CA, USA). qRT-PCR was performed with the 7500HT Thermal Cycler and SYBR Green Master Mix (TaKaRa Biotechnology, Dalian, China). The specific quantitative primers for 11 transcripts were shown in Table 1. The gene of 36B4 was chosen as the internal reference. Dissociation curve analysis was performed after each qRT-PCR. Each experiment was performed in triplicate. The normalized expression of the target genes was calculated using 2−ΔΔCT. An unpaired t-test was used to test the difference between the ZnO QDs treated and control groups. p < 0.05 was considered statistically significant.
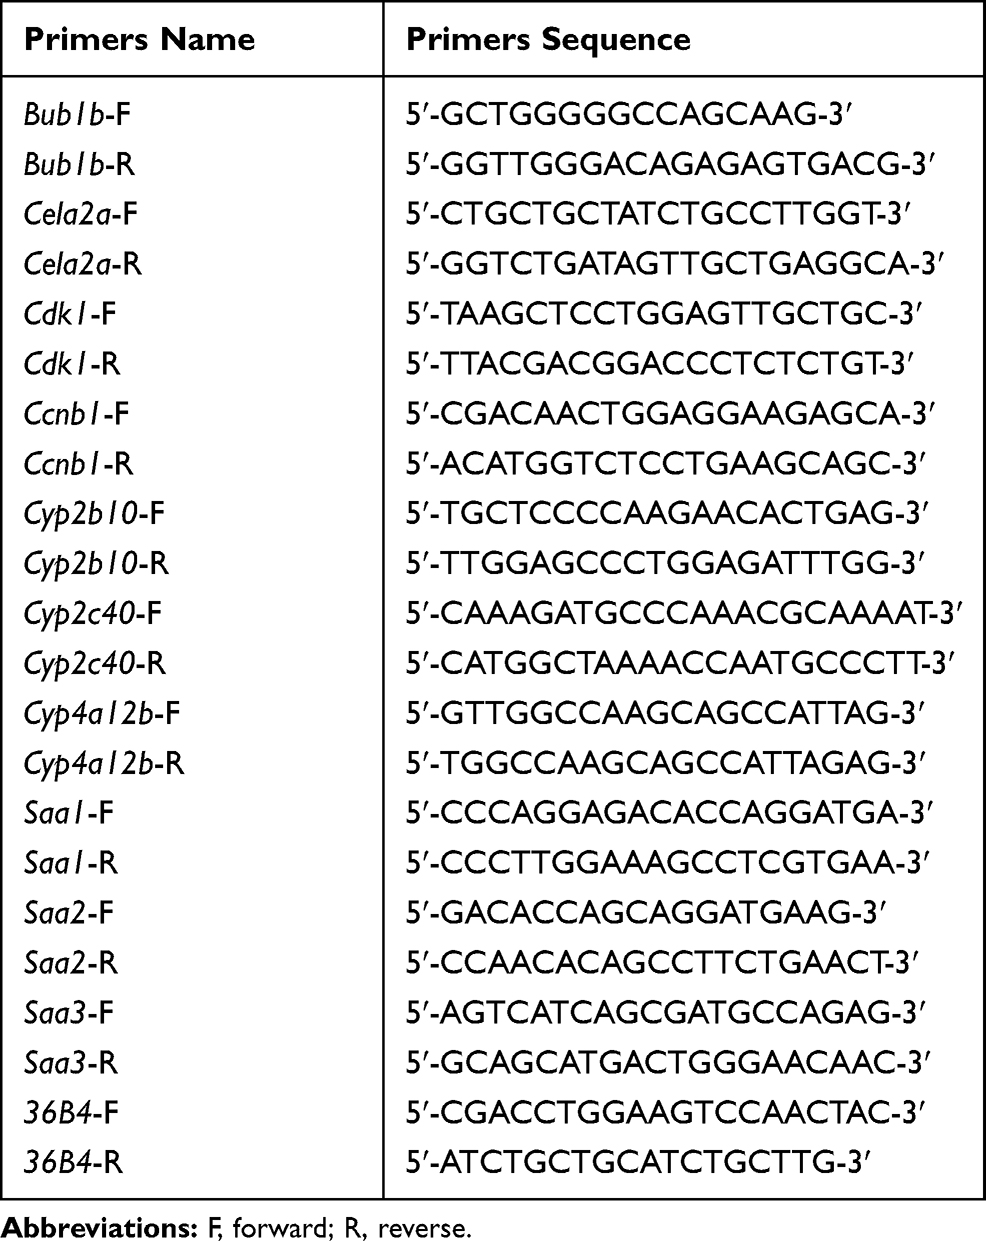 |
Table 1 Primers Sequence Used for Quantitative Real-Time Polymerase Chain Reaction (qRT-PCR) |
Results
Overview of RNA-Seq
The average diameter of ZnO QDs is approximately 5.4 nm according to transmission electron microscopy (TEM, Figure S1A) and dynamic light scattering (DLS, Figure S1B), and their strong fluorescence is centered at 525 nm and excitation maximum at 360 nm (Figure S1C).
To assess the toxic effect of ZnO QDs on transcriptomes, liver and lung tissue samples were collected and analyzed after 24 h exposure. An overview of the sequencing is outlined in Table 2. A total of 60–81 million raw reads was generated in liver tissue, and 55–70 million in lung tissue. After discarding the reads with adapters, poly-N, and low-quality reads, 58–80 million clean reads in the liver and 54–69 million clean reads in the lung were obtained. The clean reads were mapped to the mouse reference genome in NCBI, and the mapping rates were approximately 94% (Table 3). The abundance of all the genes in the liver (25,901) and in the lung (29,374) was calculated as the FPKM, and the FPKM values were used to produce a box plot (Figure 2). The expression levels of all the genes were similar between the control group and ZnO QDs treated group in the liver (Figure 2A) and lung samples (Figure 2B).
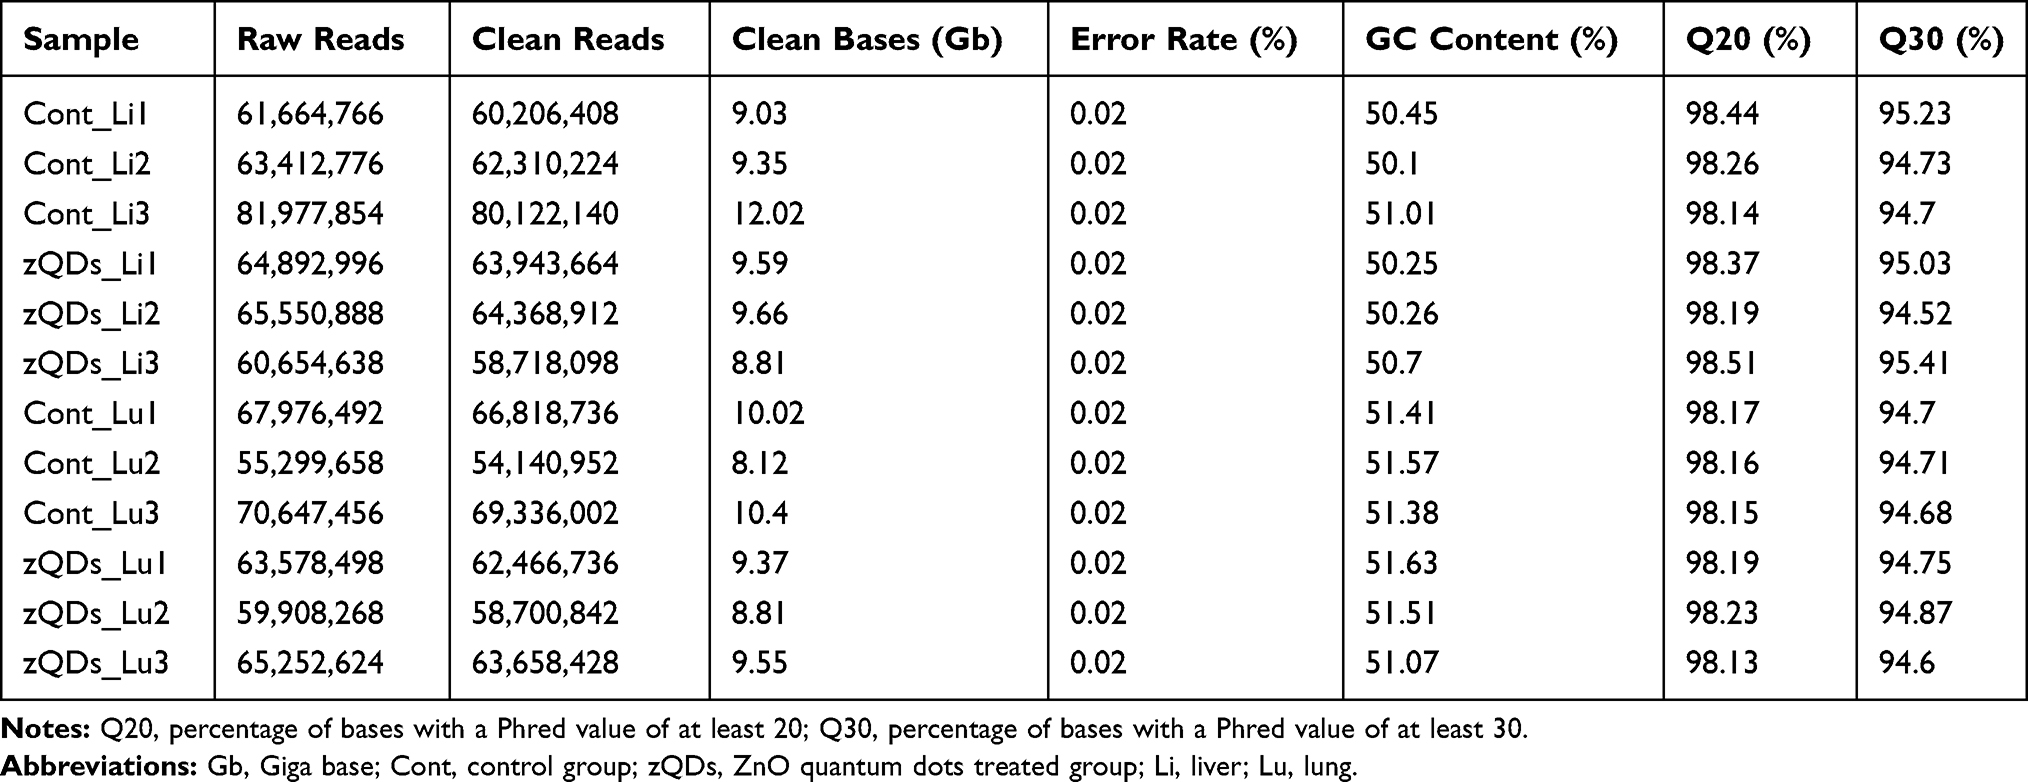 |
Table 2 Summary of the Sequence Assembly After Illumina Sequencing |
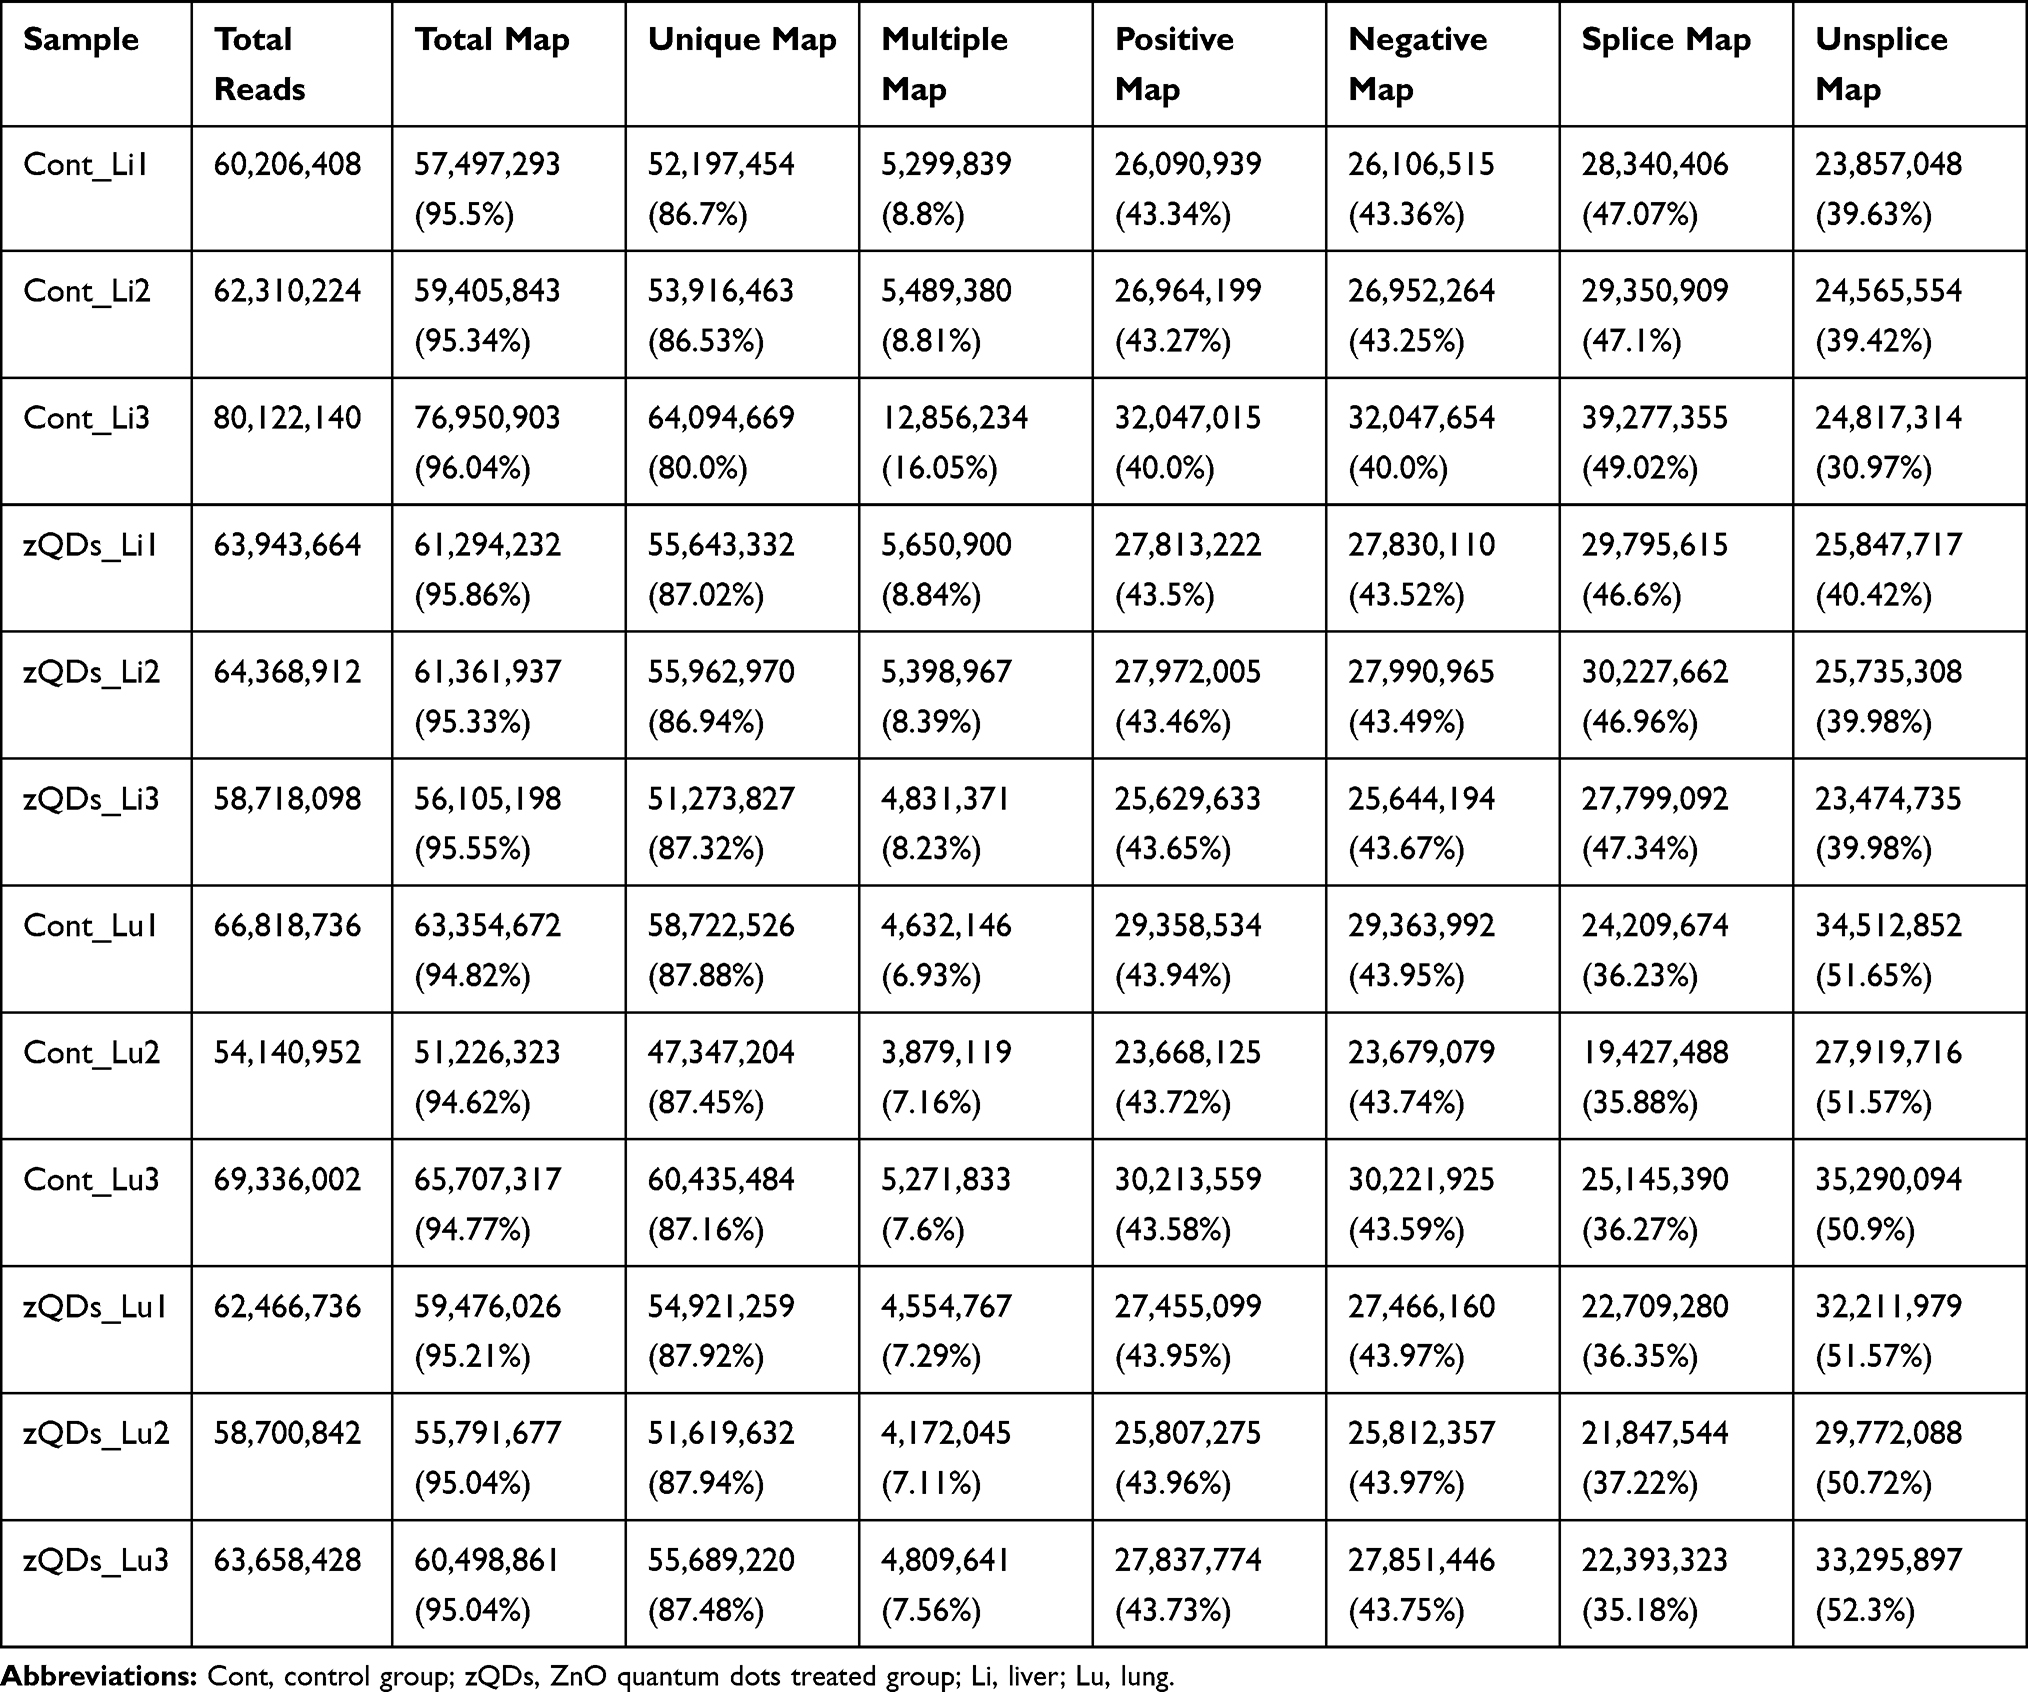 |
Table 3 Overview of Mapping Status of Gene Expression Reads |
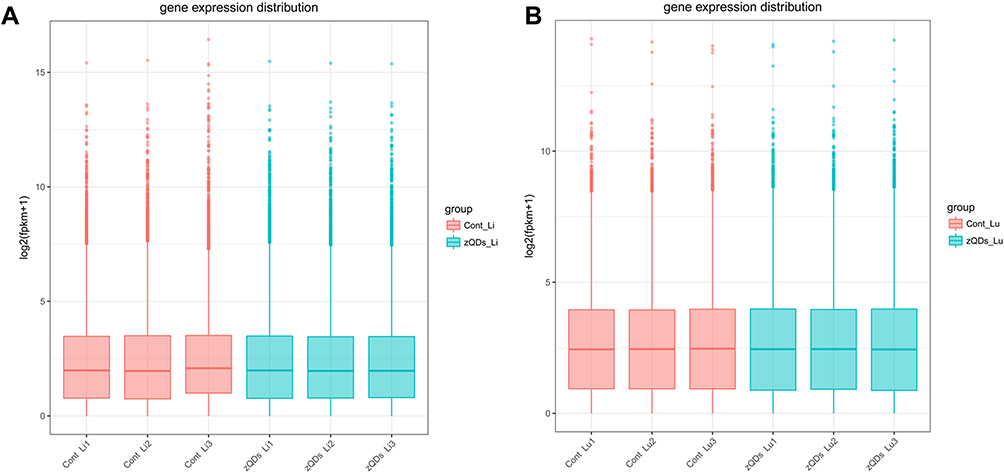 |
Figure 2 Boxplot showing expression level of transcripts in liver (A) and lung (B) tissues. Each box represents maximum value, upper quartile, median, lower quartile and minimum value. FPKM, fragments per kilobase of exon per million fragments mapped. Abbreviations: Cont, control group; zQDs, ZnO quantum dots treated group; Li, liver; Lu, lung. |
DEGs Analysis
DEGs in the control and ZnO QDs treated groups were identified using the DEGSeq R package. Fold change >1.5 and padj <0.05 were set as the thresholds for significant differential expression. A total of 47 genes were significantly differentially expressed in the liver between the control and ZnO QDs treated mice, including 24 upregulated and 23 downregulated genes. Meanwhile, 218 genes were identified as significantly differentially expressed in the lung, of which 151 were upregulated and 67 downregulated. To observe the gene expression patterns, cluster analysis of all the DEGs based on the log10(FPKM+1) was conducted with heat maps for the liver (Figure 3A) and lung (Figure 3B). A Venn diagram (Figure 3C) revealed the shared eight DEGs for both liver and lung tissue after ZnO QDs treatment. Among these, the four significantly upregulated genes were identified as Cenpm, Steap4, Saa2 and Saa1, while the four significantly downregulated genes were identified as Gm15501, LOC101055915, Cyp4a12b and Cyp4a32. All eight DEGs in the liver and lung are shown in Figure 3D and E.
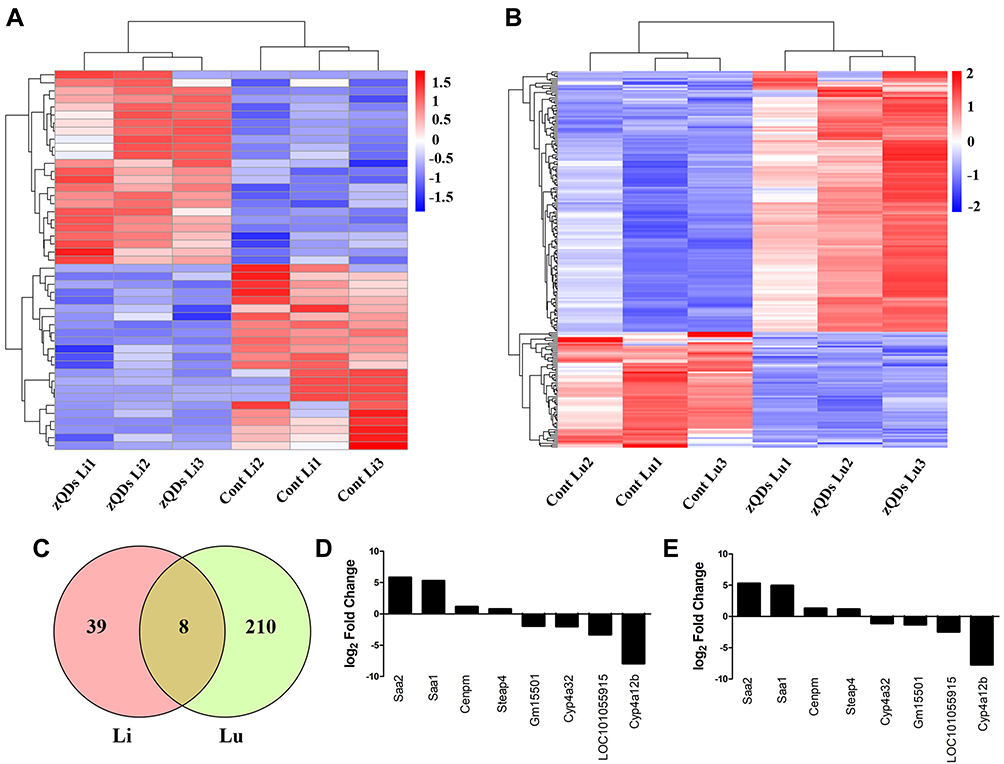 |
Figure 3 Differential expressions of genes (DEGs) in response to ZnO QDs treatment. (A) Hierarchical clustering of DEGs in the liver based on log10(FPKM+1) values. Blue color indicates a decreased expression of genes and red color indicates an increased expression at 24 h after ZnO QDs treatment. (B) Hierarchical clustering of the DEGs in the lung. (C) Venn diagram showing the overlapping DEGs between the liver and lung. (D) The expression of shared DEGs in the liver. (E) The expression of shared DEGs in the lung. Fold Change >1.5 and padj < 0.05 were set as the threshold for significant differential expression of genes. Abbreviations: Cont, control group; zQDs, ZnO quantum dots treated group; Li, liver; Lu, lung. |
Functional Annotation of DEGs
GO and KEGG pathway analyses were performed on 47 DEGs in the liver to determine the function of DEGs and metabolic pathway enrichment. We obtained 23 highly enriched GO terms (padj <0.05), including arachidonic acid metabolic process and activity (GO:0019369, GO:0008392, GO:0008391), and oxidoreductase activity (GO:0016705, GO:0016709, GO:0016712) (Figure 4A). Significantly enriched pathways (padj <0.05) were arachidonic acid metabolism, retinol metabolism, chemical carcinogenesis, steroid hormone biosynthesis, and peroxisome proliferator-activated receptor (PPAR) signaling pathway (Figure 5A).
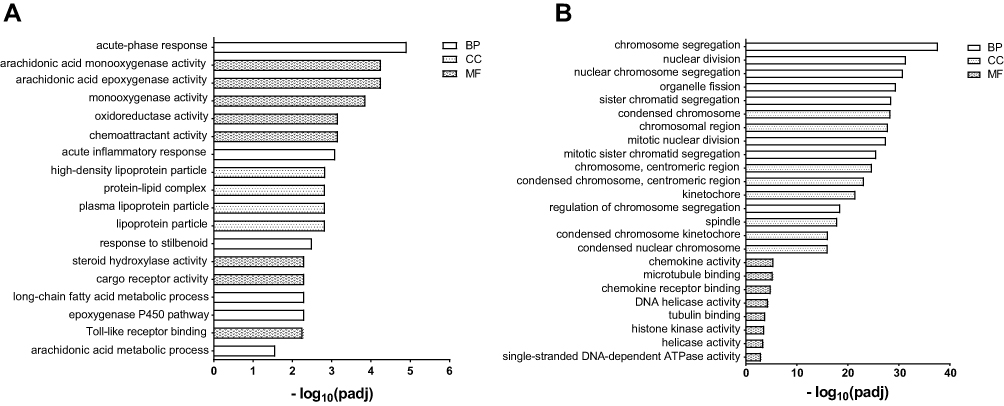 |
Figure 4 Significantly enriched Gene Ontology (GO) terms. (A) liver, (B) lung. The top eight terms of biological processes (BP), cellular components (CC) and molecular function (MF) are shown. GO terms with padj < 0.05 were considered significantly enriched. |
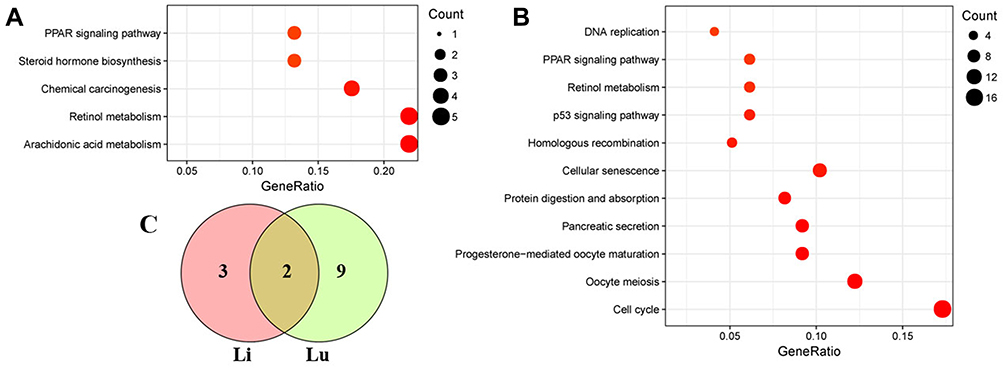 |
Figure 5 Scatterplot of enriched KEGG pathways. (A) liver, (B) lung. (C) Venn diagram showing the overlapping pathways between the liver and lung samples. The size of the dots represents the gene number. Only significantly enriched pathways are shown (padj < 0.05). Abbreviations: KEGG, Kyoto Encyclopedia of Genes and Genomes; PPAR, peroxisome proliferator-activated receptor; Li, liver; Lu, lung. |
GO and pathway enrichment analyses were also carried out to explore the functions of 218 DEGs in the lung. The top eight terms of BP, CC and MF are shown in Figure 4B. A Venn diagram (Figure S2) revealed the shared eight GO terms for liver and lung tissue, and these terms are listed in Table 4. A total of 11 pathways were significantly enriched (padj <0.05) in the lung, including cell cycle, protein digestion and absorption, cellular senescence, homologous recombination, p53 signaling pathway, retinol metabolism, PPAR signaling pathway, and DNA replication (Figure 5B). A Venn diagram (Figure 5C) revealed the shared two pathways (retinol metabolism and PPAR signaling pathway) for liver and lung tissue.
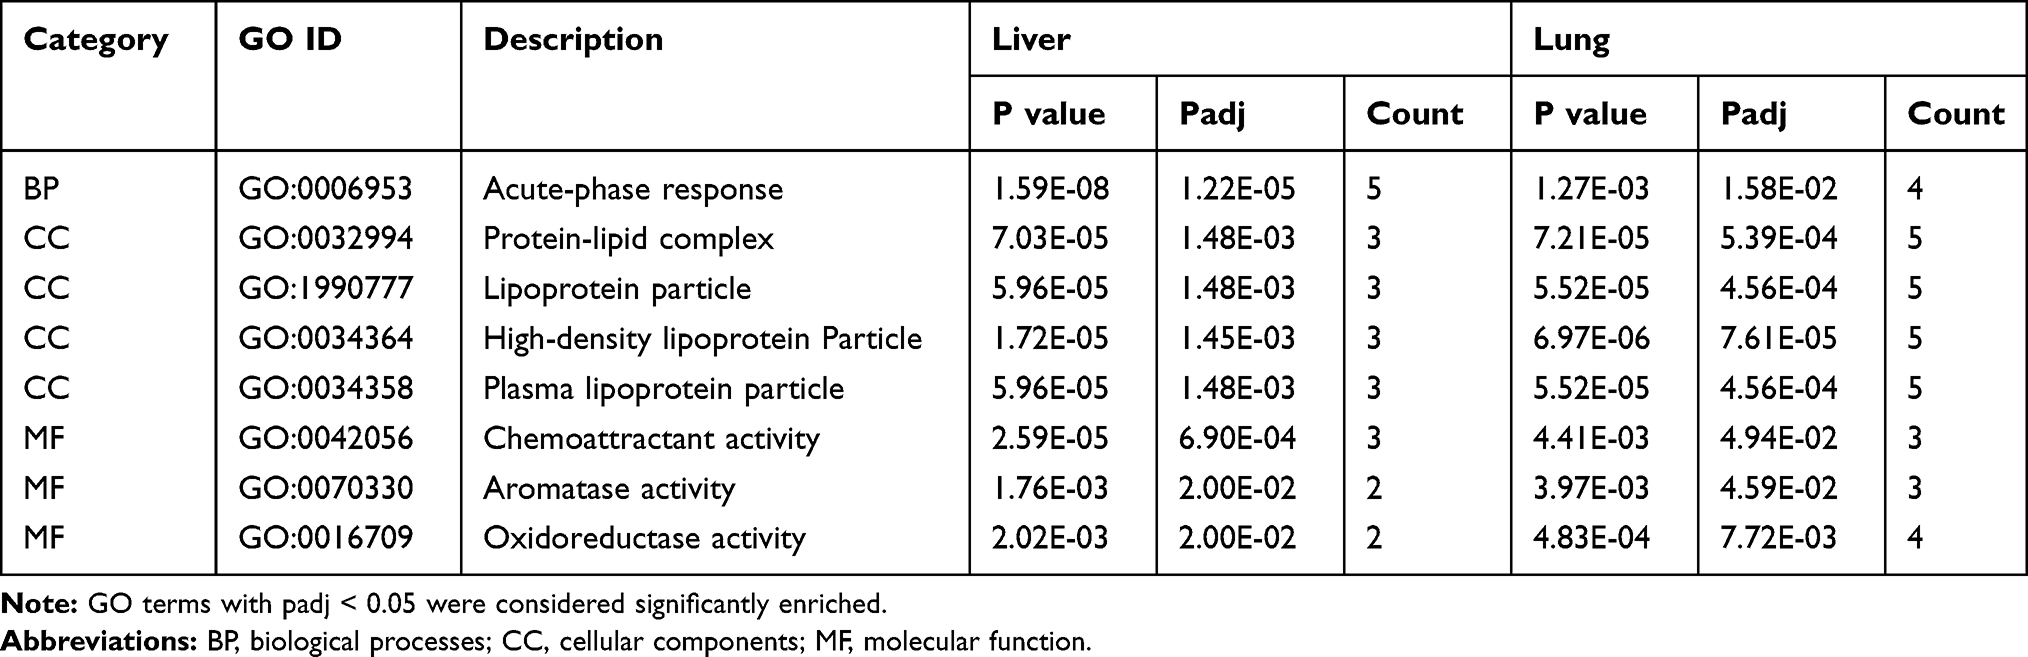 |
Table 4 List of the Shared Eight Gene Ontology (GO) Terms |
Quantitative Assessment
qRT-PCR was performed to validate the accuracy of RNA-seq. Cyp4a12b and Saa1 were randomly selected from the DEGs shared between the liver and lung tissue samples. Meanwhile, we randomly selected Saa3, Cyp2b10, Cyp2c40 and Saa2 from DEGs only in the liver (Figure 6A), and Cdk1, Bub1b, Ccnb1 and Cela2a from DEGs only in the lung (Figure 6B). All the qRT-PCR results of these genes were consistent with Illumina sequencing data, except for Saa1 in the lung.
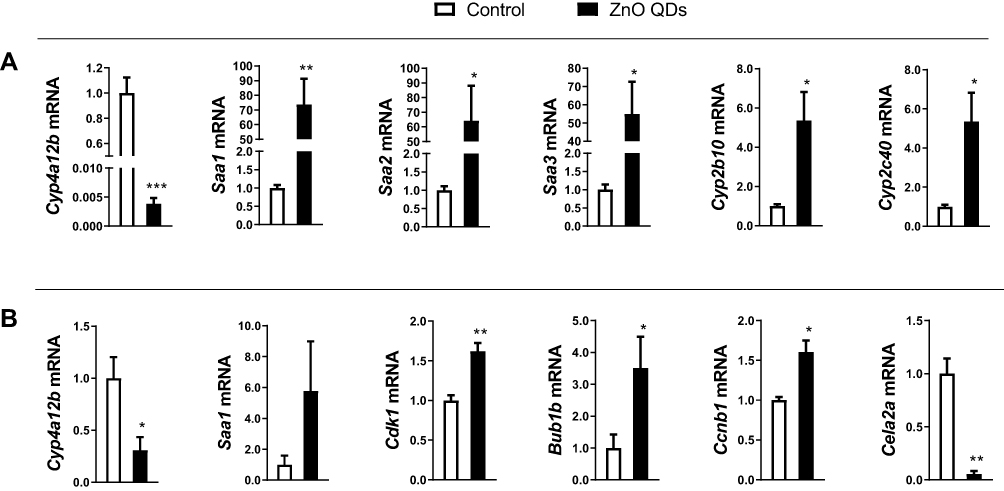 |
Figure 6 Quantitative real-time PCR validation of transcript expression. (A) liver, (B) lung. The relative expression of the target gene was normalized against 36B4. All data are presented as mean ± SEM (n = 3). *p < 0.05, **p < 0.01 and ***p < 0.001 according to the unpaired t-test between the ZnO QDs treated and control group. Abbreviations: PCR, polymerase chain reaction, QDs, quantum dots. |
Discussion
According to previous reports, QDs are predominantly accumulated in the liver and lung after intravenous injection.11–13 The primary goal of this research was to investigate and compare by RNA-seq the toxic effect of ZnO QDs on global gene expression in the liver and lung.
In the liver, 25,901 genes were mapped, and the gene expression levels of the control and treatment groups were similar. Compared with the control group, 47 genes were significantly differentially expressed after ZnO QDs injection. qRT-PCR confirmed that RNA-seq results were of high quality. Cytochrome P450 enzymes (CYPs) are a superfamily of heme–thiolate monooxygenases, which are involved in an NADPH-dependent electron transport pathway. CYPs are predominantly expressed in the liver, and play important roles in biosynthetic pathways for natural products, drug metabolism, and degradation of xenobiotics.17,18 Treatment with ZnO QDs induced dysregulation of Cyp2b10, Cyp2b13, Cyp2c40, Cyp4a12b and Cyp4a32 genes in the liver. CYP1, CYP2 and CYP3 families mediated metabolism of xenobiotics, and excess expression of related genes suggested that the mice were in a stressed condition.17 Serum amyloid A is an acute-phase protein that is increased dramatically with inflammation.19,20 According to the upregulated expression of Saa1, Saa2 and Saa3, we speculated that ZnO QDs induced acute inflammation in the liver. The Zn finger protein 36 (tristetraprolin; TTP) is one of the best-studied members of the Zn finger family, and plays an important role in the inflammatory response.21 The upregulated expression of TTP mRNA in the liver may relieve the inflammation induced by ZnO QDs.
A total of 29,374 genes were mapped, and 218 DEGs were detected in the lung at 24 h after ZnO QDs treatment. Cells divide after irreversible transitions through four discrete phases, G1, S, G2 and M.22 Nine cell division cycle related genes (Cdc20, Cdc25c, Cdc45, Cdc6, Cdca2, Cdca3, Cdca5, Cdca7 and Cdca8) were significantly upregulated in the lung of ZnO QDs treated mice. Meanwhile, expression of cyclin B1, cyclin B2, cyclin E1 and cyclin F was also upregulated. Kif14, Kif18b, Kif20b, Kif22, Kif23 and Kif2c were upregulated, which code microtubule-based motor proteins, involved in cell division, ciliogenesis, and vesicle transport.23 We detected that eight genes of the C-C motif and C-X-C motif chemokine ligand family were upregulated, such as Ccl2 and Cxcl10. They are all potent recruiters of monocytes, T cells and dendritic cells to the sites of tissue damage or infection.6
Only eight DEGs were identified in both the liver and lung, including Saa2 and Saa1, indicating that ZnO QDs would induce inflammation in global tissues. After exposure to ZnO QDs, the genes of the cytochrome P450 4A subfamily (Cyp4a12b and Cyp4a32), which are important in lipid homoeostasis and signaling,24 were differentially expressed in different tissues. Cyp4a12b and Cyp4a32 were on the retinol metabolism and PPAR signaling pathways, and both were significantly enriched in KEGG pathway analysis. The PPAR signaling pathway could play a protective role under inflammatory conditions.25
Conclusion
We investigated the effect of ZnO QDs on global gene expression of liver and lung tissue by RNA-seq. The number of DEGs detected in the lung was larger than that in the liver. According to DEGs analysis, ZnO QDs may induce inflammation in both the liver and lung, and significantly affect cell cycle related genes in the lung. qRT-PCR confirmed that our RNA-seq results were of high quality.
Funding
This work was supported by research funds from the National Natural Science Foundation of China (Grant No. 81971280 and No. 81600974), and the Key Science and Technology Program of Henan Province in China (Grant No. 182102310593, No. 192102310080, and No. 202102310213).
Disclosure
The authors have no conflicts of interest to declare.
References
1. Mirnajafizadeh F, Ramsey D, McAlpine S, et al. Nanoparticles for bioapplications: study of the cytotoxicity of water dispersible CdSe(S) and CdSe(S)/ZnO quantum dots. Nanomaterials. 2019;9(3):465. doi:10.3390/nano9030465
2. Wang Y, He L, Yu B, et al. ZnO quantum dots modified by pH-activated charge-reversal polymer for tumor targeted drug delivery. Polymers. 2018;10(11):1272. doi:10.3390/polym10111272
3. Roshini A, Jagadeesan S, Cho Y-J, et al. Synthesis and evaluation of the cytotoxic and anti-proliferative properties of ZnO quantum dots against MCF-7 and MDA-MB-231 human breast cancer cells. Mater Sci Eng C Mater Biol Appl. 2017;81:551–560. doi:10.1016/j.msec.2017.08.014
4. Roshini A, Jagadeesan S, Arivazhagan L, et al. pH-sensitive tangeretin-ZnO quantum dots exert apoptotic and anti-metastatic effects in metastatic lung cancer cell line. Mater Sci Eng C Mater Biol Appl. 2018;92:477–488. doi:10.1016/j.msec.2018.06.073
5. Foldbjerg R, Irving ES, Hayashi Y, et al. Global gene expression profiling of human lung epithelial cells after exposure to nanosilver. Toxicol Sci. 2012;130(1):145–157. doi:10.1093/toxsci/kfs225
6. Dominguez-Gutierrez PR, Ceribelli A, Satoh M, et al. Elevated signal transducers and activators of transcription 1 correlates with increased C-C motif chemokine ligand 2 and C-X-C motif chemokine 10 levels in peripheral blood of patients with systemic lupus erythematosus. Arthritis Res Ther. 2014;16(1):R20. doi:10.1186/ar4448
7. Simon DF, Domingos RF, Hauser C, et al. Transcriptome sequencing (RNA-seq) analysis of the effects of metal nanoparticle exposure on the transcriptome of chlamydomonas reinhardtii. Appl Environ Microbiol. 2013;79(16):4774–4785. doi:10.1128/aem.00998-13
8. Wu T, He K, Ang H, et al. Impairments of spatial learning and memory following intrahippocampal injection in rats of 3-mercaptopropionic acid-modified CdTe quantum dots and molecular mechanisms. Int J Nanomedicine. 2016;11:2737–2755. doi:10.2147/ijn.s104985
9. Ambrosone A, Roopin M, Pelaz B, et al. Dissecting common and divergent molecular pathways elicited by CdSe/ZnS quantum dots in freshwater and marine sentinel invertebrates. Nanotoxicology. 2017;11(2):289–303. doi:10.1080/17435390.2017.1295111
10. Casamassimi A, Federico A, Rienzo M, et al. Transcriptome profiling in human diseases: new advances and perspectives. Int J Mol Sci. 2017;18(8):1652. doi:10.3390/ijms18081652
11. Yang Y, Lan J, Xu Z, et al. Toxicity and biodistribution of aqueous synthesized ZnS and ZnO quantum dots in mice. Nanotoxicology. 2014;8(1):107–116. doi:10.3109/17435390.2012.760014
12. Lee C-M, Jang D, Cheong S-J, et al. Surface engineering of quantum dots for in vivo imaging. Nanotechnology. 2010;21(28):285102. doi:10.1088/0957-4484/21/28/285102
13. Salykina YF, Zherdeva VV, Dezhurov SV, et al. Biodistribution and clearance of quantum dots in small animals. In: Tuchin VV, Genina EA, editors. Saratov Fall Meeting 2010: Optical Technologies in Biophysics and Medicine Xii. 2011;7999:UNSP799908.
14. Love MI, Huber W, Anders S. Moderated estimation of fold change and dispersion for RNA-seq data with DESeq2. Genome Biol. 2014;15(12):550. doi:10.1186/s13059-014-0550-8
15. Young MD, Wakefield MJ, Smyth GK, Oshlack A. Gene ontology analysis for RNA-seq: accounting for selection bias. Genome Biol. 2010;11(2):R14. doi:10.1186/gb-2010-11-2-r14
16. Mao XZ, Cai T, Olyarchuk JG, Wei LP. Automated genome annotation and pathway identification using the KEGG Orthology (KO) as a controlled vocabulary. Bioinformatics. 2005;21(19):3787–3793. doi:10.1093/bioinformatics/bti430
17. Sharifian S, Homaei A, Kamrani E, et al. New insights on the marine cytochrome P450 enzymes and their biotechnological importance. Int J Biol Macromol. 2020;142:811–821. doi:10.1016/j.ijbiomac.2019.10.022
18. Li Z, Jiang Y, Guengerich FP, et al. Engineering cytochrome P450 enzyme systems for biomedical and biotechnological applications. J Biol Chem. 2020;295(3):833–849. doi:10.1074/jbc.REV119.008758
19. Witkowska-Pilaszewicz OD, Zmigrodzka M, Winnicka A, et al. Serum amyloid A in equine health and disease. Equine Vet J. 2019;51(3):293–298. doi:10.1111/evj.13062
20. Vietri L, Fui A, Bergantini L, et al. Serum amyloid A: a potential biomarker of lung disorders. Respir Investig. 2020;58(1):21–27. doi:10.1016/j.resinv.2019.09.005
21. Ok K, Li W, Neu HM, et al. The role of gold in inflammation and tristetraprolin activity. Chemistry. 2020;26(7):1535–1547. doi:10.1002/chem.201904837
22. Arata Y, Takagi H. Quantitative studies for cell-division cycle control. Front Physiol. 2019;10:1022. doi:10.3389/fphys.2019.01022
23. Zhou Q, Yu J, Zheng Q, et al. Kinesin family member 3A stimulates cell proliferation, migration, and invasion of bladder cancer cells in vitro and in vivo. FEBS Open Bio. 2019;in press. doi:10.1002/2211-5463.12768
24. Zhang Y, Klaassen CD. Hormonal regulation of Cyp4a isoforms in mouse liver and kidney. Xenobiotica. 2013;43(12):1055–1063. doi:10.3109/00498254.2013.797622
25. Wahli W, Michalik L. PPARs at the crossroads of lipid signaling and inflammation. Trends Endocrinol Metab. 2012;23(7):351–363. doi:10.1016/j.tem.2012.05.001
 © 2020 The Author(s). This work is published and licensed by Dove Medical Press Limited. The
full terms of this license are available at https://www.dovepress.com/terms
and incorporate the Creative Commons Attribution
- Non Commercial (unported, 3.0) License.
By accessing the work you hereby accept the Terms. Non-commercial uses of the work are permitted
without any further permission from Dove Medical Press Limited, provided the work is properly
attributed. For permission for commercial use of this work, please see paragraphs 4.2 and 5 of our Terms.
© 2020 The Author(s). This work is published and licensed by Dove Medical Press Limited. The
full terms of this license are available at https://www.dovepress.com/terms
and incorporate the Creative Commons Attribution
- Non Commercial (unported, 3.0) License.
By accessing the work you hereby accept the Terms. Non-commercial uses of the work are permitted
without any further permission from Dove Medical Press Limited, provided the work is properly
attributed. For permission for commercial use of this work, please see paragraphs 4.2 and 5 of our Terms.