Back to Journals » Clinical Ophthalmology » Volume 14
Functional and Structural Outcomes at the Foveal Avascular Zone with Optical Coherence Tomography Following Macula off Retinal Detachment Repair
Authors Maqsood S ![]() , Elalfy M, Abdou Hannon A
, Elalfy M, Abdou Hannon A ![]() , Hegazy SM
, Hegazy SM ![]() , Elborgy ES
, Elborgy ES
Received 13 July 2020
Accepted for publication 11 September 2020
Published 13 October 2020 Volume 2020:14 Pages 3261—3270
DOI https://doi.org/10.2147/OPTH.S271944
Checked for plagiarism Yes
Review by Single anonymous peer review
Peer reviewer comments 3
Editor who approved publication: Dr Scott Fraser
Sundas Maqsood,1 Mohamed Elalfy,1– 3 Ahmed Abdou Hannon,2 Sherif Momtaz Hegazy,2 Ebrahim Salah Elborgy2
1Queen Victoria Hospital, East Grinstead, UK; 2Research Institute of Ophthalmology, Giza, Egypt; 3Maidstone and Tunbridge Wells Hospitals, Tunbridge Wells, UK
Correspondence: Mohamed Elalfy
Research Institute of Ophthalmology, 2 El Ahram Street, Giza 12557, Cairo, Egypt
Tel +202-35718304
Email [email protected]
Background: Visual recovery following macula involving rhegmatogenous retinal detachment remains poorly understood. The aim of this work is to correlate the functional and the anatomical changes in retinal vasculature in the foveal avascular zone using optical coherence tomography angiography (OCTA) after successful retinal reattachment repair and correlate this data with retinal thickness and post-operative visual recovery.
Methods: A prospective, comparative observational study of 28 eyes of 14 patients with 14 eyes undergoing macula off retinal detachment repair with pars plana vitrectomy, endo-laser and silicone oil-based tamponade compared with 14 fellow healthy eyes at 1, 6 and 12 weeks post-operative period. The study was conducted at the Research Institute of Ophthalmology, Giza, Egypt between February 2018 and August 2018.
Results: The foveal avascular zone (FAZ) area in the patients group was not significantly different compared to the control group and was found to be negatively correlated with the central retinal thickness in both the study and control group. The superficial capillary plexus (SCP) area at the FAZ was significantly larger than the deep capillary plexus (DCP) area at the FAZ in both the study and control group over the follow-up period. The DCP area at the FAZ was significantly larger at the 3rd follow-up than the 1st follow-up. The SCP FAZ area was significantly larger than the DCP FAZ area in both the study and control group over the follow-up period. BCVA was found to be negatively correlated to the retinal thickness of the temporal 3 mm paracentral quadrant with no correlation with central foveal thickness (CFT) and the FAZ area.
Conclusion: Optical coherence tomography (OCT) and OCTA are valuable noninvasive imaging tools to monitor and predict the structural changes at the foveal avascular zone during the recovery phase after successful retinal reattachment involving macula.
Keywords: optical coherence tomography, OCT, optical coherence tomography angiography, OCTA, foveal avascular zone, FAZ, superficial capillary plexus, SCP, deep capillary plexus, DCP, central foveal thickness, CFT
Introduction
Visual impairment after successful retinal surgery has been extensively studied, several factors have been attributed to the final visual outcomes like the macular status, duration and height of macular detachment and the pre-operative visual acuity. Post-operative development of cystoid macular edema (CME) and epiretinal membranes (ERM) are well known causes of secondary visual impairment.1 The primary success rates for rhegmatogenous retinal detachment (RRD) repair by pars plana vitrectomy (PPV) has been reported to range from 64% to 96%.2–4 Metanalysis and prospective randomized controlled studies have shown the superiority of PPV techniques over classic scleral surgery in the treatment of primary RRD.5–7
Over the past few decades, advancing imaging technologies incorporating optical coherence tomography have revolutionized our understanding of retinal layers and histological changes in detached retinas and following retinal detachment repair.8,9 Wolfensberger et al applied optical coherence tomography (OCT) to study the discrepancy between successful anatomical retina reattachment and incomplete visual recovery.10 Other reports have also shown that incomplete post-operative visual recovery is not relatively uncommon despite clinically successful retinal reattachment.11 A number of studies utilizing OCT found that residual sub-foveal fluid and distortion of outer retinal layers during the healing process are common causes for delayed and incomplete visual recovery.9,12
Optical coherence tomography angiography (OCTA) is a novel noninvasive imaging modality utilizing optical coherence tomography based on the principle of motion detection. It is capable of providing high resolution imaging of retinal and choroidal blood flow.13 The human retinal capillary network is composed of distinct layers of vessels and capillaries including the superficial (inner), and the deep (outer) vascular plexus (SCP and DCP respectively).14 Studies on the foveal avascular zone (FAZ) utilizing the OCTA have demonstrated its correlation with central retinal thickness (CRT) and visual acuity in normal healthy population.14
The aim of this work is to correlate the functional and the anatomical changes in retinal vasculature in the foveal avascular zone at SCP and DCP level using OCTA after successful retinal reattachment repair and correlate this data with post-operative visual recovery.
Methods
A prospective, comparative observational study of 28 eyes of 14 patients (14 eyes with macula off retinal detachment repair and 14 fellow healthy eyes) attending the Ophthalmology outpatient clinic at Research Institute of Ophthalmology, Giza, Egypt between February 2018 to August 2018.
The study was approved as a prospective audit by the local institutional review board at Research Institute of Ophthalmology, Giza, Egypt and adhered to the Declaration of Helsinki. All patients provided informed consent for the enrolment in the study. All patients between the ages of 18 to 60 years and with primary macula-off rhegmatogenous retinal detachment were included in the study. Patients with high axial myopia (axial length more than 28mm), pre-existing macular pathology (e.g. age-related macular degeneration, vascular occlusive disease, primary macular hole or associated with RRD, diabetic retinopathy), other ocular co morbidities (e.g. uveitis, glaucoma, optic neuropathies), previous retinal surgery or laser, traumatic retinal detachment, retinal detachment of more than 6 months duration, patients with proliferative vitreoretinopathy grade (C) or worse, post-operative traction changes caused by epiretinal membranes and media opacity hindering OCTA imaging were excluded from the study.
All patients underwent detailed history evaluation, best-corrected vision (BCVA), axial length calculation with A scan, and complete anterior and posterior segment ocular examination in line with the exclusion criteria. Eyes were then divided into two groups; the study group with macula off retinal detachments underwent 23 gauge pars plana vitrectomy (PPV) with endo-laser around the breaks and silicone oil injection and a control group of normal healthy fellow eyes of the studied subjects. All patients underwent regular clinical follow-ups at 1, 6 and 12 weeks post-operative with evaluation of BCVA, slit lamp biomicroscopy, intraocular pressure measurement and imaging with spectral domain optical coherence tomography (SD-OCT) and angiography (OCTA).
OCT and OCTA Protocol
All patients had (SD-OCT) and angiography (OCTA) of the macula using Heidelberg engineering, OCT spectralis (Germany) at 1, 6 and 12 weeks post-operative period. The imaging protocols for “OCT2 module” used on SD-OCT were macular radial; to detect the single point central foveal thickness (SPCFT) and macular thickness map for measurement of central foveal thickness (CFT) among all retinal layers. CFT was measured automatically as the central 1mm sub-field thickness of the early treatment diabetic retinopathy study (ETDRS) layout. Also the paracentral 3 mm of the ETDRS layout was measured in each quadrant; nasal, superior, temporal and inferior. All these measurements were calculated automatically by the software and in cases where the software had difficulty recognizing the landmarks, manual corrections were made.
OCTA of the superficial and deep capillary plexus were captured and were distinctly evaluated using the automatic layer segmentation done by the machine. A 3×3 mm2 image centred on the macula was acquired using 256 x 256 A scan mode with a scan speed of 85,000 per second. Images were processed using the HEYEX V 6.4 a software.
The SCP was segmented from inner limiting membrane (ILM) to inner nuclear layer (INL), and the DCP was segmented from the INL to outer plexiform layer (OPL). The foveal avascular zone (FAZ) area was measured in both layers using software “Draw region” tool to outline the FAZ area (inner border of the most visible central blood capillaries) manually, the outlined area was then automatically calculated by the software. This manual measurement was done by two independent masked investigators. The average of their measurements were calculated and used to optimize the study results.
Statistical Analysis
Statistical Package for Social Science (IBM SPSS) version 23 was used for statistical analysis. The quantitative data were presented as mean, standard deviations and ranges when their distribution was found to be parametric. Also qualitative variables were presented as number and percentages. The measurement of interobserver reliability of FAZ area calculations were tested by using intraclass correlation coefficients (ICCs). The comparison between two independent groups with quantitative data and parametric distribution was done by using Independent t-test. The comparison between more than two paired groups with quantitative data and parametric distribution was done by using a repeated measures ANOVA test followed by post hoc analysis using a Bonferroni test. Spearman correlation coefficients were used to assess the correlation between two quantitative parameters in the same groups. The confidence interval was set to 95% and the margin of error accepted was set to 5%. A p value of <0.05 was considered statistically significant.
Results
Fourteen eyes undergoing PPV, endo-laser and silicone oil-based endotamponade were compared to the fourteen healthy fellow eyes of the same patients (9 males, 5 females) as controls between February 2018 to August 2018 at Research Institute of Ophthalmology, Giza, Egypt. The mean age of the patients 48.93 ± 13.06 (range 18–60 years). The mean ± SD time of retinal detachment before surgery was 20.5 ± 10.9 days (range 7–45 days).
BCVA (LogMar) showed a highly significant statistical improvement over time in the study group compared to the baseline stable control with mean LogMar of 1.02 ± 0.22, 0.63 ± 0.28 and 0.51 ± 0.24 at 1, 6 and 12 weeks follow-up periods (p-value = 0.000).
The mean FAZ area in both the SCP and DCP in the study group was not found to be statistically larger than the control group during the follow-up period. The superficial FAZ measurements through the follow-up were 0.4 ± 0.18, 0.45 ± 0.15 and 0.47 ± 0.2, respectively (p value = 0.172). On the other hand, the deep FAZ measurements through the follow-up were 0.29 ± 0.13, 0.31 ± 0.13 and 0.33 ± 0.13, respectively, with a highly significant larger deep FAZ area at the 3rd follow-up compared to the 1st follow-up (with p value = 0.009). The interobserver repeatability measurements of the FAZ area in both SCP and DCP of the study and control groups were found to be “good” for FAZ in SCP (ICC = 0.811 and 0.822) and in DCP (ICC = 0.819 and 0.826) respectively. Figure 1 shows the comparative analysis of FAZ at SCP and DCP levels through the three follow-up time points in a single patient from the study.
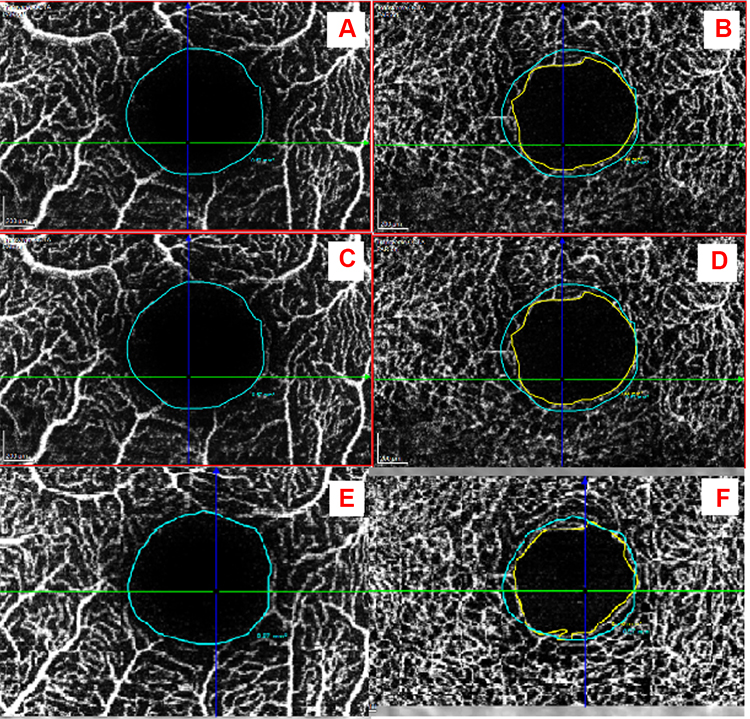 |
Figure 1 Shows the FAZ area of one patient. (A) SCP of affected eye at 1st follow-up, (B) DCP of affected eye at 1st follow-up, (C) SCP of affected eye at 2nd follow-up, (D) DCP of affected eye at 2nd follow-up, (E) SCP of affected eye at 3rd follow-up, (F) DCP of affected eye at 3rd follow-up. (Blue outline for SCP FAZ, yellow outline for DCP). |
However, it was found that the SPCFT, subfield CFT and paracentral 3 mm thickness in all quadrants and in all three planes of all, inner and outer retinal layers to be significantly thinner in the study group versus the control group at all follow-up periods. Except no statistically significant difference was found between study and control group in the temporal quadrant in paracentral 3 mm EDTRS layout in the second follow-up which was found to be significantly thinner in the study group. During the third follow-up this temporal quadrant showed no significant difference between the study and control groups. Table 1 shows the comparison of BCVA, OCT and OCTA analysis of SCP and DCP and FAZ.
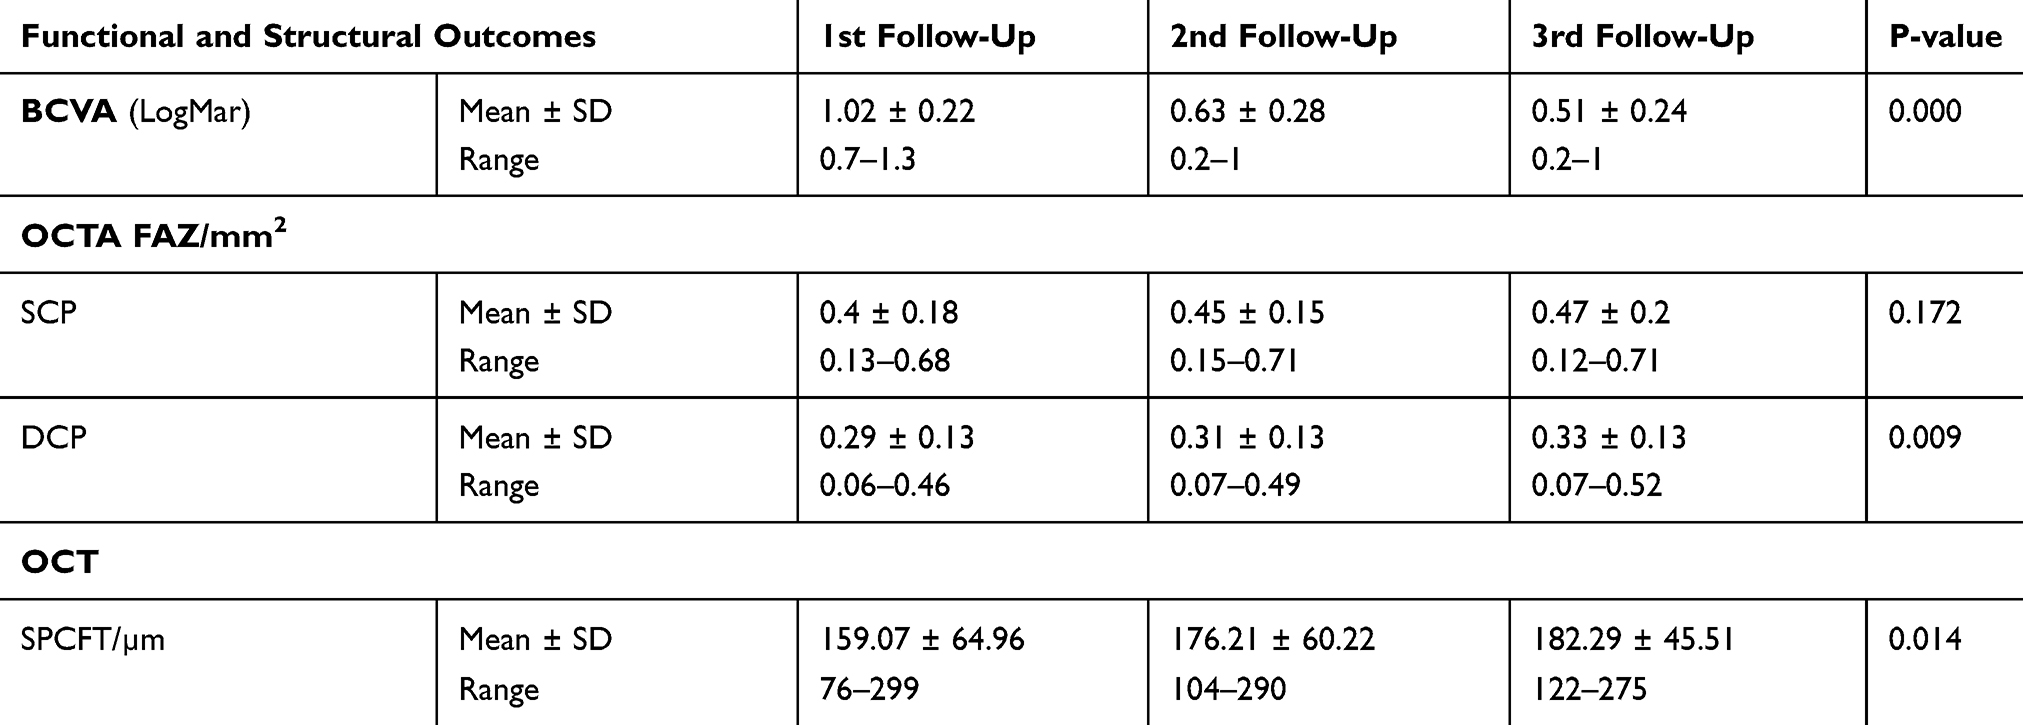 |
Table 1 Comparison of Best-Corrected Visual Acuity (BCVA) and Foveal Avascular Zone (FAZ) Area, Superficial Capillary Plexus (SCP), Deep Capillary Plexus (DCP) and Single Point Central Foveal Thickness (SPCFT) |
The percentage of change of the FAZ area (in both SCP and DCP) and the percentage of change of the central retinal thickness measurements (SPCFT and subfield CFT) over the follow-up period was found to have no significant correlation (p-value > 0.05). At 1 week, it was found that the superficial and deep FAZ area had a statistically significant negative correlation with subfield CFT of all retinal layers (p-value < 0.01), inner retinal layers (p-value < 0.01) and outer retinal layers (p-value < 0.05). At 6 weeks, the superficial and deep FAZ area had a statistically significant negative correlation with only subfield CFT of all retinal layers (p-value < 0.05 for SCP FAZ, p-value < 0.01 for DCP FAZ) and inner retinal layers (p-value < 0.01) and no significant correlation was found concerning the outer retinal layers (p-value > 0.05). At 12 weeks, the deep FAZ area was significantly negatively correlated with SPCFT (p-value < 0.05). The superficial and deep FAZ area had a statistically significant negative correlation with only subfield CFT of all retinal layers (p-value < 0.01) and inner retinal layers (p-value < 0.01) and no significant correlation was found concerning the outer retinal layers (p-value > 0.05). Figure 1 shows the detailed SCP and DCP analysis and measurements of a single patient from the study at three time points of follow-up period. Figure 2 shows a detailed analysis of correlation of FAZ area and central retinal thickness measurements at the three follow-up periods.
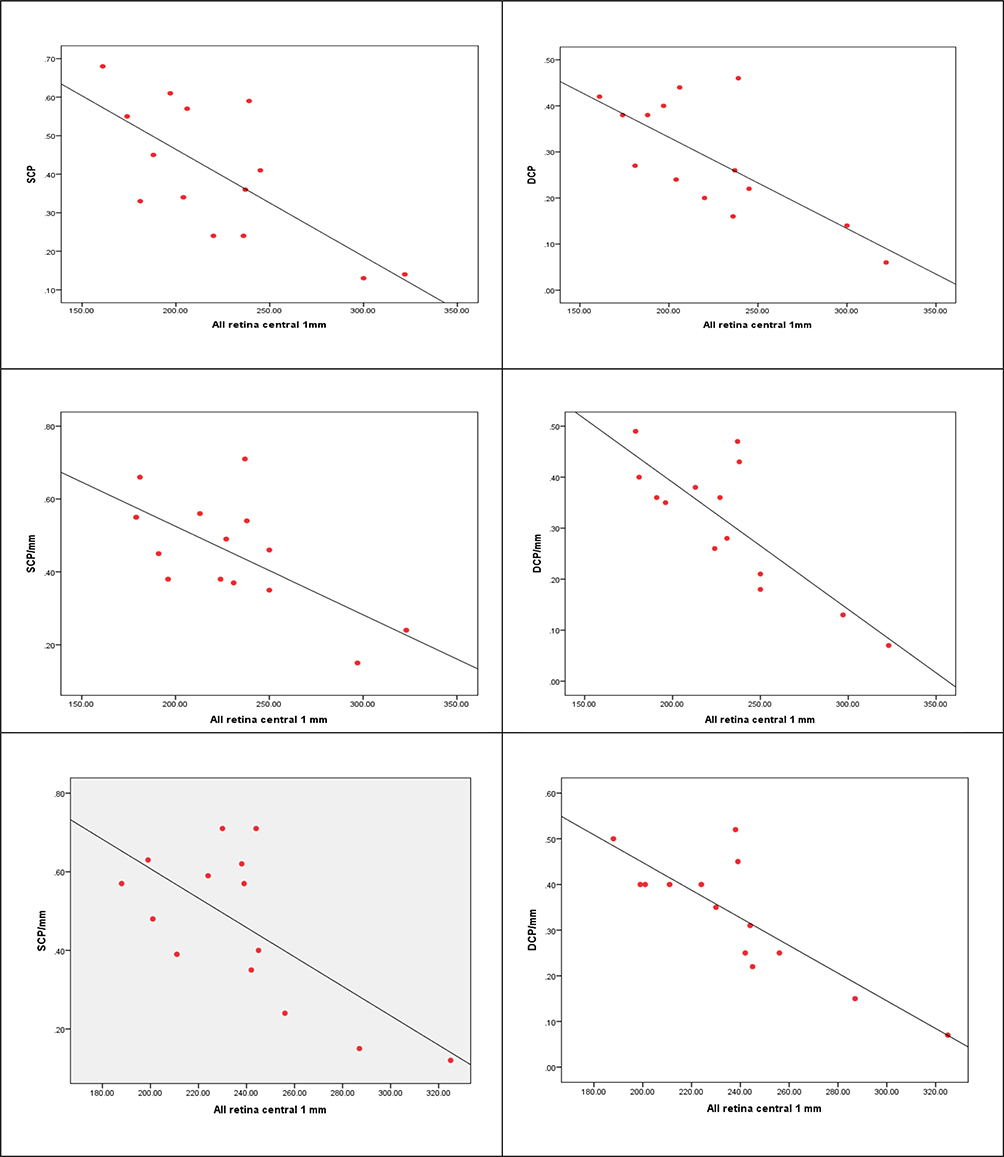 |
Figure 2 Correlation between FAZ area of SCP and DCP and subfield CFT of all retinal layers at the 1st follow-up (A, B) 2nd follow-up (C, D) and 3rd follow-up (E, F). |
Figure 3 summarizes the SCP and DCP changes in the post-operative period in the study and control group.
 |
Figure 3 Comparison between SCP and DCP FAZ area/mm2 of the patients group at the 1st follow-up (A), 2nd follow-up (B), 3rd follow-up (C) and controls (D). |
It was found that the superficial and deep FAZ area in controls had a statistically significant negative correlation with only subfield CFT of all retinal layers (p-value < 0.05 for SCP FAZ, p-value < 0.01 for DCP FAZ) and inner retinal layers (p-value < 0.01) and no significant correlation was found concerning the outer retinal layers (p-value > 0.05).
No significant correlation was found between BCVA (LogMar) and deep or the superficial FAZ area at any of the three follow-up time points. On the other hand, a negative significant correlation between BCVA (LogMar) and only the thickness of the paracentral 3 mm temporal quadrant in the ETDRS layout of all retinal layers and inner retinal layers at the 1st and 3rd follow-up (P-value = 0.044 and 0.050 and P-value = 0.037 and 0.037, respectively). Figure 3 summarizes the SCP and DCP changes in the post-operative period in the study and control group.
Table 2 summarizes the Spearman correlation coefficients between BCVA, time from detachment, percentage change in SCP, DCP and SPCFT and retinal thickness with SCP and DCP FAZ area changes.
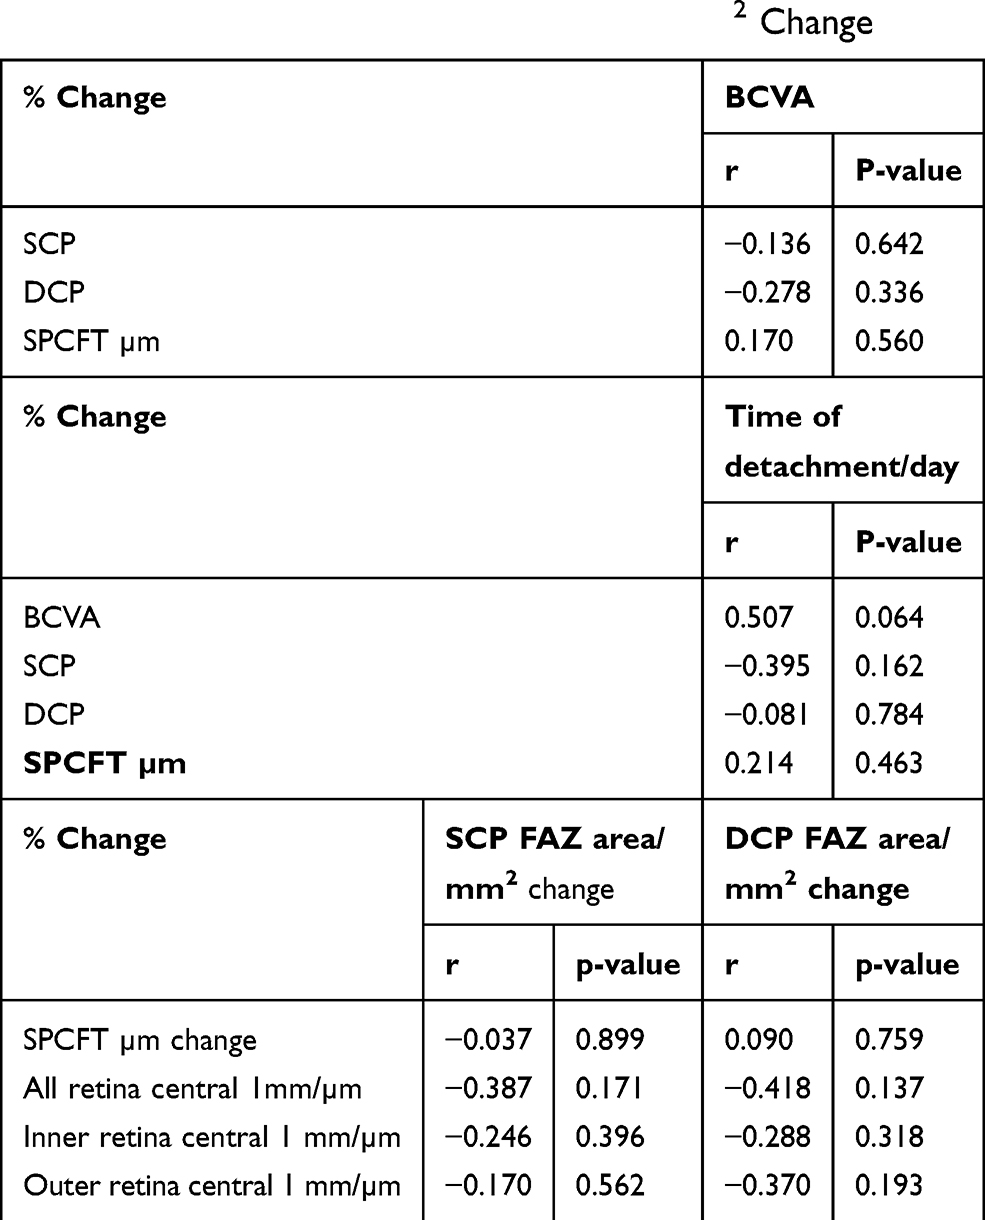 |
Table 2 Correlation Between Percentage Change in SCP, DCP, SPCFT, BCVA, Duration of Detachment and These Changes Corresponding to SCP and DCP FAZ Area/mm2 Change |
No significant correlation was found between the percentage of change of BCVA and the percentage of change of the FAZ area (superficial and deep) or the percentage of change of any of the retinal thickness measurements (SPCFT, 1.3 ETDRS layout of the central retinal thickness of all retinal layers, inner retinal layers and outer retinal layers) during the follow-up period.
No significant correlation was found between duration of retinal detachment and percentage of change of FAZ area (superficial and deep) or the percentage of change of any of the retinal thickness measurements described above at any follow-up period.
Discussion
Rhegmatogenous retinal detachment (RRD) has been studied as a progressive process involving cellular changes. Histological studies have confirmed regeneration of photoreceptor outer segments (OS) often in a disorganized fashion following successful reattachment surgery.15 These ultrastructural changes involving disruption of photoreceptor-retinal pigment epithelial (RPE) interface can persist for several years explaining the correlation with poorer visual outcomes.16
The introduction of SD-OCT has enabled ophthalmologists to study the in vivo structural changes in the retinal tissue affected by various pathologies. It has been used in the past to monitor the recovery process on the ultrastructural level after successful retinal reattachment surgery.9 OCTA has been shown to be a noninvasive modality to evaluate the microvasculature of the retina at superficial and deep level.
The detached retina suffers from hypoxia at two levels, primarily outer layers deprived from essential nutrients by the sub-retinal fluid (SRF) escaping from breaks and causing retinal elevation. On the other hand, inner retinal layers nourished by DCP may also suffer from relative hypoxia as its perfusion pressure is lower, being derived from venous collecting channels and due to its location in the watershed area.17 Other vascular changes reported in detached retina include vasopermeability due to increased levels of inflammatory mediators like prostaglandins and cytokines in SRF, vasospasm and even vascular occlusion.18–20 The fovea has been reported to suffer a significant thinning after RRD, improving slowly and not always completely following retinal reattachment.9,15
In the current study, we found that central retinal thickness was significantly reduced in comparison to the controls after reattachment surgery in macula-off RRD. This significant thinning was found in the subfield CFT of all, inner and outer retinal layers, and in the paracentral 3 mm 4 quadrants of all, inner and outer retinal layers. Dell’Omo et al also confirmed foveal thinning 1 month after successful reattachment of macula-off RRD but they also demonstrated a later significant increase in central foveal thickening comparable to healthy fellow eyes at one year post-operative visit.9 The early outer layer thinning could be explained by cone cell bodies migration as a response to RRD, while the subsequent increase in thickness can be attributed to proliferation of muller cells and photoreceptor recovery.21,22 We did not find any significant difference in the outer retinal layer's thickness between the first and the third follow-up visit. However, SPCFT increased significantly (P < 0.05) and subfield CFT of all retinal layers and outer retinal layers also increased significantly (P = 0.04 and P = 0.01, respectively). On the other hand, Woo and Sato did not show any significant change in CFT following macula off retinal reattachment in the early post-operative period, up to 6 months.17,23
This study showed a significant increase in both BCVA and retinal thickness over the follow-up period with no correlation found between BCVA and retinal thickness measurements except within the 3 mm paracentral temporal quadrant in the ETDRS layout. This correlation was found at the level of all and inner (not outer) retinal layers at 1st and 3rd follow-up (r = −0.545; P < 0.05, r = −0.533; P < 0.05 and r =−0.560; P < 0.05, r = −0.562 P < 0.05, respectively). However, no significant correlation was found between the percentage of change (improvement) of both BCVA and the retinal thickness. Dell’Omo et al,9 on the contrary, correlated BCVA with ellipsoid zone (EZ)-RPE distance at 1 and 12 months after RD repair (Pearson’s coefficient = −0.817, P < 0.01 and −0.582, P = 0.003, respectively), and BCVA improvement with the regeneration of outer retinal thickness. (Pearson = −0.444; P = 0.03) over their follow-up.
Previous studies which implemented the use of OCTA to study the normal vasculature have reported that the FAZ area is larger in the DCP than in SCP.14,24 Our study, on the contrary, confirmed a larger FAZ area in SCP compared to DCP in the studied group. There could be multiple contributory factors to explain this finding as these studies were performed on bigger study samples (70 and 170 respectively) and their mean ages were 42 (range: 12–76 years) and 22.5 (range: 21–30) respectively compared to ours which was 22.5 (range: 21–30). Additionally, different OCT devices and techniques for FAZ area calculation can also contribute to this difference.
OCTA-based studies confirm a significant negative correlation of superficial and deep FAZ area with central macular thickness (CMT) in normal population.17,24,25 Our study noticed also that both superficial and deep FAZ are negatively correlated with subfield CFT in both study and control groups through the 3 follow-up time points. On the contrary, Sato reported in his study that only the superficial plexus at FAZ was negatively correlated with the subfield CFT at 1st, 3rd and 6th months after RRD repair but the deep FAZ had no significant correlation with subfield CFT post-operatively at the same follow-up intervals. He postulated this to be a reaction to ischemic changes affecting the more vulnerable DCP of the detached retina.23 Studies by Woo and Suren et al reported that DCP FAZ area was larger post RRD macula-off repair than that of the control group in a smaller follow-up period of up to 2 months.17,26 Both these studies, attributed the ischemic insult caused by RRD affecting the DCP due to its vulnerable location at the watershed zone. Although the ischemic theory may indeed be explanatory, morphologic changes could also play a major role. Dubis et al explored a relationship between the FAZ and foveal excavation. He hypothesized that size of the FAZ influences the degree of foveal excavation which affects the compactness of outer cones and therefore the visual function.27 The use of silicone oil as a tamponade may affect the vascular integrity especially of the DCP. This is proved by Lee et al where they demonstrated progressive enlargement of the FAZ area which significantly correlated with the duration of Silicone tamponade.28
Woo et al also confirmed a larger DCP FAZ is significantly correlated with post-operative BCVA, especially in patients with quite regular outer retinal bands. To the contrary, Sato findings matched those of our study where no significant correlation between the FAZ area and vision post-operatively among the 3 follow-up periods was noted.24. Although, BCVA (LogMar) showed a significant improvement over the 3 follow-up intervals in both studies, the discrepancy of correlation between BCVA and FAZ area may be due to different number of patients in each study and the different OCT devices used to assess the FAZ area. Table 3 describes a comparison study between this study and some recent literature on a similarly treated group of RRD.29–31
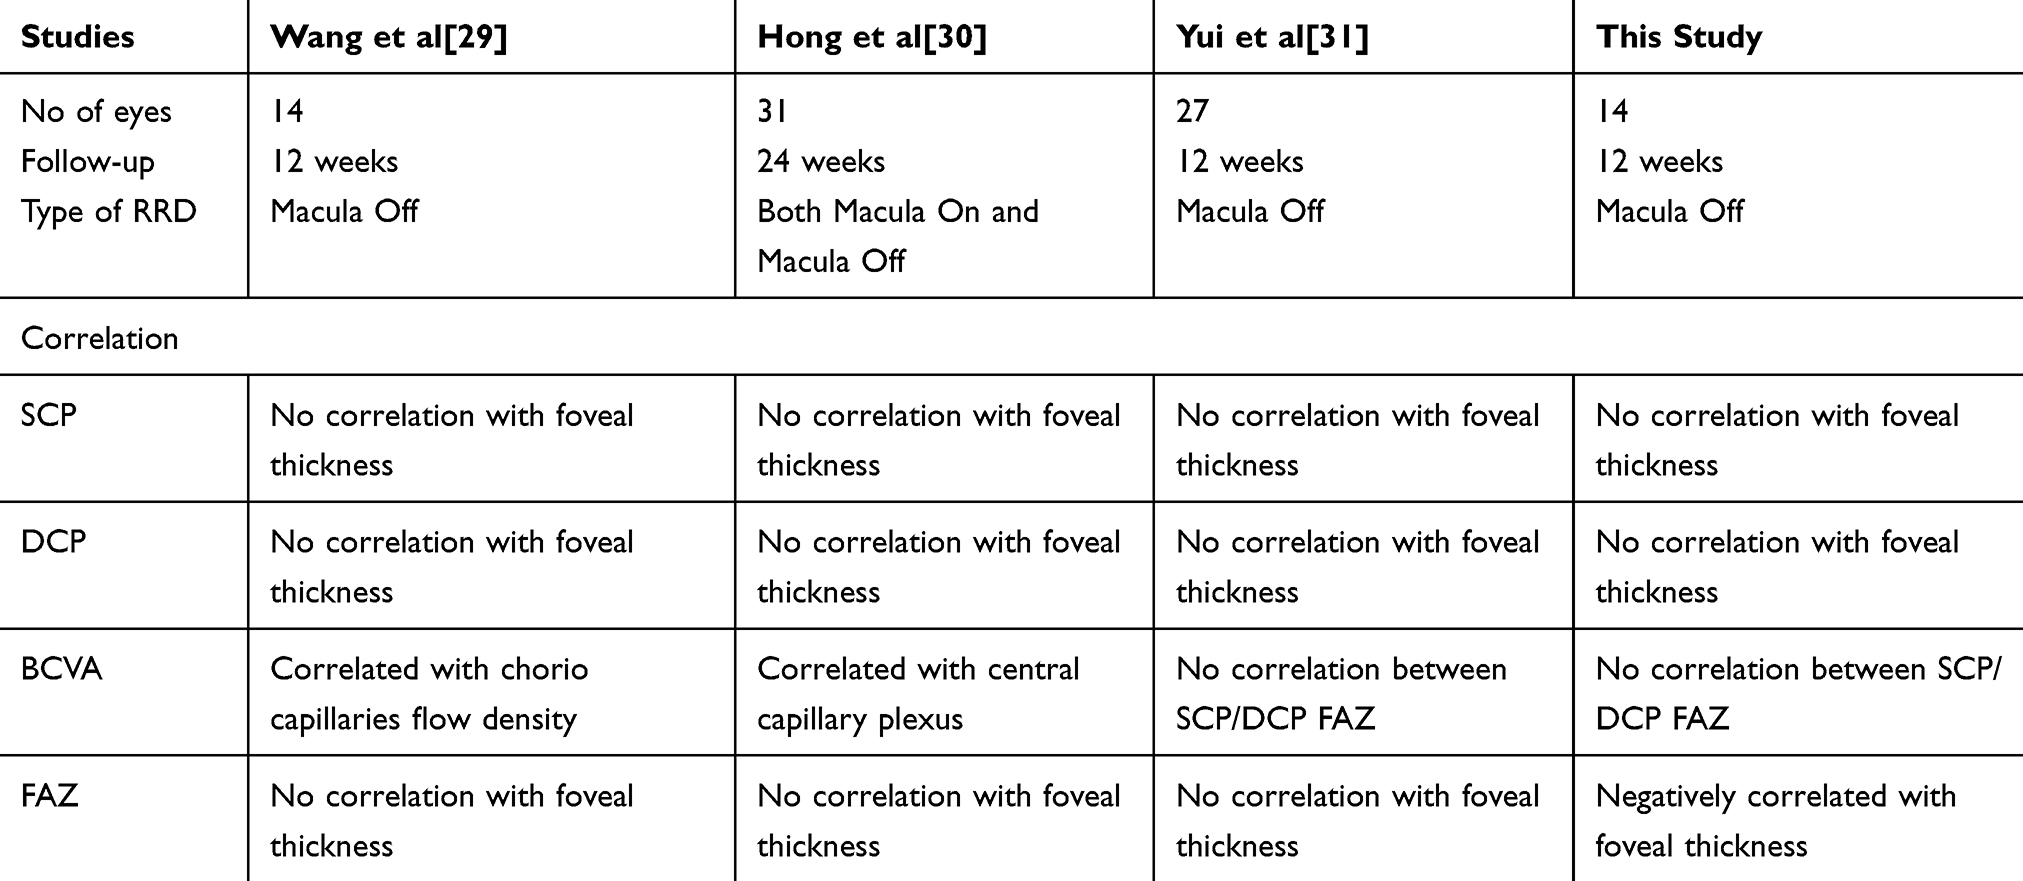 |
Table 3 Comparison Table of Current Study with Recent Published Literature |
This study has some limitations in its design related due to the small sample size and shorter follow-up compared to some previous studies. Use of silicone oil-based tamponade in all cases may cause some imaging artifacts and can affect post-operative vision. The BCVA assessment in our study was performed with Snellen’s and later on converted to LogMar which may contribute to a discrepancy when comparing results with similar studies which used LogMar as the primary vision assessment tool. Manual measurement of the FAZ area with the possibility of interobserver variability could also be considered as a further limitation. Our study, like the rest of OCTA studies concerned with SCP FAZ and DCP FAZ is limited with the difficulty of delineating the capillaries’ border of the DCP which might be not as distinct as SCP due to the phenomenon of flow projection of the SCP on the DCP.32
Conclusion
From this study, we recommend the use noninvasive imaging tools like OCT and OCTA in the regular follow-up of patients after successful repair of macula involving RRD. OCT can provide accurate data about the morphology and thickness of the retinal layers after reattachment, and can record the recovery process with the restoration of retinal layers. The use of OCTA to study the vascular changes after successful retinal reattachment surgery proved very useful in explaining the limited visual recovery of patients. Further studies with larger sample sizes are needed to analyze the effect of ischemic and morphological changes occurring in detached retina and during its process of recovery, and how this would correlate with the final visual gain.
Disclosure
The authors report no conflicts of interest in this work.
References
1. Delolme MP, Dugas B, Nicot F, Muselier A, Bron AM, Creuzot-Garcher C. Anatomical and functional macular changes after rhegmatogenous retinal detachment with macula off. Am J Ophthalmol. 2012;153(1):128–136. doi:10.1016/j.ajo.2011.06.010
2. Heimann H, Bartz-Schmidt KU, Bornfeld N, et al. Scleral buckling versus primary vitrectomy in rhegmatogenous retinal detachment: a prospective randomized multicenter clinical study. Ophthalmology. 2007;114(12):2142–2154. doi:10.1016/j.ophtha.2007.09.013
3. De la Rúa ER, Pastor JC, Fernández I, et al. Non-complicated retinal detachment management: variations in 4 years. Retina 1 project; report 1. Br J Ophthalmol. 2008;92(4):523–5. 32. doi:10.1136/bjo.2007.127688
4. Sharma A, Grigoropoulos V, Williamson TH. Management of primary rhegmatogenous retinal detachment with inferior breaks. Br J Ophthalmol. 2004;88:1372–1375. doi:10.1136/bjo.2003.041350
5. Yoshida A, Ogasawara H, Jalkh AE, Sanders RJ, McMeel JW, Schepens CL. Retinal detachment after cataract surgery. Surgical Results Ophthalmology. 1992;99:460–465.
6. Arya AV, Emerson JW, Engelbert M, Hagedorn CL, Adelman RA. Surgical management of pseudophakic retinal detachments: a meta-analysis. Ophthalmology. 2006;113(10):1724–1733. doi:10.1016/j.ophtha.2006.05.044
7. Lois N, Wong D. Pseudophakic retinal detachment. Surv Ophthalmol. 2003;48(5):467–487. doi:10.1016/S0039-6257(03)00083-3
8. Nakanishi H, Hangai M, Unoki N. Spectral-domain optical coherence tomography imaging of the detached macula in rhegmatogenous retinal detachment. Retina. 2009;29(2):232–242. doi:10.1097/IAE.0b013e31818bcd30
9. dell’Omo R, Viggiano D, Giorgio D, et al. Restoration of foveal thickness and architecture after macula-off retinal detachment repair. Invest Ophthalmol Vis Sci. 2015;56(2):1040–1050. doi:10.1167/iovs.14-15633
10. Wolfensberger TJ, Gonvers M. Optical coherence tomography in the evaluation of incomplete visual acuity recovery after macula-off retinal detachments. Graefes Arch Clin Exp Ophthalmol. 2002;240(2):85–89. doi:10.1007/s00417-001-0410-6
11. Baba T, Hirose A, Moriyama M, Mochizuki M. Tomographic image and visual recovery of acute macula-off rhegmatogenous retinal detachment. Graefes Arch Clin Exp Ophthalmol. 2004;242(7):576–581. doi:10.1007/s00417-004-0884-0
12. Cavallini GM, Masini C, Volante V, Pupino A, Campi L, Pelloni S. Visual recovery after scleral buckling for macula-off retinal detachments: an Optical Coherence Tomography Study. Eur J Ophthalmol. 2007;17(5):790–796. doi:10.1177/112067210701700517
13. Spaide RF, Klancnik JM, Cooney MJ. Retinal vascular layers imaged by fluorescein angiography and optical coherence tomography angiography. JAMA Ophthalmol. 2015;133(1):45–50. doi:10.1001/jamaophthalmol.2014.3616
14. Samara WA, Say EA, Khoo CT, et al. Correlation of foveal avascular zone size with foveal morphology in normal eyes using optical coherence tomography angiography. Retina. 2015;35:2188–2195. doi:10.1097/IAE.0000000000000847
15. Arroyo JG, Yang L, Bula D, Chen DF. Photoreceptor apoptosis in human retinal detachment. Am J Ophthalmol. 2005;139(4):605–610. doi:10.1016/j.ajo.2004.11.046
16. Lewis GP, Charteris DG, Sethi CS, Fisher SK. Animal models of retinal detachment and reattachment: identifying cellular events that may affect visual recovery. Eye. 2002;16:375–387. doi:10.1038/sj.eye.6700202
17. Woo JM, Yoon YS, Woo JE, Min JK. Foveal avascular zone area changes analyzed using OCT angiography after successful rhegmatogenous retinal detachment repair. Curr Eye Res. 2018;43(5):674–678. doi:10.1080/02713683.2018.1437922
18. Ohkubo H. Fluorescein angiographic findings in the detached and reattached retina. Jpn J Ophthalmol. 1988;32:423–428.
19. Quintyn J-C, Brasseur G. Subretinal fluid in primary rhegmatogenous retinal detachment: physiopathology and composition. Surv Ophthalmol. 2004;49(1):96–108. doi:10.1016/j.survophthal.2003.10.003
20. Alm A, Nilsson SFE. Uveoscleral outflow – a review. Exp Eye Res. 2009;88(4):760–768. doi:10.1016/j.exer.2008.12.012
21. Anderson DH, Stern WH, Fisher SK, Erickson PA, Borgula GA. Retinal detachment in the cat: the pigment epithelial– photoreceptor interface. Invest Ophthalmol Vis Sci. 1983;24:906–926.29.
22. Chaitin MH, Wortham HS, Brun-Zinkernagel A-M. Immunocytochemical localization of CD44 in the mouse retina. Exp Eye Res. 1994;58(3):359–366. doi:10.1006/exer.1994.1026
23. Sato T, Kanai M, Busch C, Wakabayashi T. Foveal avascular zone area after macula-off rhegmatogenous retinal detachment repair: an optical coherence tomography angiography study. Graefes Arch Clin Exp Ophthalmol. 2017;255(10):2071–2072. doi:10.1007/s00417-017-3743-5
24. Tan CS, Lim LW, Chow VS, et al. Optical coherence tomography angiography evaluation of the parafoveal vasculature and its relationship with ocular factors. Invest Ophthalmol Vis Sci. 2016;57(9):224–234. doi:10.1167/iovs.15-18869
25. Tick S, Rossant F, Ghorbel I, et al. Foveal shape and structure in a normal population. Invest Ophthalmol Vis Sci. 2011;52(8):5105–5110. doi:10.1167/iovs.10-7005
26. Suren E, Cetinkaya A, Cetinkaya E, Yucel O, Erol MK. Foveal avascular zone area and macular vascular density changes after successful rhegmatogenous retinal detachment repair: an OCT Angiography Study. Ron Adelman, Giampaolo Gini, Malhar Soni, Richard Spaide, Daniele Tognetto.
27. Dubis AM, Hansen B, Cooper R, Beringer J, Dubra A, Carroll J. Relationship between the foveal avascular zone and foveal pit morphology. Invest Ophthalmol Vis Sci. 2012;53(3):1628–1636. doi:10.1167/iovs.11-8488
28. Lee JY, Kim JY, Lee S-Y, Jeong JH, Lee EK. Foveal microvascular structures in eyes with silicone oil tamponade for rhegmatogenous retinal detachment: a swept-source Optical Coherence Tomography Angiography Study. Sci Rep. 2020;10(1):2555. doi:10.1038/s41598-020-59504-3
29. Wang H, Xu X, Sun X, Ma Y, Sun T. Macular perfusion changes assessed with optical coherence tomography angiography after vitrectomy for rhegmatogenous retinal detachment. Graefes Arch Clin Exp Ophthalmol. 2019;257(4):733–740. doi:10.1007/s00417-019-04273-7
30. Hong EH, Cho H, Kim DR, Kang MH, Shin YU, Seong M. Changes in retinal vessel and retinal layer thickness after vitrectomy in retinal detachment via swept-source OCT angiography. Invest Ophthalmol Vis Sci. 2020;61(2):35. doi:10.1167/iovs.61.2.35
31. Yui N, Kunikata H, Aizawa N, Nakazawa T. Optical coherence tomography angiography assessment of the macular capillary plexus after surgery for macula-off rhegmatogenous retinal detachment. Graefes Arch Clin Exp Ophthalmol. 2019;257(1):245–248. doi:10.1007/s00417-018-4133-3
32. Huang D, Jia Y, Gao S, et al. Principles of optical coherence tomography angiography. In: Lumbroso B, Huang D, Chen JC, editors. Clinical OCT Angiography Atlas. London: Jaypee Brothers Medical Publishers; 2015:32–35.
 © 2020 The Author(s). This work is published and licensed by Dove Medical Press Limited. The
full terms of this license are available at https://www.dovepress.com/terms
and incorporate the Creative Commons Attribution
- Non Commercial (unported, 3.0) License.
By accessing the work you hereby accept the Terms. Non-commercial uses of the work are permitted
without any further permission from Dove Medical Press Limited, provided the work is properly
attributed. For permission for commercial use of this work, please see paragraphs 4.2 and 5 of our Terms.
© 2020 The Author(s). This work is published and licensed by Dove Medical Press Limited. The
full terms of this license are available at https://www.dovepress.com/terms
and incorporate the Creative Commons Attribution
- Non Commercial (unported, 3.0) License.
By accessing the work you hereby accept the Terms. Non-commercial uses of the work are permitted
without any further permission from Dove Medical Press Limited, provided the work is properly
attributed. For permission for commercial use of this work, please see paragraphs 4.2 and 5 of our Terms.