Back to Journals » Clinical Interventions in Aging » Volume 12
Frequency of frailty and its association with cognitive status and survival in older Chileans
Authors Albala C ![]() , Lera L
, Lera L ![]() , Sanchez H, Angel B
, Sanchez H, Angel B ![]() , Márquez C
, Márquez C ![]() , Arroyo P, Fuentes P
, Arroyo P, Fuentes P
Received 14 March 2017
Accepted for publication 27 May 2017
Published 26 June 2017 Volume 2017:12 Pages 995—1001
DOI https://doi.org/10.2147/CIA.S136906
Checked for plagiarism Yes
Review by Single anonymous peer review
Peer reviewer comments 3
Editor who approved publication: Dr Richard Walker
Cecilia Albala,1 Lydia Lera,1 Hugo Sanchez,1 Barbara Angel,1 Carlos Márquez,1 Patricia Arroyo,2 Patricio Fuentes2
1Public Health Nutrition Unit, Institute of Nutrition and Food Technology (INTA), University of Chile, 2Faculty of Medicine, Clinical Hospital, University of Chile, Santiago, Chile
Background: Age-associated brain physiologic decline and reduced mobility are key elements of increased age-associated vulnerability.
Objective: To study the frequency of frailty phenotype and its association with mental health and survival in older Chileans.
Methods: Follow-up of ALEXANDROS cohorts designed to study disability associated with obesity in community-dwelling people 60 years and older living in Santiago, Chile. At baseline, 2,098 (67% women) of 2,372 participants were identified as having the frailty phenotype: weak handgrip dynamometry, unintentional weight loss, fatigue/exhaustion, five chair-stands/slow walking speed and difficulty walking (low physical activity). After 10–15 years, 1,298 people were evaluated and 373 had died. Information regarding deaths was available for the whole sample.
Results: The prevalence of frailty at baseline (≥3 criteria) in the whole sample was 13.9% (women 16.4%; men 8.7%) and the pre-frailty prevalence (1–2 criteria) was 63.8% (65.0% vs 61.4%), respectively. Frailty was associated with cognitive impairment (frail 48.1%; pre-frail 21.7%; nonfrail 20.5%, P<0.001) and depression (frail 55.1%; pre-frail 27.3%; nonfrail 18.8%, P<0.001). Logistic regression models for frailty adjusted for sex and age showed a strong association between frailty and mild cognitive impairment (MCI) (odds ratio [OR] =3.93; 95% CI: 1.41–10.92). Furthermore, an important association was found for depression and frailty (OR =2.36; 95% CI 1.82–3.06). Age- and sex-adjusted hazard ratios (HRs) for death showed an increased risk with increasing frailty: pre-frail HR =1.56 (95% CI: 1.07–2.29), frail HR =1.91 (95% CI: 1.15–3.19); after adjustment by age and sex, a higher risk of death was observed for people identified as frail (HR =1.56, P=0.014) and pre-frail (HR =1.30, P=0.065). MCI and dementia were also risk factors for death (MCI: HR =1.69, P<0.027; dementia: HR =1.66, P=0.016).
Conclusion: Frailty is highly prevalent and strongly associated with cognitive impairment and depression in older Chileans. The risk for death was higher for frail people, but underlying cognitive impairment is a key component of the lower survival rate.
Keywords: frailty, cognitive impairment, aging, Chile, depression
Corrigendum for this paper has been published.
Introduction
Chile has one of the fastest-aging populations on the American continent, with a life expectancy at birth of 80.5 years, the second longest after Canada.1 The implications of this number for the health care system and social security programs are immense. The aging of the Chilean population, along with socioeconomic and health indicators, show that important health inequalities persist, and affect older people living in underprivileged conditions more than rich people. The former also presents a larger amount of health problems and a higher disability rate.2 The challenge is improving not only life expectancy but also healthy life expectancy for the whole population.
The progressive decline in physiological functioning of multiple systems because of aging decreases the reserve and resistance to stressors, leading to an increased vulnerability of older people, and thus leading to an aggregate of signs and symptoms known as “frailty syndrome.” Age-associated brain physiologic decline, reduced immunity, deterioration of the endocrine system and decreased muscle mass and function are key elements of increased age-associated vulnerability.3 Frailty is being classified more and more as a biological syndrome associated with many adverse health events such as falls, fractures, institutionalization, hospitalization, disability, dependence and death.3–5
Although there is currently no consensus for its definition, the term “frailty” is widely used. Two main models defining frailty have been proposed: the phenotype model6 and the cumulative deficit model.7 Based on these models, several instruments for identifying the frailty syndrome have been developed. Among these, the most used are Fried’s criteria for the phenotype model6 and Rockwood’s frailty index based on the cumulative deficit model.5 The convergence of both definitions has been tested, showing agreement in terms of prediction of adverse outcomes and prevalence.8,9 A limitation of the phenotype model is the exclusion of measurements related to cognitive impairment and depression.
Several studies have investigated the prevalence of frailty in older people using the phenotype definition, however, with different approaches in the operationalization of Fried’s criteria, thus delivering a wide range of prevalence,10 fluctuating from 4% to 59.1%. In Latin America, the prevalence of already described frailty ranges from 7% in Peru to 42.6% in Santiago Chile.11,12 In the present study, we describe the prevalence of frailty in older Chileans defined with an objective measure of slowness. The measurement of gait speed can make an important difference with previously described prevalence in Latin America.
Here, we describe the prevalence of frailty in older Chileans,2 proposing that, although it might not be included as a criterion, cognitive impairment and dementia, both important public health problems in older Chileans,13 are strongly associated with frailty defined by the phenotype criteria. Moreover, frailty and cognitive status are independent risk factors for mortality.14
Methods
Follow-up of the subjects recruited for the ALEXANDROS study2 was designed to study the trajectories of disability associated with obesity in community-dwelling people 60 years and older from three cohorts. Briefly, ALEXANDROS is a longitudinal study conducted in Santiago, Chile, which includes the follow-up of three cohorts: 1) the original SABE sample15 composed of 1,173 people 60 years and older, born before 1940 and recruited in 1999–2000 through a probabilistic sampling process with three-step procedure (districts, blocks and households); 2) the ALEXANDROS cohort composed of 950 people born between 1940 and 1948 recruited in 2005–2008, randomly selected from the primary health care center (PHCC) registries (where 85% of the older adults are registered) in a two-step procedure, health care centers and registered older adults from the selected PHCC; and 3) the Instituciones de Salud Previsional (ISAPRES) cohort of 266 people of high socioeconomic level born before 1948 and randomly selected from private health insurance system registries (ISAPRES).
At baseline, 2,098 (67% women) of 2,389 participating subjects were identified as having the frailty phenotype. After 10–15 years, 1,298 people were evaluated and 373 had died. Information regarding deaths was available for the entire sample through death certificates from the Chilean National Civil Registry.
After signing an informed consent form, all subjects underwent face-to-face interviews including self-reported chronic diseases (hypertension, diabetes, cancer, chronic obstructive pulmonary disease, stroke), falling, functional limitations, nutrition and general health.
Anthropometric measurements were for weight, height and knee height; also, waist, hip, calf and arm circumferences were measured according to methods described previously.16 Nutritional status and obesity were defined according to World Health Organization standards. Three-meter walking speed, timed get-up-and-go and five chair-stand time were registered. Muscle strength was measured with a handgrip dynamometer (Hand Dynamometer T-18, Country Technology, Inc.), registering the better of two measurements with the dominant hand.
Cognitive impairment was defined with the Mini-Mental State Examination (MMSE)17 using the score cutoff point previously validated in Chile of <22 and dementia with a screening test validated for Chile18 consisting of a score of <22 on the MMSE and a score of >5 in the Pfeffer Activities Questionnaire,19 a combination that estimates the prevalence, with 94.4% sensitivity (95% CI: 58.9–80.3) and 83.3% specificity (95% CI: 72.3–90.7).20 Depression was assessed with the Geriatric Depression Scale (GDS-15)21 and defined as having a score of >4.21
Physical frailty was defined according to Fried’s criteria6: weakness, unintentional weight loss, poor endurance, slowness and low physical activity. The operational definitions for the five criteria were as follows:
Weight loss
Unintentional loss of at least 5 kg in the previous 6 months.
Poor endurance
Self-report of fatigue/exhaustion from the question of SF-3622 or a negative answer to the question of GDS-15, feeling energetic and in a good mood.21
Slowness
Walking speed <0.8 m/sec (≥4 sec) or five chair-stands >9 sec. To calculate the cutoff time for five chair-stands, we used a gait speed of 0.8 m/sec as gold standard to build receiver operating characteristic curve curves and estimate the cutoff points for chair-stands with the highest sensitivity and specificity.
Low physical activity
Difficulty walking (low physical activity).
Weakness
Low muscle strength defined with handgrip strength cutoff points previously determined in a large sample of the Chilean older population (≤25th percentile: men 27 kg; 15 kg women).16,23
According to Fried’s definition, people were classified as frail when three or more criteria were positive and as pre-frail with one or two positive criteria.
The study protocol was approved by the Institutional Review Board of the Institute of Nutrition and Food Technology of the University of Chile and the Ethical committee of the Chilean National Council for Science and Technology Research (CONICYT).
Statistical analysis
Continuous variables were expressed as mean ± SD and 95% CI. Categorical variables were expressed as percentages and 95% CI. The difference between genders was calculated by a two-sample mean-comparison test or Pearson’s chi-squared test, depending on the kind of variable. Logistic regression models were performed to analyze the association between frailty and studied variables (risk factors, age, nutritional state, diabetes), adjusted by sex. The Hosmer–Lemeshow test was used to assess the goodness of fit for the estimated models. Kaplan–Meir survival curves and probabilities of survival were estimated for frailty and pre-frailty condition. Cox regression hazard models for mortality risk according to frailty and cognitive status adjusted by sex and age were developed.
All statistical analyses were performed using STATA 14 (StataCorp.2015. Stata Statistical Software, Release 14. College Station, TX, StataCorp LP).
Results
The characteristics of the sample by sex are displayed in Table 1. The final sample consists of 2,098 people (33% men) 60 years and older, mean age 68.3 years, similar for both men and women. Mean years of education was 7.3 without gender differences. Living alone was more frequent for women (10.2%) than for men (7.1%). The prevalence of mild cognitive impairment (MCI) was higher in women (28.3%) than in men (21.2%). A similar situation was observed for depression (women 32.4%; men 22.8%) and falling (35.4% vs 24.4%, respectively). Women also had a higher number of chronic diseases (1.9 vs 1.5) than men, but a similar frequency of diabetes and hypertension.
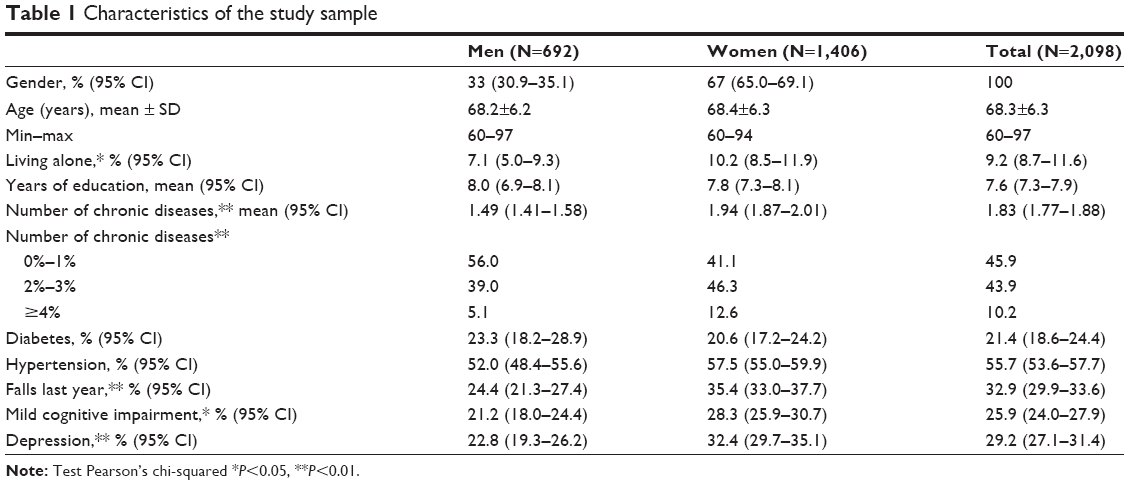 | Table 1 Characteristics of the study sample |
The prevalence of frailty by gender and groups of age is depicted in Figure 1. The frequency in the whole sample was 13.9%, higher in women (16.4%) than in men (8.7%), P<0.01. A twofold increase in the prevalence of frailty in both men (16.7%) and women (27.3%) was observed in people 80 years old and older.
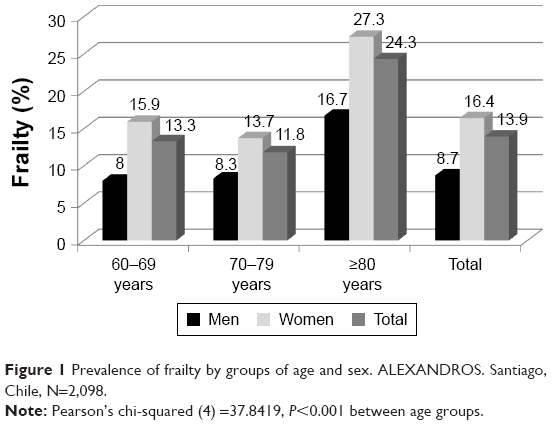 | Figure 1 Prevalence of frailty by groups of age and sex. ALEXANDROS. Santiago, Chile, N=2,098. |
Regarding frailty phenotype components (Table 2), a higher frequency was found for fatigue/exhaustion, which was positive in half of the sample and higher in women (54.1%) than in men (43.8%). The second was slowness, affecting one-third of the sample and also higher in women than in men (37.7% vs 22.4%). Low muscle strength was identified in 25% of the sample and weight loss in 13% of the sample, without differences between men and women either in weight loss or muscle strength. The lowest frequency was found for low physical activity (11%), which was higher in women than in men.
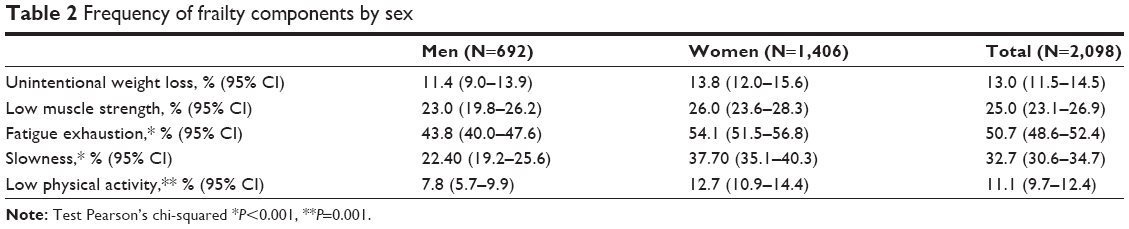 | Table 2 Frequency of frailty components by sex |
The association of frailty with cognitive impairment and gender is shown in Table 3. The strongest association was observed for women (P<0.001), among whom 6.9% of the frail had dementia and 52% had MCI in comparison with 3.1% of dementia and 22% of MCI for nonfrail or pre-frail individuals. No differences between nonfrail and pre-frail women were observed in the frequency of either MCI or dementia.
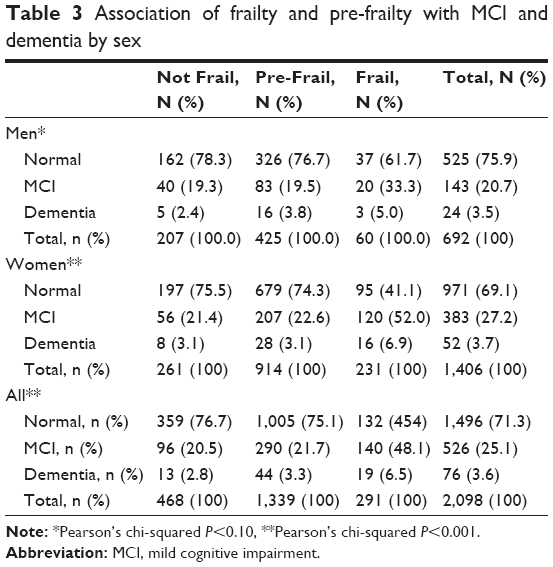 | Table 3 Association of frailty and pre-frailty with MCI and dementia by sex |
In men, the frequency of dementia was twice in those with frailty (2.4%) than in the nonfrail ones (5.0%) and MCI was present in one-third of the frail in comparison with 19% in the pre-frail or the nonfrail.
Over a half of the sample (63.8%; 95% CI: 61.7–65.9) was identified as having a pre-frailty condition. The respective figures in men were 61.4% (95% CI: 57.7–65.1) and 65% (95% CI: 62.5–67.5) in women.
Logistic regression models (Table 4) for frailty adjusted for sex and age showed a strong association between frailty and MCI (odds ratio [OR] =3.93; 95% CI: 1.41–10.92). When depression was included in the model (model 2), besides the association with MCI (OR =3.47; 95% CI: 1.24–9.73), an important association was found for depression and frailty (OR =2.36; 95% CI: 1.82–3.06). The association remains significant for both MCI and depression when adding education and nutritional state. Underweight, overweight and obesity were not related to greater odds of frailty (model 3).
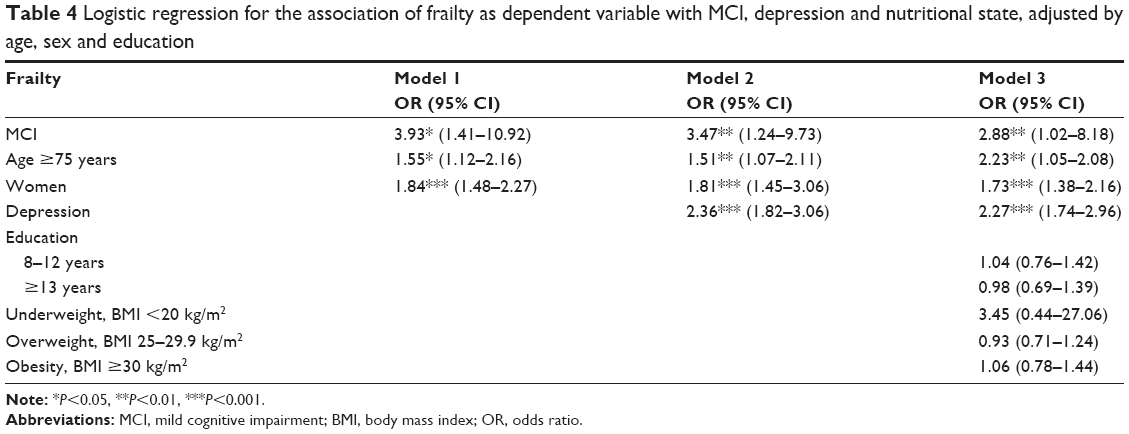 | Table 4 Logistic regression for the association of frailty as dependent variable with MCI, depression and nutritional state, adjusted by age, sex and education |
Reference categories: age <75 years; education <8 years; normal BMI 20–24.9 kg/m2.
Survival
Kaplan–Meier survival estimates by frailty condition are shown in Figure 2. The figure depicts a dose effect of the frailty condition on survival where the highest survival rate is for people with neither frailty nor pre-frailty at baseline, followed by people classified as pre-frail at baseline. The lowest survival rate was observed for frail people at baseline.
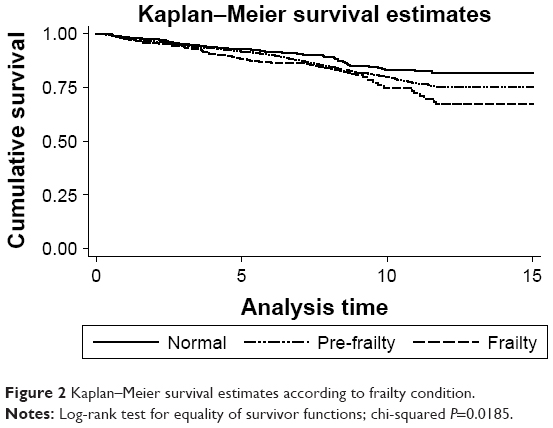 | Figure 2 Kaplan–Meier survival estimates according to frailty condition. |
Cox regression hazard model for mortality risk according to frailty and cognitive status is shown in Table 5, where, after adjustment by age and sex, a higher risk of death was observed for people identified as frail (hazard ratio [HR] =1.56, P=0.014) and pre-frail (HR =1.30, P=0.065). After the addition of MCI and dementia to the model, both significant risk factors for death (MCI: HR =1.62, P<0.049; dementia: HR =1.96, P=0.004), a significant mortality risk associated with frailty persists. The addition of education in a third model does not change the associations.
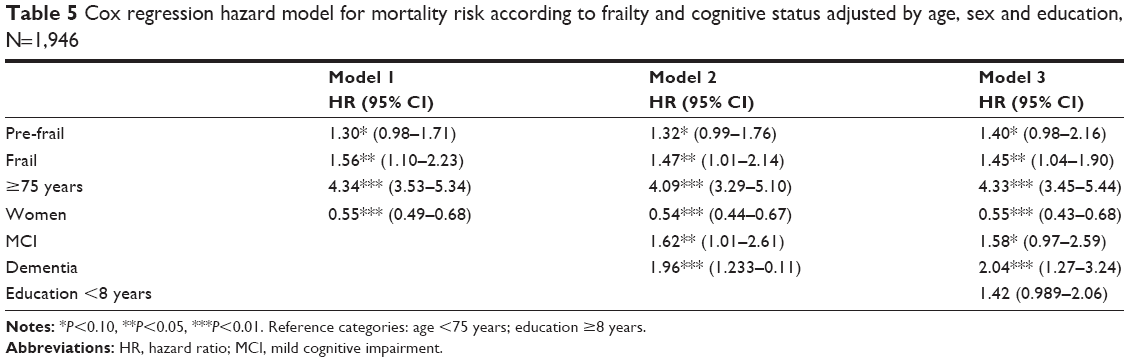 | Table 5 Cox regression hazard model for mortality risk according to frailty and cognitive status adjusted by age, sex and education, N=1,946 |
Discussion
In this study, we report the prevalence of frailty syndrome in a sample of 2,372 Chilean older adults using Fried’s phenotype definition.6 We found a total prevalence of 13.9%, much higher in women (16.4%) than in men (8.7%), as has been shown in almost all studies on frailty. The total prevalence was almost double in people 80 years and older (24.3%) than in the 60–69-year interval (13.3%). A recent review in Latin America and the Caribbean done by Da Mata et al11 found a wide range of prevalence fluctuating between 7% in Peru and 8% in Brazil, to 40% in Havana, Cuba and 42.6% in Santiago, Chile – countries with good general health indicators. In Chile’s case, the large difference between our results and those previously published, even considering the fact that half of the sample was the same as the one used in previous studies, can be explained by the use of objective measures for the slowness criteria and cutoff points for strength for both men and women, which was calculated from a large sample of the older Chilean population – lower than those used previously. Similarly, in Cuba, the 10/66 Dementia Research Group’s (10/66 DRG) study24 found a prevalence of frailty of 21% using the physical frailty criteria, with gait speed as the indicator of slowness. In Mexico, using the same criteria but different operationalization,25 the prevalence found in the SABE sample (1999–2000)12 was 45.5%; in the study based on the Mexican Health and Aging Study (2001), the prevalence of frailty was 37.2% and in the 10/66 DRG study in 2003–2007, the frequency of frailty was 10.1% in urban Mexico.24 Considering that gait speed alone as well as chair-stands have been consistently demonstrated as excellent indicators of overall physical performance and functional status, the objective measure of this variable should be operationalized using one of these tests (walking speed or chair-stands).
Using the same index, our results (13.9%) are similar to the frequencies reported for people 60 years old and older in European participants in the Study, Health, Aging and Retirement in Europe,26 where 8.6% in men and 16.4% in women yielded a total prevalence of 12.9%.27 In the last wave of the same study (2012), the prevalence of frailty in people 50 years old and older fluctuated between 0.79% in Germany and 15.6% in Spain28 higher than ours.
We found a strong association of frailty with cognitive performance and depression, demonstrating that although not included as a criterion, mental health is also involved in the frailty phenotype. These results are in agreement with a recent review29 supporting the link between frailty and cognitive status and the association between frailty and symptoms of depression found in Italian community-dwelling older adults30 and in the Women Health Initiative study.31
Similar to the Rockwood results,8 the Kaplan–Meier survival curves show the lowest survival for frail people and the highest for robust people, with pre-frail in between. With regard to mortality risk, Cox regression hazard analysis confirms the high risk of death associated with frailty,9,24 with cognitive impairment and dementia as important contributors to a higher risk of death.
The strength of this study is its number of subjects, the objective measurement of slowness and weakness and its longitudinal character. The weakness of the study is the difficulty in measuring low physical activity, as Fried defined it, in population studies.
Conclusion
Frailty and pre-frailty are highly prevalent and strongly associated with cognitive impairment and depression in older Chileans. At follow-up, an increasing risk of death associated with frailty was observed. The phenotype model was demonstrated to predict mortality at 10 years in the older Chilean population. The risk of death was higher for frail people but underlying cognitive status is probably a component of lower survival.
The frequency observed for pre-frailty, if added to the frequency of frailty, adds up to over 60% of the older population. This is a reason for concern if we keep in mind the wide frailty spectrum, which goes from increased vulnerability and start of decline to clinical frailty, disability and dependence3 with the consequent increasing health care needs and costs.4 Thus, prevention, early detection and treatment are compulsory for the health team in general practice.32,33
The abstract of this paper was presented at the 8th International Conference on Cachexia, Sarcopenia and Muscle Wasting held in Paris, France, December 4–6, 2015, as an abstract with interim findings. The abstract was published in Journal of Cachexia, Sarcopenia and Muscle, 2015, volume 6, issue 4.
Acknowledgment
Research related to this abstract was funded by Fondecyt grant 1130947.
Disclosure
The authors report no conflicts of interest in this work.
References
WHO. Monitoring Health for the SDGs:Annex B. Geneva: WHO; 2016. | ||
Albala C, Sánchez H, Lera L, Angel B, Cea X. Socioeconomic inequalities in active life expectancy and disability related to obesity among older people. Rev Med Chil. 2011;139(10):1276–1285. | ||
Clegg A, Young J, Iliffe S, Rikkert MO, Rockwood K. Frailty in elderly people. Lancet. 2013;381(9868):752–762. | ||
Fried LP, Ferrucci L, Darer J, Williamson JD, Anderson G. Untangling the concepts of disability, frailty, and comorbidity: implications for improved targeting and care. 2004;59(3):255–263. | ||
Rockwood K, Stadnyk K, MacKnight C, McDowell I, Hebert R, Hogan DB. A brief clinical instrument to classify frailty in elderly people. Lancet. 1999;353(9148):205–206. | ||
Fried LP, Tangen CM, Walston J, et al. Frailty in older adults: evidence for a phenotype. J Gerontol A Biol Sci Med Sci. 2001;56(3):M146–M156. | ||
Rockwood K, Song X, MacKnight C, et al. A global clinical measure of fitness and frailty in elderly people. CMAJ. 2005;173(5):489–495. | ||
Rockwood K, Andrew M, Mitnitski A. A comparison of two approaches to measuring frailty in elderly people. J Gerontol A Biol Sci Med Sci. 2007;62(7):738–743. | ||
Bandeen-Roche K, Xue Q-L, Ferrucci L, et al. Phenotype of frailty: characterization in the women’s health and aging studies. J Gerontol A Biol Sci Med Sci. 2006;61(3):262–266. | ||
Collard RM, Boter H, Schoevers RA, Oude Voshaar RC. Prevalence of frailty in community-dwelling older persons: a systematic review. J Am Geriatr Soc. 2012;60(8):1487–1492. | ||
Da Mata FAF, Pereira PPDS, De Andrade KRC, Figueiredo ACMG, Silva MT, Pereira MG. Prevalence of frailty in Latin America and the Caribbean: a systematic review and meta-analysis. PLoS One. 2016;11(8):1–18. | ||
Alvarado BE, Zunzunegui MV, Béland F, Bamvita J. Life Course social and health conditions linked to frailty in Latin American older men and women. J Gerontol A Biol Sci Med Sci. 2008;63(12):1399–1406. | ||
Fuentes P, Albala C. An update on aging and dementia in Chile. Dement Neuropsychol. 2014;8(4):2–5. | ||
Cano C, Samper-Ternent R, Al Snih S, Markides K, Ottenbacher KJ. Frailty and cognitive impairment as predictors of mortality in older Mexican Americans. J Nutr Health Aging. 2012;16(2):142–147. | ||
Albala C, Lebrão ML, León Díaz EM, et al. Encuesta Salud, Bienestar year Envejecimiento (SABE): metodología de la encuesta year perfil de la población estudiada. [The Health,Well-Being, and Aging (“SABE”) survey: methodology applied and profile of the study population. Encuesta Salud, Bienestar y Envejecimiento (SABE): metodología de la encuesta y perfil de la población estudiada]. Rev Panam Salud Pública. 2005;17(5–6):307–322. Spanish. | ||
Lera L, Albala C, Ángel B, et al. Prediccion de la masa muscular apendicular esqueletica basado en mediciones antropometricas en Adultos Mayores Chilenos. [Anthropometric model for the prediction of appendicular skeletal muscle mass in Chilean older adults] Nutr Hosp. 2014;29(3):611–617. Spanish. | ||
Folstein MF, Folstein SE MP. Mini-mental state: a practical method for grading the cognitive state of patients for the clinician. J Psychiatr Res. 1975;12(3):189–198. | ||
Quiroga LP, Albala BC, Klaasen PG. Validación de un test de tamizaje para el diagnóstico de demencia asociada a edad, en Chile. [Validation of a screening test for age associated cognitive impairment, in Chile. Validación de un test de tamizaje para el diagnóstico de demencia asociada a edad, en Chile]. Rev Med Chil. 2004;132(4):467–478. Spanish. | ||
Pfeffer RI, Kurosaki TT, Harrah CH, Chance JM, Filos S. Measurement of functional activities in older adults in the community. J Gerontol. 1982;37(3):323–329. | ||
Albala C, Angel B, Lera L, Sanchez H, Marquez C, Fuentes P. Low leptin availability as a risk factor for dementia in Chilean older people. Dement Geriatr Cogn Dis Extra. 2016;6(2):295–302. | ||
Sheikh RL, Yesavage JA. Geriatric Depression Scale (GDS). Recent evidence and development of a shorter version. Clin Gerontol. 1986;5(1–2):165–173. | ||
Lera L, Fuentes-García A, Sánchez H, Albala C. Validity and reliability of the SF-36 in Chilean older adults: the ALEXANDROS study. Eur J Aging. 2013;10(2):127–134. | ||
Arroyo P, Lera L, Sánchez H, Bunout D, Luis J, Albala C. Anthropometry, body composition and functional limitations in the elderly. [Indicadores antropometricos, composicion corporal y limitaciones funcionales en ancianos]. Rev Méd Chile. 2007;135:846–854. Spanish. | ||
At J, Bryce R, Prina M, et al. Frailty and the prediction of dependence and mortality in low- and middle-income countries: a 10/66 population-based cohort study. BMC Med. 2015;13(1):138. | ||
Aguilar-Navarro SG, Amieva H, Gutiérrez-Robledo LM, Avila-Funes JA. Frailty among Mexican community-dwelling elderly: a story told 11 years later. The Mexican health and aging study. Salud Publica Mex. 2015;57(3):S62–S69. | ||
Santos-Eggimann B, Cuénoud P, Spagnoli J, Junod J. Prevalence of frailty in middle-aged and older community-dwelling Europeans living in 10 countries. J Gerontol A Biol Sci Med Sci. 2009;64(6):675–681. | ||
Macklai N, Spagnoli J, Junod J, Santos-Eggimann B. Prospective association of the SHARE-operationalized frailty phenotype with adverse health outcomes: evidence from 60+ community-dwelling Europeans living in 11 countries. BMC Geriatr. 2013;13(1):3. | ||
Romero-Ortuno R, Fouweather T, Jagger C. Cross-national disparities in sex differences in life expectancy with and without frailty. Age Aging. 2014;43(2):222–228. | ||
Sargent L, Brown R. Assessing the current state of cognitive frailty: measurement properties. J Nutr Health Aging. 2016;21(2):152–160. | ||
Mulasso A, Roppolo M, Giannotta F, Rabaglietti E. Associations of frailty and psychosocial factors with autonomy in daily activities: a cross-sectional study in Italian community-dwelling older adults. Clin Interv Aging. 2016;11:37–45. | ||
Woods NF, LaCroix AZ, Gray SL, et al. Frailty: emergence and consequences in women aged 65 and older in the Women’s Health Initiative observational study. J Am Geriatr Soc. 2005;53(8):1321–1330. | ||
De Lepeleire J, Iliffe S, Mann E, Degryse JM. Frailty: an emerging concept for general practice. Br J Gen Pract. 2009;59(562):364–369. | ||
Morley JE, Vellas B, Abellan van Kan G, et al. Frailty consensus: a call to action. J Am Med Dir Assoc. 2013;14(6):392–397. |
 © 2017 The Author(s). This work is published and licensed by Dove Medical Press Limited. The
full terms of this license are available at https://www.dovepress.com/terms
and incorporate the Creative Commons Attribution
- Non Commercial (unported, 3.0) License.
By accessing the work you hereby accept the Terms. Non-commercial uses of the work are permitted
without any further permission from Dove Medical Press Limited, provided the work is properly
attributed. For permission for commercial use of this work, please see paragraphs 4.2 and 5 of our Terms.
© 2017 The Author(s). This work is published and licensed by Dove Medical Press Limited. The
full terms of this license are available at https://www.dovepress.com/terms
and incorporate the Creative Commons Attribution
- Non Commercial (unported, 3.0) License.
By accessing the work you hereby accept the Terms. Non-commercial uses of the work are permitted
without any further permission from Dove Medical Press Limited, provided the work is properly
attributed. For permission for commercial use of this work, please see paragraphs 4.2 and 5 of our Terms.