Back to Journals » Clinical Ophthalmology » Volume 8
Frequency-doubling technology perimetry and multifocal visual evoked potential in glaucoma, suspected glaucoma, and control patients
Authors Kanadani F, Mello P ![]() , Dorairaj S, Kanadani TC
, Dorairaj S, Kanadani TC
Received 23 March 2014
Accepted for publication 22 April 2014
Published 14 July 2014 Volume 2014:8 Pages 1323—1330
DOI https://doi.org/10.2147/OPTH.S64684
Checked for plagiarism Yes
Review by Single anonymous peer review
Peer reviewer comments 4
Fabio N Kanadani,1 Paulo AA Mello,1 Syril K Dorairaj,2 Tereza CM Kanadani3
1Federal University of Sao Paulo, Sao Paulo, Brazil; 2Mayo Clinic, Department of Ophthalmology, Jacksonville, Florida, USA; 3Sao Jose University Hospital, Belo Horizonte, Brazil
Introduction: The gold standard in functional glaucoma evaluation is standard automated perimetry (SAP). However, SAP depends on the reliability of the patients’ responses and other external factors; therefore, other technologies have been developed for earlier detection of visual field changes in glaucoma patients. The frequency-doubling perimetry (FDT) is believed to detect glaucoma earlier than SAP. The multifocal visual evoked potential (mfVEP) is an objective test for functional evaluation.
Objective: To evaluate the sensitivity and specificity of FDT and mfVEP tests in normal, suspect, and glaucomatous eyes and compare the monocular and interocuar mf VEP.
Methods: Ninety-five eyes from 95 individuals (23 controls, 33 glaucoma suspects, 39 glaucomatous) were enrolled. All participants underwent a full ophthalmic examination, followed by SAP, FDT, and mfVEP tests.
Results: The area under the curve for mean deviation and pattern standard deviation were 0.756 and 0.761, respectively, for FDT, 0.564 and 0.512 for signal and alpha for interocular mfVEP, and 0.568 and 0.538 for signal and alpha for monocular mfVEP. This difference between monocular and interocular mfVEP was not significant.
Conclusion: The FDT matrix was superior to mfVEP in glaucoma detection. The difference between monocular and interocular mfVEP in the diagnosis of glaucoma was not significant.
Keywords: standard automated perimetry, electrophysiology, glaucomatous eyes
Introduction
Open-angle glaucoma (OAG) is a chronic progressive disease, characterized by typical changes of the optic nerve head and retinal nerve fiber (RNFL) layer, with correlated visual field defects.1
The OAG is accompanied, in most cases, by elevated intraocular pressure (IOP).2 This elevated IOP is the most important risk factor for the development of the disease.1 Other known risk factors are older age, African ethnicity, myopia, family history of diabetes3–5 and thin central corneal thickness.6
The diagnosis of OAG classically has been based on the observation of changes on the optic nerve head and RNFL associated with corresponding visual field defects in the presence or not of statistically altered IOP.2
Ganglion cell types
There is evidence that the ganglion cells can also be divided according to their anatomical and functional characteristics.7,8 The P cells are classified as type I when they have small axons with slow conduction and high spatial and low temporal frequency. The loss of these cells can be detected particularly well by high-pass resolution perimetry. The type II P cells have large axons; their conduction is slower than the type I, and they are sensitive to blue stimulus. The loss of these cells may be better detected by blue-yellow chromatic perimetry. The type III M cells have large axons and fast conduction, and they are sensitive to low spatial and high temporal frequency. A particular subset of M cells, My, are those capable of conducting this stimulus. These cells constitute a small portion of the M cells, approximately 20%, which corresponds to 3%–5% of the total number of fibers. These cells can be best detected by frequency-doubling perimetry (FDT).
Standard automated perimetry
Standard automated perimetry (SAP) is the gold standard for the functional evaluation. The analysis of visual fields is based on the patient’s perception of bright spots projected on a white background. This technique has some limitations – it depends on patient participation, has fluctuation sensitivity, and the defect it evaluates is usually not associated with an early diagnosis of glaucoma.9 Kerrigan-Baumrind et al10 reported that the patient must have a loss between 25% and 35% of retinal ganglion cells to find a statistical significance defect in SAP.
Frequency-doubling perimetry
The FDT presents stimuli in a field formed by a square of 10° with black and white bands that alternate following a sinusoidal pattern, a (low) spatial frequency of 0.25 cycle/degree, and a (high) temporal frequency of 25 Hz.11
Although controversial, the FDT has been described by some authors as a technique capable of detecting functional defects earlier than SAP.12,13 It is believed that this technique stimulates a specific subset of ganglion cells that have a broad axon defined as My cells.14,15 The stimulus of a cell subset would lead to a better sensitivity than SAP by the theory of cellular redundancy described by Johnson et al.16 In this description, distinct cell subsets overlap in anatomical layers so that even if there was a localized loss of some cell subset, the region would respond to some kind of stimulus.
FDT matrix
The latest generation of FDT, the Matrix, (FDT Matrix Technology®; Welch Allyn and Zeiss-Humphrey, Dublin, CA, USA), uses stimulus field formed by 5° squares with a spatial frequency of 0.50 cycles/degree and a temporal frequency of 18 Hz. The advantage offered by Matrix is that the default algorithm has been optimized to reduce the testing time and its higher spatial resolution allows the examination in similar locations tested by conventional perimetry.17 The first-generation FDT presents stimuli in a field formed by a 10° square, while the FDT Matrix presents it in a field formed by a 5° square. This higher spatial resolution means that the results from the new FDT tests are more topographically coordinated than the first-generation FDT using the same number of points as the conventional perimetry.
Multifocal visual evoked potential
The multifocal visual evoked potential (mfVEP) is a useful objective functional test in the assessment and diagnosis of glaucoma.18 The mfVEP fills an important gap in the functional assessment of glaucoma, allowing spatially localized damage to be identified with little or no active patient participation.
This study aims to evaluate the sensitivity and specificity of the FDT Matrix and mfVEP for detection of functional glaucoma defects in different groups–normal, glaucoma suspects, and patients with OAG, including those with pigment dispersion or pseudoexfoliation, and to compare the monocular and interocular mfVEP.
Methodology
Sample characterization and description of the tests
Ninety-five eyes of 23 normal subjects, 33 patients with suspected glaucoma, and 39 patients with OAG, including those with pigment dispersion or pseudoexfoliation, were enrolled in a cross-sectional study. Participants underwent a complete eye examination with measurement of visual acuity, applanation tonometry by Goldman’s tonometer, dark room gonioscopy, and fundus biomicroscopy. The right eye of each patient was chosen for data analysis.
Standard automated perimetry
Visual field testing was performed with the Humphrey Field Analyzer® 850 (Carl Zeiss Meditec, Dublin, CA, USA). SITA Standard 24-2 strategy, with stimulus size Goldmann III, was used. Examinations were performed by the same examiner and interpreted by statistical package (STATPAC 2; Carl Zeiss Meditec). All patients had undergone at least two previous rounds of visual field testing. The examination would only be considered for analysis if present reliability indices were within normal limits – a loss of fixation index lower than 20% and rates of false-positive and false-negative less than 33%.19 Anderson’s criteria of abnormalities (described elsewhere) was considered to evaluate the changes on visual fields.20
Frequency doubling perimetry
FDT Matrix examinations were performed with the FDT Matrix Technology® (Welch Allyn and Zeiss-Humphrey), strategy 24-2 of the central area of the visual field, and interpreted by the package for statistical analysis of the device itself. All patients underwent at least two previous examinations. Several authors suggest different interpretation criteria of the FDT.20–22 In this study we used the one suggested by Landers et al23 considering a defect when two or more adjacent regions had P<5%, or an area with a defect with P<1% on the pattern deviation plot.
The mean deviation (MD) and pattern standard deviation (PSD) global indices were considered for analysis. Like SAP, the examination would only be considered for analysis if present reliability indices were within normal limits – a loss of fixation index lower than 20% and rates of false-positive and false-negative less than 33%.
Multifocal visual evoked potential
The mfVEP testing was done with Veris software, Dart Board 60 with Pattern (Electro-Diagnostic Imaging, Redwood City, CA, USA). Each patient was prepared with the proper position of the electrodes as described above and the full test cycle containing four to eight measurements in each eye. An interval of 5 minutes between the first and second measurements of each eye was observed. The detailed mfVEP technique is described elsewhere.24
A cluster was considered when two adjacent points were observed with P<1% and three adjacent points with P<5%, and at least one of P<1%. We excluded points that cross the hemifield or affect the periphery of noncontinuous mode.24
Recruitment
Recruitment of patients was done in 2006 through clinical evaluation of glaucoma in the New York Eye and Ear Infirmary (NYEEI), New York, NY, USA, under the supervision of Robert Ritch, Jeffrey Liebmann, and Celso Tello. Normal subjects were volunteers recruited from the staff of NYEEI and the healthy companions of patients.
Inclusion criteria
- Normal: Individuals with IOP <21 mmHg at two consecutive measurements on different days, normal RNFL; optic disc with cup/disc ratio of 0.5 or less balanced, without any signs of glaucomatous optic neuropathy; SAP within normal limits and no family history of glaucoma. This group was designated the “normal” group.
- Patients with suspected glaucoma: Patients with suspicious changes in RNFL and/or optic disc, but SAP within normal limits. Ocular hypertensive patients were not included in this study. This group was designated the “suspect” group.
- Patients with OAG, including those with pigment dispersion or pseudoexfoliation. The diagnosis of glaucoma in eyes without ocular hypotensive medication was made based on the values of IOP >21 mmHg in addition to typical features of glaucomatous optic neuropathy and correspondent SAP defects. This group was designated the “glaucoma” group. In glaucoma patients using ocular hypotensive medication, IOP was not a criterion for inclusion or exclusion. In all glaucomatous eyes, the visual field loss on SAP was used to classify the severity of glaucoma as mild, moderate, or advanced, according to the criteria of Hodapp et al.25
Exclusion criteria
Individuals under 18 years, with low visual field reliability index, visual acuity worse than 20/40, refractive error >±5 diopters spherical and cylindrical to ±3 diopters, pupillary diameter lower than 2 mm, history of corneal eye surgery, blunt trauma, cataract surgery less than 3 months from the beginning of the study, inability to return to established visits, ocular hypertension, Alzheimer’s, Parkinson’s, or other neurodegenerative disease were excluded.
Statistical analysis
Descriptive analysis of the sample
The intraclass correlation coefficient (ICC) confidence interval (CI) of 95% was applied to the MD and SAP PSD to identify the presence of dependence and correlation between the eyes.
The sensitivity/specificity of SAP, FDT, and interocular mfVEP ratio methods was evaluated using Receiver Operating Characteristics curves51 with respect to ophthalmic indicators (MD, PSD, noise, signal, and alpha). Specificity and sensitivity for each of these methods was also calculated. For the group variable, which has three categories, we adopted the nonparametric Kruskal–Wallis test,26 which allows multiple comparison k, treatments, or categories. A significance level of 5% was considered in all statistical tests. Analyses were performed in SPSS software, version 13 (Statistical Package for the Social Sciences, SPSS Inc., Chicago, IL, USA.).
Ethics and good practice
The study was conducted in accordance with national and international resolutions, as described in the following documents: the Declaration of Helsinki, International Conference on Harmonisation of Technical Requirements for Registration of Pharmaceuticals for Human Use (ICH) Harmonized Tripartite Guidelines for Good Clinical Practice – 1996, and Resolution 196/96 and 257/97 of the National Health Council. The Ethics Committee at NYEEI previously approved this study. In addition, the survey was presented and approved by the Ethics Committee in Research of the Federal University of São Paulo.
Results
The SAP MD and SAP PSD ICC ranged between 0.284 to 0.832 (0.631 mean value) and −0.275 to 0.551 (0.167 mean value), respectively, showing the presence of interdependency between right and left eyes.
Descriptive analysis of the sample
The study sample comprised 95 eyes of 95 patients: 23 (24.2%) normals, 33 (34.7%) suspects, and 39 (41.1%) glaucomatous. Among the patients with glaucoma, four had pseudoexfoliation (10%) and one had pigmentary glaucoma (2.5%). Twenty-five eyes (64.1%) from the glaucoma group were classified as mild, five (12.8%) as moderate, and nine (23.1%) as advanced. Forty-three patients were females and 52 were males. The highest mean age belonged to the glaucoma group (66.3 years) and the lower mean age belonged to the normal group (53.7 years) (P=0.006).
Regarding visual acuity, 86.96% of normal patients and 84.85% of glaucoma suspects had acuity 1.0, while 51.28% of the glaucoma patients were in this group.
IOP (mean ± standard deviation) was 14.61±2.92 mmHg in the normal group, 16.89±3.74 mmHg in the suspect group, and 18.82±3.40 mmHg in the glaucoma group (P<0.0001) (Table 1).
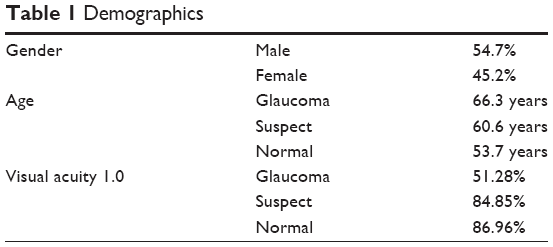 | Table 1 Demographics |
Sensitivity and specificity
The FDT Matrix had a sensitivity–specificity of 92.3%–80% and 84.6%–80% in relation to MD and PSD, respectively (Tables 2 and 3). On the other hand, interocular mfVEP had a sensitivity of 64.9% and a specificity of 69.6% (Table 4).
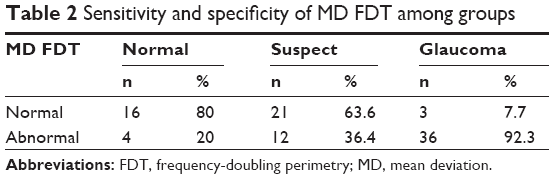 | Table 2 Sensitivity and specificity of MD FDT among groups |
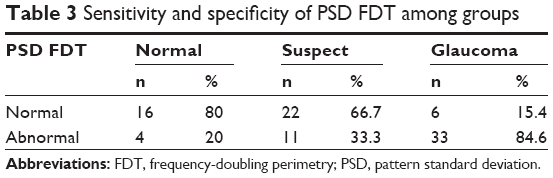 | Table 3 Sensitivity and specificity of PSD FDT among groups |
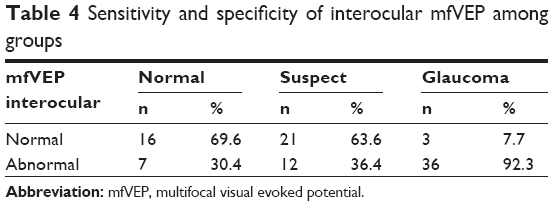 | Table 4 Sensitivity and specificity of interocular mfVEP among groups |
Receiver Operating Characteristics curves
The FDT Matrix showed an area under the curve (AUC) of 0.756 (95% CI, 0.640–0.849) and 0.761 (95% CI, 0.645–0.854) in relation to MD and PSD, respectively (Figure 1). On the other hand, the interocular mfVEP demonstrated an AUC of 0.564 (95% CI, 0.442–0.681) and AUC 0.512 (95% CI, 0.392–0.632) in relation to signal and alpha index, respectively (Figure 2). The monocular mfVEP demonstrated an AUC of 0.568 (95% CI, 0.446–0.684) and AUC 0.538 (95% CI, 0.417–0.657) in relation to signal and alpha index, respectively (Figure 3). The comparisons of these values are demonstrated in Figure 4.
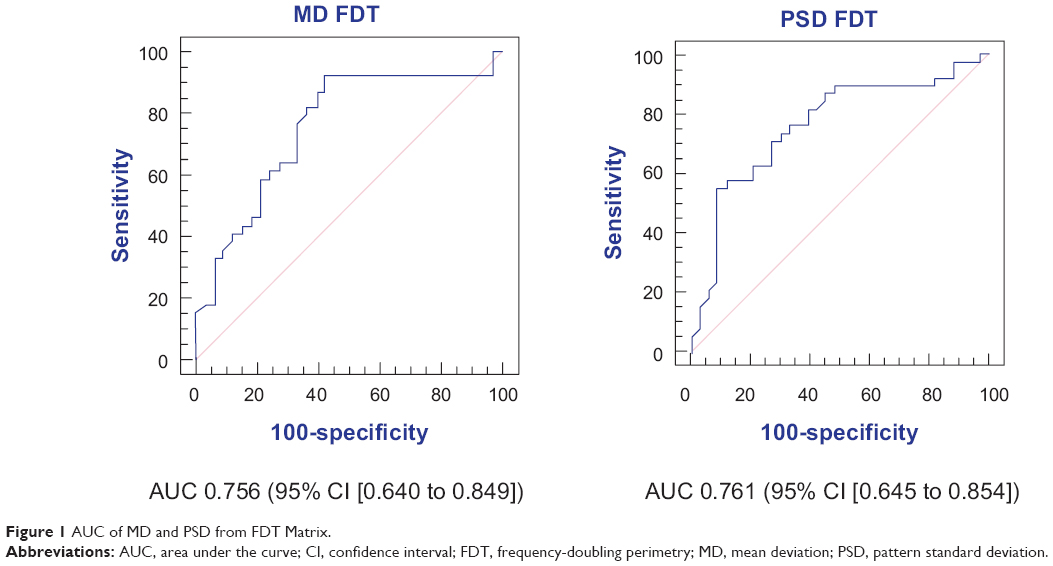 | Figure 1 AUC of MD and PSD from FDT matrix. |
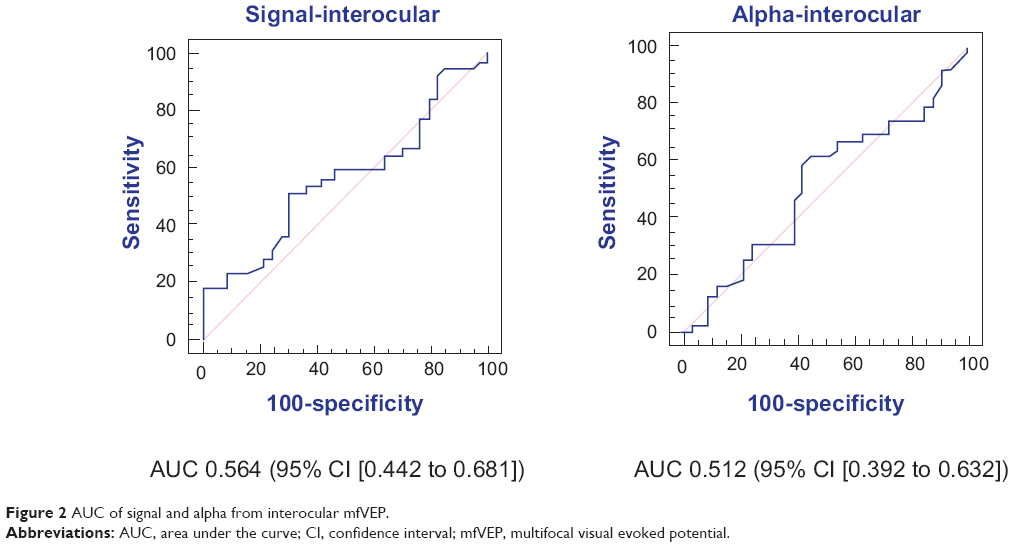 | Figure 2 AUC of signal and alpha from interocular mfVEP. |
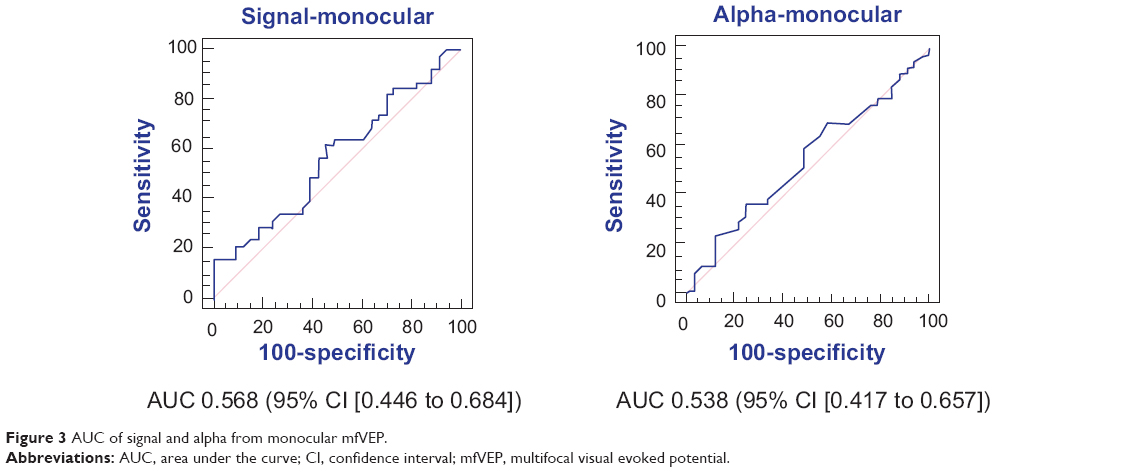 | Figure 3 AUC of signal and alpha from monocular mfVEP. |
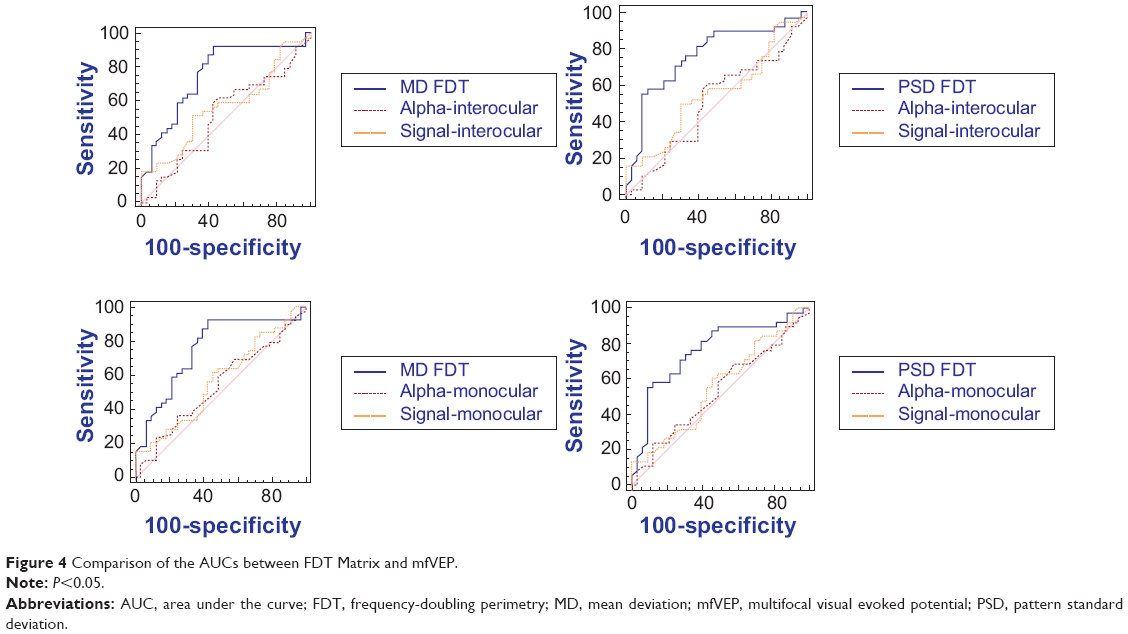 | Figure 4 Comparison of the AUCs between FDT Matrix and mfVEP. |
Discussion
The aim of this study was not to identify the correlation between SAP and FDT Matrix, but between the FDT Matrix and mfVEP. Nevertheless, it is noteworthy that the SAP and FDT tests correlate. Quigley27 demonstrated a good correlation between sensitivity and specificity indices of the FDT and Humphrey Field Analyzer® 850 (Carl Zeiss Meditec). Sponsel et al21 also identified a good correlation between the FDT and Humphrey Field Analyzer® 850 (Carl Zeiss Meditec) 30-2 in 42 glaucoma patients and 14 normal subjects. On the other hand, Kondo et al28 failed to show an acceptable correlation between the values of the FDT with Humphrey in eleven patients with normal tension glaucoma.
Compared to FDT, results of preliminary studies showed a high sensitivity in both screenings to differentiate healthy individuals from those with glaucoma and to quantify glaucomatous damage.20,27 When used for screening, Samuels and Johnson16 reported that FDT has a good sensitivity and specificity (Sensitivity 73% and specificity 93%). In our study, FDT MD showed a sensitivity of 92.3% and specificity of 80% to differentiate normal and glaucomatous eyes.
One of the objectives of this study is the identification of the best FDT criteria of abnormality. Considering the criteria suggested by Landers et al29 and Fogagnolo et al22 we compared different criteria for abnormality for screening glaucoma patients, using the FDT, and identified the criterion of at least one point with P<5% as the most suitable, with AUCs of 0.8875 (S.87.5% and E.90%). In another study,30 14% of ocular hypertensive patients had abnormal FDT with a specificity of 96%. The authors considered the criterion of two or more points with P<0.05 in the pattern deviation plot (E.96%). Fogagnolo et al22 reported an AUC of 0.926 using the FDT for glaucoma screening, very close to the values found in this study, where AUC was 0.922 between normal and glaucomatous patients and 0.721 between normal and glaucoma suspects.
In our study, the FDT Matrix showed an AUC of 0.756 (95% CI, 0.640–0.849) and 0.761 (95% CI, 0.645–0.854) compared to the MD and PSD, respectively. Depending on the criteria used, Ferreras et al31 found similar values, with AUC ranging from 0.703 to 0.861.
The mfVEP is an objective method of functional assessment with potential use in glaucoma.32 Unfortunately, it shows a significant variability between patients, mostly due to anatomical differences in the visual cortex, such as the location of the calcarine cortex compared to the position of the external electrodes, and differences of cortical folds.33 One way to reduce this individual variability was the perception that the mfVEP responses of the two eyes from the same individual are virtually identical. In glaucoma patients with asymmetric visual field loss, the comparison between the eyes (interocular) is able to identify this difference.34,35 This diagnostic ability is lost when faced with symmetric functional losses. In such cases, monocular analysis is recommended, which is compared with the database of normal patients.36–38
Studies have shown that functional tests like FDT and short-wavelength automated perimetry can detect defects in 28% to 39% of suspect glaucoma eyes with normal SAP.39,40 The authors found a similar result with mfVEP where 20% of glaucoma suspect patients showed an abnormality not found in standard SAP. In our study, 30.4% of normal patients showed an abnormal interocular mfVEP and 35.1% of glaucoma patients showed normal interocular mfVEP.
Graham et al41 using a different analysis of the mfVEP criteria, reported a rate of 18.4% change in their glaucoma suspects with normal SAP; 18.2% of glaucoma suspects had abnormal values of interocular mfVEP. Their study suggested a potential use of the mfVEP in patients with suspect glaucoma and normal SAP, suggesting an early functional diagnosis. Nevertheless, in our study, both the interocular and monocular evaluation showed poor ability to differentiate suspect to glaucomatous eyes, with AUC 0.502 and 0.532, respectively.
In disagreement with Hood et al17 who reported a greater ability to identify the interocular mfVEP glaucomatous damage in relation to monocular mfVEP, our result showed no significant difference between the monocular and interocular mfVEP values with AUC of 0.564 versus 0.568 (P=0.326).
One limitation of this study was the use of SAP as inclusion criteria and in distribution of eyes among the normal, suspect, and glaucoma groups. Its use was motivated by the possibility to compare two different functional techniques, the FDT and mfVEP, which possibly stimulate distinct cell subsets.42,43 Another limitation was the difference in age groups of individuals. The glaucoma group skewed older. It is known that the incidence of glaucoma increases with advancing years. With increasing age, a nonlinear decrease in the sensitivity of retinal ganglion cells occurs in both the SAP44 as well as the FDT.45
In conclusion, our results confirm the superiority of FDT Matrix to mfVEP in the detection of glaucomatous defects. We could not confirm the efficacy of mfVEP in detecting early glaucomatous defects, and found no difference in AUC between the interocular and monocular mfVEP analysis.
Acknowledgments
The authors thank the staff at New York Eye and Ear Infirmary for their support and assistance. They also thank Drs Robert Ritch, Jeffrey Liebmann, Celso Tello, Don Hood, and Viv Greenstein for their assistance.
Disclosure
The authors declare no conflicts of interest in this work.
References
Weinreb RN, Khaw PT. Primary open-angle glaucoma. Lancet. 2004; 363(9422):1711–1720. | ||
Consenso Brasileiro de Glaucoma Primário de Ângulo Aberto [Primary Glaucoma, Open-Angle – III Consensus of the Brazilian Society of Glaucoma] [PDF online]. San Paulo: Sociedade Brasileira de Glaucoma. 2005. Editors: PA de Arruda Mello, C Mandia Jr. Available from: http://www.sbglaucoma.com.br/pdf/consenso02.pdf. Accessed . [Portugese]. | ||
Heijl A, Leske MC, Bengtsson B, Hyman L, Bengtsson B, Hussein M; Early Manifest Glaucoma Trial Group. Reduction of intraocular pressure and glaucoma progression: results from the Early Manifest Glaucoma Trial. Arch Ophthalmol. 2002;120(10):1268–1279. | ||
Anderson DR; Normal Tension Glaucoma Study. Collaborative normal tension glaucoma study. Curr Opin Ophthalmol. 2003;14(2):86–90. | ||
Kass MA, Heuer DK, Higginbotham EJ, et al. The Ocular Hypertension Treatment Study: a randomized trial determines that topical ocular hypotensive medication delays or prevents the onset of primary open-angle glaucoma. Arch Ophthalmol. 2002;120(6):701–713; discussion 829–830. | ||
Brandt JD, Beiser JA, Kass MA, Gordon MO. Central corneal thickness in the Ocular Hypertension Treatment Study (OHTS). Ophthalmology. 2001;108(10):1779–1788. | ||
Breton ME, Drum BA. Functional testing in glaucoma: visual psychophysics and electrophysiology. In: Ritch R, Shields MB, Krupin T, eds. The Glaucomas, Vol 1. St Louis: Mosby, 1996:677–699. | ||
Wiesel TN, Hubel DH. Spatial and chromatic interactions in the lateral geniculate body of the rhesus monkey. J Neurophysiol. 1966;29(6):1115–1156. | ||
Quigley HA, Dunkelberger GR, Green WR. Retinal ganglion cell atrophy correlated with automated perimetry in human eyes with glaucoma. Am J Ophthalmol. 1989;107(5):453–464. | ||
Kerrigan-Baumrind LA, Quigley HA, Pease ME, Kerrigan DF, Mitchell RS. Number of ganglion cells in glaucoma eyes compared with threshold visual field tests in the same persons. Invest Ophthalmol Vis Sci. 2000; 41(3):741–748. | ||
Tavares IM, Melo LA Jr, Prata JA Jr, Galhardo R, Paranhos A Jr, Mello PA. No changes in anatomical and functional glaucoma evaluation after trabeculectomy. Graefes Arch Clin Exp Ophthalmol. 2006;244(5):545–550. | ||
Kim TW, Zangwill LM, Bowd C, Sample PA, Shah N, Weinreb RN. Retinal nerve fiber layer damage as assessed by optical coherence tomography in eyes with a visual field defect detected by frequency doubling technology perimetry but not by standard automated perimetry. Ophthalmology. 2007;114(6):1053–1057. | ||
Racette L, Medeiros FA, Zangwill LM, Ng D, Weinreb RN, Sample PA. Diagnostic accuracy of the Matrix 24-2 and original N-30 frequency-doubling technology tests compared with standard automated perimetry. Invest Ophthalmol Vis Sci. 2008;49(3):954–960. | ||
Johnson CA, Demirel S. The role of spatial and temporal factors in frequency-doubling perimetry. In: Wall M, Heijl A, eds. Perimetry Update 1996/1997. Proceeding of the XIIth International Perimetric Society Meeting. Amsterdam: Kugler Publications, 1997:13–19. | ||
Pederson JE, Anderson DR. The mode of progressive disc cupping in ocular hypertension and glaucoma. Arch Ophthalmol. 1980;98(3): 490–495. | ||
Johnson CA, Samuels SJ. Screening for glaucomatous visual field loss with frequency-doubling perimetry. Invest Ophthalmol Vis Sci. 1997; 38(2):413–425. | ||
Brusini P, Salvetat ML, Zeppieri M, Parisi L. Frequency doubling technology perimetry with the Humphrey Matrix 30-2 test. J Glaucoma. 2006;15(2):77–83. | ||
Hood DC, Zhang X, Winn BJ. Detecting glaucomatous damage with multifocal visual evoked potentials: how can a monocular test work? J Glaucoma. 2003;12(1):3–15. | ||
Humphrey Field Analyzer II User’s Guide. San Leandro, CA: Humphrey Instruments Inc., 1994. | ||
Anderson DR. Automated Static Perimetry. St Louis: Mosby, 1992: 76–161. | ||
Sponsel WE, Arango S, Trigo Y, Mensah J. Clinical classification of glaucomatous visual field loss by frequency doubling perimetry. Am J Ophthalmol. 1998;125(6):830–836. | ||
Fogagnolo P, Mazzolani F, Rossetti L, Orzalesi N. Detecting glaucoma with frequency doubling technology perimetry. J Glaucoma. 2005;14: 485–491. | ||
Landers JA, Goldberg I, Graham SL. Detection of early visual field loss in glaucoma using frequency-doubling perimetry and short-wavelength automated perimetry. Arch Ophthalmol. 2003;121(12):1705–1710. | ||
Hood DC, Thienprasiddhi P, Greenstein VC, et al. Detecting early to mild glaucomatous damage: a comparison of the multifocal VEP and automated perimetry. Invest Ophthalmol Vis Sci. 2004;45(2):492–498. | ||
Hodapp E, Parrish II RK, Anderson DR. Clinical Decisions in Glaucoma. St Louis: Mosby-Year Book, 1993:52–61. | ||
Francisco José A Cysneiros, Gilberto A Paula. Restricted methods in symmetrical linear regression models. Computational Statistics & Data Analysis. 2005;49(3)689–708. | ||
Quigley HA. Identification of glaucoma-related visual field abnormality with the screening protocol of frequency doubling technology. Am J Ophthalmol. 1998;125(6):819–829. | ||
Kondo Y, Yamamoto T, Sato Y, Matsubara M, Kitazawa Y. A frequency-doubling perimetric study in normal-tension glaucoma with hemifield defect. J Glaucoma. 1998;7(4):261–265. | ||
Landers J, Goldberg I, Graham S. A comparison of short wavelength automated perimetry with frequency doubling perimetry for the early detection of visual field loss in ocular hypertension. Clin Experiment Ophthalmol. 2000;28(4):248–252. | ||
Medeiros FA, Sample PA, Weinreb RN. Corneal thickness measurements and frequency doubling technology perimetry abnormalities in ocular hypertensive eyes. Ophthalmology. 2003;110(10):1903–1908. | ||
Ferreras A, Larrosa JM, Polo V, Pajarín AB, Mayoral F, Honrubia FM. Frequency-doubling technology: searching for the optimum diagnostic criteria for glaucoma. Acta Ophthalmol Scand. 2007;85(1):73–79. | ||
Baseler HA, Sutter EE, Klein SA, Carney T. The topography of visual evoked response properties across the visual field. Electroencephalogr Clin Neurophysiol. 1994;90(1):65–81. | ||
Hood DC, Zhang X. Multifocal ERG and VEP responses and visual fields: comparing disease-related changes. Doc Ophthalmol. 2000; 100(2–3):115–137. | ||
Hood DC, Zhang X, Greenstein VC, et al. An interocular comparison of the multifocal VEP: a possible technique for detecting local damage to the optic nerve. Invest Ophthalmol Vis Sci. 2000;41(6):1580–1587. | ||
Graham SL, Klistorner AI, Grigg JR, Billson FA. Objective VEP perimetry in glaucoma: asymmetry analysis to identify early deficits. J Glaucoma. 2000;9(1):10–19. | ||
Goldberg I, Graham SL, Klistorner AI. Multifocal objective perimetry in the detection of glaucomatous field loss. Am J Ophthalmol. 2002; 133(1):29–39. | ||
Klistorner A, Graham SL. Objective perimetry in glaucoma. Ophthalmology. 2000;107:2283–2299. | ||
Thienprasiddhi P, Greenstein VC, Chen CS, Liebmann JM, Ritch R, Hood DC. Multifocal visual evoked potential responses in glaucoma patients with unilateral hemifield defects. Am J Ophthalmol. 2003;136(1):34–40. | ||
Mansberger SL, Sample PA, Zangwill L, Weinreb RN. Achromatic and short-wavelength automated perimetry in patients with glaucomatous large cups. Arch Ophthalmol. 1999;117(11):1473–1477. | ||
Horn FK, Wakili N, Jünemann AM, Korth M. Testing for glaucoma with frequency-doubling perimetry in normals, ocular hypertensives, and glaucoma patients. Graefes Arch Clin Exp Ophthalmol. 2002;240(8): 658–665. | ||
Graham SL, Klistorner AI, Goldberg I. Clinical application of objective perimetry using multifocal visual evoked potentials in glaucoma practice. Arch Ophthalmol. 2005;123(6):729–739. | ||
Fortune B, Demirel S, Zhang X, Hood DC, Johnson CA. Repeatability of normal multifocal VEP: implications for detecting progression. J Glaucoma. 2006;15(2):131–141. | ||
Chauhan BC, Johnson CA. Test-retest variability of frequency-doubling perimetry and conventional perimetry in glaucoma patients and normal subjects. Invest Ophthalmol Vis Sci. 1999;40(3):648–656. | ||
Spry PG, Johnson CA. Senescent changes of the normal visual field: an age-old problem. Optom Vis Sci. 2001;78(6):436–441. | ||
Adams CW, Bullimore MA, Wall M, Fingeret M, Johnson CA. Normal aging effects for frequency doubling technology perimetry. Optom Vis Sci. 1999;76(8):582–587. |
 © 2014 The Author(s). This work is published and licensed by Dove Medical Press Limited. The
full terms of this license are available at https://www.dovepress.com/terms
and incorporate the Creative Commons Attribution
- Non Commercial (unported, 3.0) License.
By accessing the work you hereby accept the Terms. Non-commercial uses of the work are permitted
without any further permission from Dove Medical Press Limited, provided the work is properly
attributed. For permission for commercial use of this work, please see paragraphs 4.2 and 5 of our Terms.
© 2014 The Author(s). This work is published and licensed by Dove Medical Press Limited. The
full terms of this license are available at https://www.dovepress.com/terms
and incorporate the Creative Commons Attribution
- Non Commercial (unported, 3.0) License.
By accessing the work you hereby accept the Terms. Non-commercial uses of the work are permitted
without any further permission from Dove Medical Press Limited, provided the work is properly
attributed. For permission for commercial use of this work, please see paragraphs 4.2 and 5 of our Terms.