Back to Journals » Clinical Ophthalmology » Volume 19
Foveal Avascular Zone Area in Patients with Systemic Lupus Erythematosus Using Optical Coherence Tomography Angiography
Authors Rujkorakarn P ![]() , Pholprathom K
, Pholprathom K ![]() , Srihatrai P
, Srihatrai P ![]()
Received 12 January 2025
Accepted for publication 26 September 2025
Published 14 October 2025 Volume 2025:19 Pages 3807—3813
DOI https://doi.org/10.2147/OPTH.S517172
Checked for plagiarism Yes
Review by Single anonymous peer review
Peer reviewer comments 3
Editor who approved publication: Dr Scott Fraser
Ploysai Rujkorakarn,1 Kanyanat Pholprathom,2 Parinya Srihatrai2
1Department of Ophthalmology, Faculty of Medicine, Prince of Songkla University, Hatyai, Songkhla, 90110, Thailand; 2Faculty of Medicine, Mahasarakham University, Mueang Maha Sarakham, Maha Sarakham, 44000, Thailand
Correspondence: Parinya Srihatrai, Faculty of Medicine, Mahasarakham University, 79/99 Talat, Maha Sarakham, Mueang Maha Sarakham, Maha Sarakham, 44000, Thailand, Email [email protected]
Purpose: To evaluate the area of the superficial foveal avascular zone (SFAZ) and deep foveal avascular zone (DFAZ) in patients with systemic lupus erythematosus (SLE) using optical coherence tomography angiography (OCT-A) and to associate the SFAZ and DFAZ areas with medication.
Design: A cross-sectional observational study.
Patients and Methods: This study included 36 eyes of 36 SLE patients and 33 eyes of 33 healthy controls. SFAZ, DFAZ, and central retinal thickness (CRT) were measured using Spectralis OCT-A. Data on medical history and medications were collected to determine associations with SFAZ and DFAZ areas.
Results: SFAZ and DFAZ areas showed no significant association with hydroxychloroquine/chloroquine duration or immunosuppressive therapy (p> 0.05).
Conclusion: The SFAZ and DFAZ areas in patients with SLE were not significantly larger than those in healthy controls. However, the CRT was significantly thinner.
Keywords: systemic lupus erythematosus, optical coherence tomography angiography, foveal avascular zone
Introduction
Systemic lupus erythematosus (SLE) is a chronic multisystem autoimmune disease.1 SLE affects multiple organs including skin, joints, lungs, kidneys, and CNS. SLE can also affect the periorbita, ocular adnexa, eye, and optic nerve.2,3 Approximately one- third of SLE patients experience ocular involvement.4 The most common ocular manifestation is keratoconjunctivitis sicca and retinopathy is a significant cause of vision- threatening complications.2,5 The incidence of retinopathy is 3% to 29%, with a higher prevalence observed in patients with active systemic disease.6 SLE retinal vasculopathy is associated with the presence of systemic disease activity, occult or overt. All findings of retinopathy are considered to reflect vascular damage such as vasculitis and thromboembolism.7,8 However, fluorescein leakage on angiography can be detected even in eyes with a clinically unremarkable fundus examination.8,9
 |
Figure 1 Cross sectional B-scan images show superficial vascular plexus layer and deep vascular plexus layer. |
Optical coherence tomography angiography (OCT-A), a non-invasive retinal imaging technique, has recently been used for the study of the retinal and choroidal microvasculature. OCT-A is widely used to study diabetic retinopathy,10 age-related macular degeneration, retinal vascular occlusions,11 and sickle cell disease.12 A few studies have revealed decreased retinal microvascular density13 and enlargement of the foveal avascular zone (FAZ) in patients with SLE compared to normal subjects.14–16
Most studies have used the AngioVue OCT-A device (Optovue, Fremont, CA, USA). Our study provides device-specific evidence from Spectralis OCT-A, complementing recent reports (eg, 10.1186/s40942-024-00617-6) and contributing to the literature on microvascular changes in SLE.
This study aims to evaluate and compare the FAZ area in the superficial (SFAZ) and deep (DFAZ) vascular plexus layers in SLE patients (Figure 1) and healthy controls using Spectralis OCT-A (Heidelberg Engineering, Heidelberg, Germany). We hypothesize that SLE patients will exhibit significant differences in SFAZ and DFAZ areas compared to healthy controls, potentially revealing novel patterns of retinal microvascular involvement in this disease.
Materials and Methods
Study Design and Setting
This cross-sectional observational study was conducted at Suddhavej Hospital, Faculty of Medicine, Mahasarakham University, from July 2020 to June 2021. This study was approved by the Mahasarakham University Review Board, and adhered to the tenets of the Declaration of Helsinki.
Study Participants
Inclusion Criteria
Patients with SLE and healthy controls older than 18 years of age. Patients with SLE were diagnosed by internists according to the American College of Rheumatology classification criteria.14 All participants provided written informed consent prior to their inclusion in the study.
Exclusion Criteria
(1) poor quality of images and (2) ocular pathologies that affect the FAZ, such as macular edema secondary to diabetic retinopathy or retinal vein occlusion.
Based on previous studies reporting FAZ area measurements, a sample size of 30 eyes per group was estimated to achieve 80% power at a 0.05 significance level to detect a mean difference of 0.05 mm2 in FAZ area, assuming a standard deviation of 0.1 mm2. Our study exceeded this target with 36 SLE eyes and 33 control eyes. Thirty-six eyes of 36 patients with SLE (study group) and 33 eyes of 33 age- and sex-matched healthy subjects (control group) were included in this study. If both eyes of a participant were eligible, one eye was randomly selected for inclusion in the analysis to avoid inter-eye correlation. Data on age, sex, duration of hydroxychloroquine or chloroquine (HCQ/CQ) treatment, immunosuppressive drug use, and ocular findings were collected. All participants underwent a standard ophthalmic examination, including best-corrected visual acuity using Snellen’s chart, intraocular pressure measurement using an air-puff tonometer due to the study population was deemed to have low risk of glaucoma, and the air puff was used for that reason, slit-lamp examination of the anterior segment, and fundus examination. OCT scans with spectral domain OCT (Spectralis OCT, Heidelberg Engineering, Heidelberg, Germany) were performed to measure central retina thickness (CRT) automatically from the software of the system and the area was corrected by the same retina specialist.CRT was defined as the average thickness of the macula in the central 1 mm diameter ring of the ETDRS grid. Data from the right eye were used for the analyses.
Five frames were averaged, with a distance of 6 μm between B-scans, to ensure high-quality imaging.
Study Outcome and Measures
The primary outcome was the comparison of the SFAZ and DFAZ areas between the study and control groups.
The secondary outcomes were (1) comparison of CRT between the study and control groups. (2) To determine the possible relationship between the SFAZ and DFAZ and the duration of HCQ/CQ use. (3) To determine the possible relationship between SFAZ, DFAZ, and immunosuppressive therapy.
Statistical Analysis
STATA version 15 (Stata Corp., College Station, Texas, USA) was used for statistical analyses. Categorical data are presented as percentages (%) and numbers (n). Continuous variables were presented as means with standard deviations (SD) according to their normal distribution patterns. Differences between the two groups were compared using the t-test for continuous data and Fisher’s exact test for categorical data. The intraclass correlation coefficient (ICC) was calculated to assess the inter-rater reliability. Statistical significance was set at p < 0.05.
Results
Baseline characteristics between study group and control group were similar. In the study group, the mean age was 31.80±10.96 years. Thirty-four patients were female (Table 1). All enrolled SLE patients were asymptomatic for ocular complaints, and the clinical ophthalmic examination, including dilated funduscopy, revealed no signs of active retinopathy, macular edema, or other pathologies that would meet the exclusion criteria. Thirty-three patients (91.67%) were having CQ/HCQ.
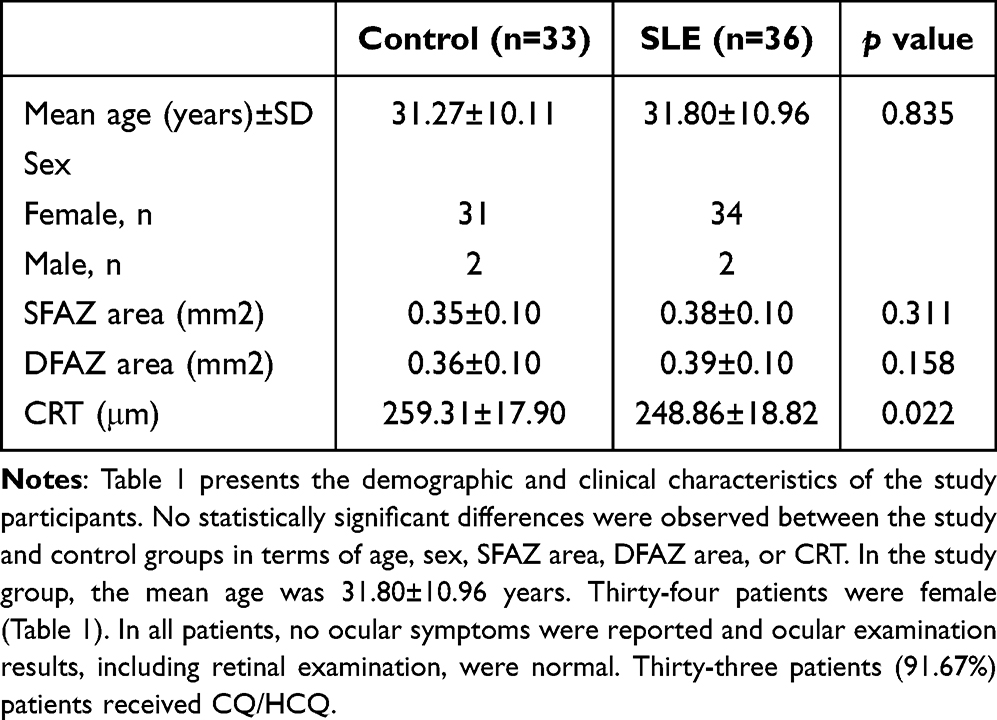 |
Table 1 Demographic and Clinical Characteristics of the Study Participants |
The mean area of SFAZ and DFAZ in study group were 0.38±0.10 mm2 and 0.39 ±0.10 mm2, respectively (Table 2). Both areas were larger than those in control group (0.35±0.10 mm2, 0.36±0.10 mm2). However, there was no significant difference between the groups (SFAZ: p=0.311; DFAZ: p=0.158). Figure 2 shows representative images of the FAZ and DFAZ in patients with SLE. The inter-rater reliability for FAZ area measurement by the two retinal specialists was excellent (SFAZ: ICC = 0.992, 95% CI: 0.988–0.994; DFAZ: ICC = 0.987, 95% CI: 0.981–0.990).
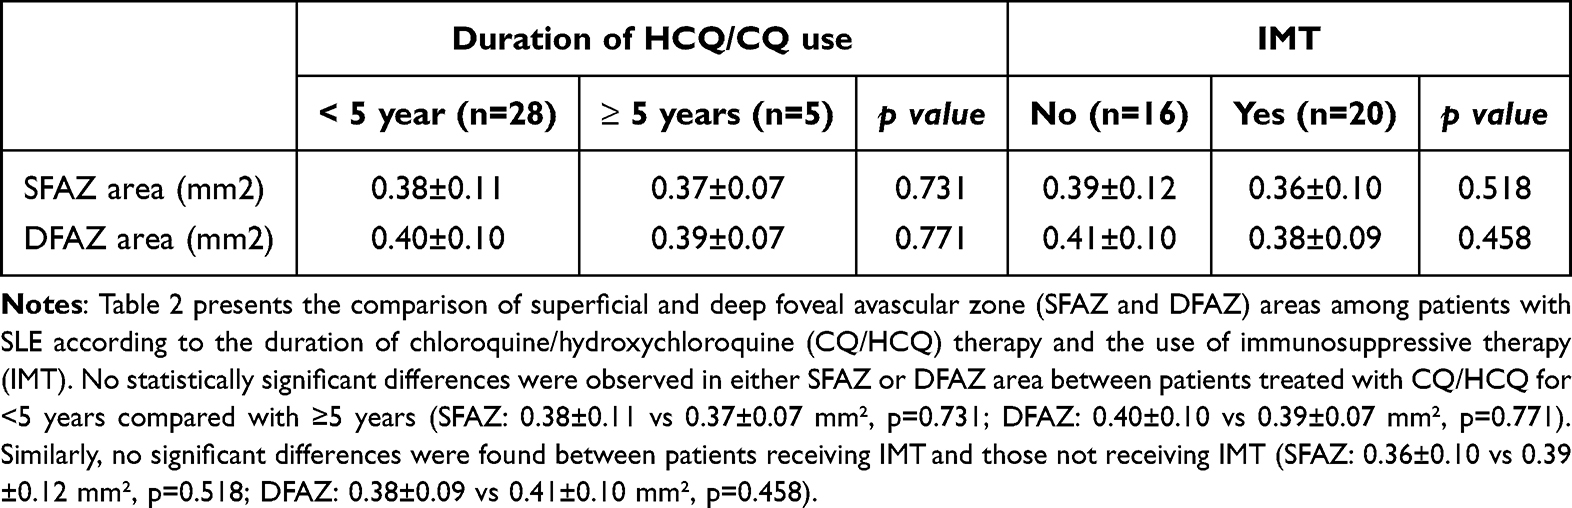 |
Table 2 Comparison of the Area of Superficial Foveal Avascular Zone and Deep Foveal Avascular Zone Between Patients Using HCQ/CQ for <5 years and ≥ 5 years and Immunosuppressive Therapy |
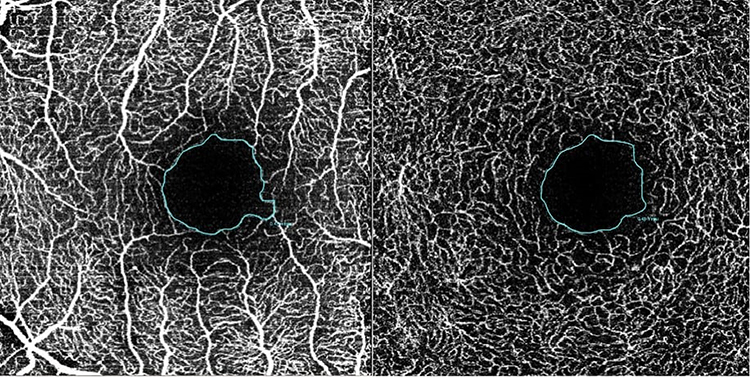 |
Figure 2 Representative images of the SFAZ (left) and DFAZ (right) in a patient with SLE. |
The mean CRT in the study group and control group were 248.86±18.82 μm and 259.31± 7.90 μm, respectively. The CRT in the study group was significantly lower than that in the control group (p=0.022).
Comparison of SFAZ and DFAZ areas between patients treated with HCQ/CQ for <5 years and ≥5 years did not show statistically significant differences (SFAZ: p=0.731, DFAZ: p=0.771).
Discussion
SLE retinopathy may present with cotton-wool spots, retinal hemorrhages, and vascular changes. Fluorescein angiography can reveal leakage or capillary nonperfusion even in clinically normal eyes. OCT-A provides a non-invasive approach to detect such microvascular abnormalities at an early stage.
The FAZ was devoid of retinal blood vessels. Size and shape of the FAZ have been studied and demonstrated to be an indicator of retinal pathology.18 Enlargement of FAZ was found in diseases involving macular circulation deficiency such as diabetic retinopathy and retinal vein occlusion.19–21,22,23 Previous studies in SLE patients showed enlarged FAZ area in comparison with controls.14–16,24 In contrast to previous studies, our result found enlargement of SFAZ area and DFAZ area in patients with SLE, but no statistically significant difference from controls. However, the interpretation should be cautioned because of differences in the device and segmentation. Corvi et al suggested that the comparison between instruments should be evaluated with concern, and the set of measurements from the various instruments is not interchangeable regarding FAZ for both the superficial and deep capillary plexus.25,26 Our results should be used for comparison with the data produced by the Spectralis OCT-A device.
In this study, patients with HCQ/CQ underwent ophthalmic examination following the American Academy of Ophthalmology recommendations for screening for HCQ and CQ retinopathy in 2016. The risk of HCQ retinal toxicity is < 1% with recommended doses up to 5 years and increases sharply after 5 years.22 Bulut et al found that FAZ area in patients using HCQ for ≥ 5 years was wider than patients using HCQ for < 5 years.24 We could not detect the difference between those groups probably because of too few patients in taking HCQ/CQ for ≥ 5 years group.
Immunosuppressive drugs are primarily used to treat inflammatory ocular disorders. In SLE, immunosuppressive drugs are used to control disease and ocular inflammation. Drug regimens for the initial therapy typically include high-dose oral corticosteroids that are tapered if the disease is quiet. An immunosuppressive drug is added to an oral corticosteroid regimen for a patient with chronic disease to control inflammation in response to corticosteroids alone and to prevent corticosteroid-induced toxicity.27,28 Common ocular side effects of IMT include cataracts and glaucoma due to corticosteroids, and reactivation of cytomegalovirus retinitis and toxoplasmic chorioretinitis have been reported; however.29 We were unable to find any literature that found an association between the FAZ area and IMT. However, we did not find a difference in FAZ area between patients with SLE with and without IMT.
We found a significant reduction in CRT in patients with SLE compared with that in controls. An et al also found that foveal retinal thickness significantly decreased in with SLE patients.14 Bulet et al detected slight thinning of the foveal, parafoveal, and perifoveal macular thickness in patients treated with HCQ/CQ for ≥ 5 years.23 Several studies have reported that HCQ/CQ retinopathy commonly involves the parafoveal and perifoveal regions. Retinal thinning is an early sign of retinal toxicity despite normal fundus.30,31 CRT thinning related to SLE, HCQ/CQ retinal toxicity, or both, requires further investigation.
A key limitation of this study is its cross-sectional design and small sample size. Furthermore, a significant methodological limitation is the lack of data on axial length and intraocular pressure. We were therefore unable to perform magnification correction (eg, using the Littmann-Bennett formula), which is important as ocular axial length can significantly affect the dimensions of OCT-A measurements. The use of an air-puff tonometer rather than Goldmann applanation tonometry also provided less precise IOP measurements. Future prospective studies with larger cohorts and correction for ocular magnification are warranted to confirm these findings.
Conclusion
In this cohort, SLE was not associated with a statistically significant enlargement of the SFAZ or DFAZ when measured with Spectralis OCT-A. However, a significant thinning of the CRT was observed. These findings underscore the importance of considering device-specific differences in OCT-A measurements and suggest that CRT thinning may be a more sensitive biomarker of early retinal changes than FAZ area in some SLE populations.
Data Sharing Statement
The data that support the findings of this study are available from the corresponding author upon reasonable request.
Acknowledgments
We thank Dr. Sunpong Jiamsawad, MD (Sungaikolok Hospital) for comments on the manuscript and Dr. Nirun Intarut, PhD (Faculty of Medicine, Mahasarakham University) for assistance with the analysis.
Author Contributions
All authors made a significant contribution to the work reported, whether that is in the conception, study design, execution, acquisition of data, analysis and interpretation, or in all these areas; took part in drafting, revising or critically reviewing the article; gave final approval of the version to be published; have agreed on the journal to which the article has been submitted; and agree to be accountable for all aspects of the work.
Funding
The authors disclose receipt of financial support for the research, authorship, and/or publication of this article, which was supported by the Faculty of Medicine, Mahasarakham University [210/2020].
Disclosure
The author(s) report no conflicts of interest in this work.
References
1. Shaikh MF, Jordan N, D’Cruz DP. Systemic lupus erythematosus. Clin Med. 2017;17(1):78–83. doi:10.7861/clinmedicine.17-1-78
2. Palejwala NV, Walia HS, Yeh S. Ocular manifestations of systemic lupus erythematosus: a review of the literature. Autoimmune Dis. 2012;2012:290898. doi:10.1155/2012/290898
3. Arevalo JF, Lowder CY, Muci-Mendoza R. Ocular manifestations of systemic lupus erythematosus. Curr Opin Ophthalmol. 2002;13(6):404–410. doi:10.1097/00055735-200212000-00011
4. Dammacco R. Systemic lupus erythematosus and ocular involvement: an overview. Clin Exp Med. 2018;18(2):135–149. doi:10.1007/s10238-017-0479-9
5. Silpa-archa S, Lee JJ, Foster CS. Ocular manifestations in systemic lupus erythematosus. Br J Ophthalmol. 2016;100(1):135–141. doi:10.1136/bjophthalmol-2015-306629
6. Davies JB, Rao PK. Ocular manifestations of systemic lupus erythematosus. Curr Opin Ophthalmol. 2008;19(6):512–518. doi:10.1097/ICU.0b013e3283126d34
7. Ushiyama O, Ushiyama K, Koarada S, et al. Retinal disease in patients with systemic lupus erythematosus. Ann Rheum Dis. 2000;59(9):705–708. doi:10.1136/ard.59.9.705
8. Tolba DA, El-Fayoumi DM, Abdelaziz MS, Nabih MH. Fluorescein angiographic findings in patients with active systemic lupus erythematosus. Ocul Immunol Inflamm. 2017;25(6):884–890. doi:10.1080/09273948.2016.1192653
9. Mizuno Y, Nishide M, Wakabayashi T, et al. OCTA, a sensitive screening for asymptomatic retinopathy, raises alarm over systemic involvements in patients with SLE. Ann Rheum Dis. 2020;79(2):e17. doi:10.1136/annrheumdis-2018-214751
10. Freiberg FJ, Pfau M, Wons J, et al. Optical coherence tomography angiography of the foveal avascular zone in diabetic retinopathy. Graefes Arch Clin Exp Ophthalmol. 2016;254(6):1051–1058. doi:10.1007/s00417-015-3148-2
11. Adhi M, Filho MA, Louzada RN, et al. Retinal capillary network and foveal avascular zone in eyes with vein occlusion and fellow eyes analyzed with optical coherence tomography angiography. Invest Ophthalmol Vis Sci. 2016;57(9):OCT486–OCT494. doi:10.1167/iovs.15-18907
12. Chalam KV, Sambhav K. Optical coherence tomography angiography in retinal diseases. J Ophthalmic Vis Res. 2016;11(1):84–92. doi:10.4103/2008-322X.180709
13. Conigliaro P, Cesareo M, Chimenti MS, et al. Evaluation of retinal microvascular density in patients affected by systemic lupus erythematosus: an optical coherence tomography angiography study. Ann Rheum Dis. 2019;78(2):287–289. doi:10.1136/annrheumdis-2018-214235
14. An Q, Gao J, Liu L, Liao R, Shuai Z. Analysis of foveal microvascular abnormalities in patients with systemic lupus erythematosus using optical coherence tomography angiography. Ocul Immunol Inflamm. 2020;1–6.
15. Shah C, Gabriel R, Kedhar S, Kuppermann B, Mehta M. Subclinical foveal vasculopathy in patients with systemic lupus erythematosus using optical coherence tomography angiography. J VitreoRetinal Dis. 2019;3(5):283–288. doi:10.1177/2474126419850758
16. Mihailovic N, Leclaire MD, Eter N, Brucher VC. Altered microvascular density in patients with systemic lupus erythematosus treated with hydroxychloroquine—an optical coherence tomography angiography study. Graefes Arch Clin Exp Ophthalmol. 2020;258(10):2263–2269. doi:10.1007/s00417-020-04788-4
17. Hochberg MC. Updating the American college of rheumatology revised criteria for the classification of systemic lupus erythematosus. Arthritis Rheum. 1997;40(9):40. doi:10.1002/art.1780400928
18. Shiihara H, Terasaki H, Sonoda S, et al. Objective evaluation of size and shape of superficial foveal avascular zone in normal subjects by optical coherence tomography angiography. Sci Rep. 2018;8(1):10143. doi:10.1038/s41598-018-28530-7
19. Khalil GF, Iafe NA, Jean-Pierre H, et al. Optical coherence tomography angiography analysis of the foveal avascular zone and macular vessel density after anti-VEGF therapy in eyes with diabetic macular edema and retinal vein occlusion. Invest Ophthalmol Vis Sci. 2017;58(1):30–34. doi:10.1167/iovs.16-20579
20. Takase N, Nozaki M, Kato A, et al. Enlargement of foveal avascular zone in diabetic eyes evaluated by en face optical coherence tomography angiography. Retina. 2015;35(11):2377–2383. doi:10.1097/IAE.0000000000000849
21. Wons J, Pfau M, Wirth MA, et al. Optical coherence tomography angiography of the foveal avascular zone in retinal vein occlusion. Ophthalmologica. 2016;235(4):195–202. doi:10.1159/000445482
22. Marmor MF, Kellner U, Lai TY, et al. American academy of ophthalmology. Recommendations on screening for chloroquine and hydroxychloroquine retinopathy (2016 revision). Ophthalmology. 2016;123(6):1386–1394. doi:10.1016/j.ophtha.2016.01.058
23. Bulut M, Akidan M, Gozkaya O, et al. Optical coherence tomography angiography for screening of hydroxychloroquine-induced retinal alterations. Graefes Arch Clin Exp Ophthalmol. 2018;256(11):2075–2081. doi:10.1007/s00417-018-4117-3
24. Pichi F, Woodstock E, Hay S, Neri P. Optical coherence tomography angiography findings in systemic lupus erythematosus patients with no ocular disease. Int Ophthalmol. 2020;40(8):2111–2118. doi:10.1007/s10792-020-01388-3
25. Corvi F, Pellegrini M, Erba S, et al. Reproducibility of vessel density, fractal dimension, and foveal avascular zone using 7 different optical coherence tomography angiography devices. Am J Ophthalmol. 2018;186:25–31. doi:10.1016/j.ajo.2017.11.011
26. Mihailovic N, Brand C, Lahme L, et al. Repeatability, reproducibility, and agreement of foveal avascular zone measurements using three different optical coherence tomography angiography devices. PLoS One. 2018;13(10):e0206045. doi:10.1371/journal.pone.0206045
27. Jabs DA, Rosenbaum JT, Foster CS, et al. Guidelines for the use of immunosuppressive drugs in patients with ocular inflammatory disorders: recommendations of an expert panel. Am J Ophthalmol. 2000;130(4):492–513. doi:10.1016/s0002-9394(00)00659-0
28. Hornbeak DM, Thorne JE. Immunosuppressive therapy for eye diseases: effectiveness, safety, side effects, and their prevention. Taiwan J Ophthalmol. 2015;5(4):156–163. doi:10.1016/j.tjo.2015.03.004
29. Castillejo Becerra MC, Ding Y, Kenol B, et al. Ocular side effects of antirheumatic medications: a qualitative review. BMJ Open Ophthalmol. 2020:
30. de Sisternes L, Hu J, Rubin DL, Marmor MF. Localization of damage in progressive hydroxychloroquine retinopathy on and off the drug: inner versus outer retina, parafovea versus peripheral fovea. Invest Ophthalmol Vis Sci. 2015;56(5):3415–3426. doi:10.1167/iovs.14-16345
31. Pasadhika S, Fishman G, Choi D, et al. Selective thinning of the perifoveal inner retina as an early sign of hydroxychloroquine retinal toxicity. Eye. 2010;24(5):756–763. doi:10.1038/eye.2010.21
 © 2025 The Author(s). This work is published and licensed by Dove Medical Press Limited. The
full terms of this license are available at https://www.dovepress.com/terms
and incorporate the Creative Commons Attribution
- Non Commercial (unported, 4.0) License.
By accessing the work you hereby accept the Terms. Non-commercial uses of the work are permitted
without any further permission from Dove Medical Press Limited, provided the work is properly
attributed. For permission for commercial use of this work, please see paragraphs 4.2 and 5 of our Terms.
© 2025 The Author(s). This work is published and licensed by Dove Medical Press Limited. The
full terms of this license are available at https://www.dovepress.com/terms
and incorporate the Creative Commons Attribution
- Non Commercial (unported, 4.0) License.
By accessing the work you hereby accept the Terms. Non-commercial uses of the work are permitted
without any further permission from Dove Medical Press Limited, provided the work is properly
attributed. For permission for commercial use of this work, please see paragraphs 4.2 and 5 of our Terms.