Back to Journals » Cancer Management and Research » Volume 13
Fourier Transform Infrared Spectroscopy: An Innovative Method for the Diagnosis of Ovarian Cancer
Authors Li L, Wu J, Yang L, Wang H, Xu Y, Shen K
Received 13 November 2020
Accepted for publication 3 February 2021
Published 12 March 2021 Volume 2021:13 Pages 2389—2399
DOI https://doi.org/10.2147/CMAR.S291906
Checked for plagiarism Yes
Review by Single anonymous peer review
Peer reviewer comments 3
Editor who approved publication: Dr Xueqiong Zhu
Lei Li,1 Jinguang Wu,2 Limin Yang,3 Huizi Wang,4 Yizhuang Xu,2 Keng Shen1
1Department of Obstetrics and Gynecology, Peking Union Medical College Hospital, Chinese Academy of Medical Sciences & Peking Union Medical College, Beijing, People’s Republic of China; 2Beijing National Laboratory for Molecular Sciences, State Key Laboratory for Rare Earth Materials Chemistry and Applications, College of Chemistry and Molecular Engineering, Peking University, Beijing, People’s Republic of China; 3State Key Laboratory of Nuclear Physics and Technology, Institute of Heavy Ion Physics, School of Physics, Peking University, Beijing, People’s Republic of China; 4Medical Science Research Center, Peking Union Medical College Hospital, Chinese Academy of Medical Sciences & Peking Union Medical College, Beijing, People’s Republic of China
Correspondence: Keng Shen
Department of Obstetrics and Gynecology, Peking Union Medical College Hospital, Chinese Academy of Medical Sciences & Peking Union Medical College, No. 1 Shuai Fu Yuan, Eastern District, Beijing 100730, People’s Republic of China
Tel +86 13911519118
Email [email protected]
Yizhuang Xu
Beijing National Laboratory for Molecular Sciences, State Key Laboratory for Rare Earth Materials Chemistry and Applications, College of Chemistry and Molecular Engineering, Peking University, No. 202 Chengfu Road, Haidian District, Beijing 100871, People’s Republic of China
Tel +86 18600896025
Email [email protected]
Abstract: Ovarian cancer is the most lethal gynecologic malignancy due to the late diagnoses at advanced stages, drug resistance and the high recurrence rate. Thus, there is an urgent need to develop new techniques to diagnose and monitor ovarian cancer patients. Fourier transform infrared (FTIR) spectroscopy has great potential in the diagnosis of this disease, as well as the real-time monitoring of cancer development and chemoresistance. As a noninvasive, simple and convenient technique, it can not only distinguish the molecular differences between normal and malignant tissues, but also be used to identify the characteristics of different types of ovarian cancer. FTIR spectroscopy is also widely used in monitoring cancer cells in response to antitumor drugs, distinguishing cells in different growth states, and identifying new synthetic drugs. In this paper, the applications of FTIR spectroscopy for ovarian cancer diagnosis and other works carried out so far are described in detail.
Keywords: diagnosis, Fourier transform infrared spectroscopy, ovarian cancer, spectral feature, tumor monitoring
Introduction
The incidence of ovarian cancer is lower than that of cervical cancer and endometrial cancer of the gynecologic malignancies, but its mortality rate is the highest, accounting for 295,414 new diagnoses and 184,799 new deaths worldwide in 2018.1,2 In developed regions, the number of new cases of ovarian cancer is more than that of cervical cancer.3–5 One of the main reasons for the high mortality rate is that there are no symptoms or the symptoms are mild and atypical for early-stage ovarian cancer, leading to difficulty in early detection and treatment;6,7 other reasons include drug resistance and difficulty with controlling and monitoring cancer metastasis and recurrence.8–10 Most of the patients are at advanced stages at the time of diagnosis, and the established treatment strategy is cytoreductive surgery followed by neoadjuvant platinum chemotherapy.11 Although the combination of poly(ADP-ribose) polymerase (PARP) inhibitors and/or drugs targeting homologous recombination deficiency improves the efficacy of platinum chemotherapy, up to 80% of patients relapse, and the median progression-free survival is estimated to be approximately12–18 months.12 Therefore, it is necessary to develop new methods for diagnosing and monitoring ovarian cancer patients.
Fourier transform infrared (FTIR) spectroscopy is widely applied to the biomedical sample analysis.13,14 This technique is dependent on the absorption of infrared light through vibrational transitions in covalent bonds, in which the intensities offer quantitative data and the frequencies indicate the properties and structure of the bonds. Here, FTIR spectroscopy was mainly used to detect the absorption modes in the mid-infrared region (4000–600 cm−1). The sharp bands in this region primarily come from the specific vibrations from biomolecules, such as proteins, nuclear acids, lipids and carbohydrates, which result in a highly distinct absorption pattern and spectral profile for each sample (Figure 1).15–17 FTIR spectroscopy is a simple, rapid and noninvasive measuring technique in which clear characteristic wavebands can be used as spectral makers for a sample.
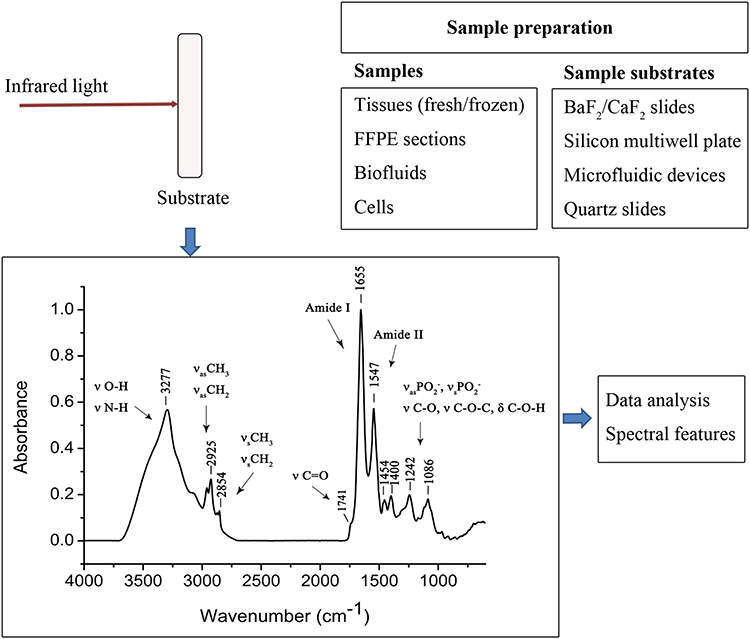 |
Figure 1 Schematic illustration for the FTIR spectroscopy measurement flow. The main procedures include sample preparation, spectral acquisition and data analysis. Pretreatment of the samples depends on the sample type. The sample is then placed on a substrate, such as BaF2 slides, for IR spectroscopy. The representative IR spectrum is presented from an A2780 ovarian cancer cell line. The main absorption bands indicating cellular components are the asymmetric and symmetric vibrations (νasym CH3 and CH2) of fatty acyl moieties, ester C=O stretching of phospholipids, protein absorption bands (Amide I and Amide II), asymmetric and symmetric phosphodiester vibrations of nucleic acids (νasPO2− and νsPO2−), and C–O–C vibrations for sugars. Spectral features were extracted and the data analysis was complex according to the aim of the research. The schematic refers to previous studies.15–17 |
During the early stage of tumor occurrence or in the process of tumor deterioration, tissues and blood or other liquids from the body undergo changes in metabolism and in the composition and content of the main biomolecules that make up tissues and cells.18,19 However, these changes have not yet led to specific clinical symptoms or imaging changes. FTIR technology enables the capture of these tiny changes in precancerous lesions or during cancer progression through the biochemical and molecular information they provide.20 Molecular structure changes, particularly the secondary structure of proteins, are also available from the FTIR spectral analysis.21 Thus, these changes can be identified as cancer markers, enabling sensitive and specific distinction between normal and tumor tissues and the real-time monitoring of tumor progression. Other potential uses of FTIR spectroscopy for biomedical detection have been demonstrated in multiple areas, including distinguishing cell apoptosis from necrosis,22 monitoring cell growth and differentiation,23 identifying stem cell differentiation phenotypes,24 and detecting and imaging cell organelles.25 The purpose of this review is to provide a description of the work carried out so far in the application of FTIR spectroscopy in ovarian cancer, the most lethal cancer in women.
The Application of FTIR Spectroscopy in the Diagnosis of Ovarian Cancer
Ovarian cancer is the third most common cancer in women with malignant tumors, and the incidence of ovarian cancer exceeds that of cervical cancer in developed populations.3 Current diagnostic methods for ovarian cancer include histopathological diagnosis, the measurement of biomarkers such as cancer antigen 125 (CA-125), and imaging techniques such as computed tomography (CT) and magnetic resonance imaging (MRI).26,27 However, histopathological examination has limitations, including complicated operation, time-consumption, and reliance on subjective judgment.28 CA-125 detection shows low specificity and sensitivity, and CA-125 levels also increase in other types of cancer, such as breast, endometrial and lung cancer, and fluctuate during the menstrual cycle of premenopausal women.29,30 CT and MRI are expensive and difficult to use in the diagnosis of early-stage ovarian cancer.31 New methods for early detection and prevention by molecular genomics are being rapidly developed. With the development of the personalized medicine era, next-generation sequencing has become more widely used to determine the precise genetic map of patients and to identify new mutations for new drug targets. For example, ovarian cancer patients with BRCA mutations or homologous recombination deficiency acquire therapeutic benefits from platinum drugs and PARP inhibitors, while immune checkpoint inhibitors are available for tumors with microsatellite instability.32 As a convenient, sensitive and rapid technique, FTIR spectroscopy has also been indicated to be valuable and widely used in multiple tumors, such as in the diagnosis of lung,33 breast,34 colorectal,35,36 cervical,37 gastric,38 liver39 and thyroid tumors.40
The Diagnosis of Ovarian Cancer Using Tissue Samples
The study of the infrared spectrum in ovarian cancer diagnosis has been developed in recent years (Table 1). In 2007, Krishna et al41 used FTIR and Raman spectroscopy to analyze paraffin-embedded tissue samples of normal ovaries, benign ovarian tumors and malignant ovarian neoplasms. They demonstrated that normal tissues showed significantly higher levels of protein and lower levels of DNA and lipids than cancer tissues, and benign tissues had higher levels of protein and lower levels of DNA and lipids than malignant tissues. Subsequently, Mehrotra et al42 reported higher lipid and DNA content in frozen sections of cancer tissues than in normal tissues. Changes in the secondary structure of proteins in cancer tissues have also been observed. When identifying the heterogeneous subtypes of 35 benign ovarian tumors, 30 borderline ovarian tumors and 106 cases of ovarian epithelial cancer (including serous, mucinous, clear cell and endometrioid ovarian cancers), Theophilou et al43 reported that the relative content of lipid/protein and nucleic acid/carbohydrate were higher in paraffin-fixed malignant tissues than in borderline and benign tissues. The ratio of the RNA/DNA absorption peaks was lower in malignant tissues than in normal and benign tissues. In 2018, Grzelak et al44 used synchrotron radiation-based FTIR spectroscopy (SR-FTIR) from 8 frozen tissue samples of ovarian cancer patients and revealed increased content of lipids and DNA in the malignant cases. In addition, the protein content was also increased in malignant tumors compared to borderline ovarian tumors. Our previous work investigated five ovarian cancer cell lines versus a normal epithelial cell line and was validated by 12 frozen tissues from epithelial ovarian cancer patients.45 We observed an increased amount of protein in ovarian cancer cell lines and an altered secondary structure of protein. We also found that the ratio of 1454/1400 was lower in malignant cells/tissues than in normal cells/tissues. Although the use of infrared spectroscopy technology for ovarian cancer diagnosis has not been widely studied, these results suggest that infrared spectroscopy can distinguish normal ovaries from benign, borderline and malignant tumors via the analysis of protein, nucleic acid and lipid content, as well as protein conformation. However, some of the results are diverse and controversial. This may be partially due to the different preparation processes for the samples (fresh, frozen or paraffin-fixed samples), the small sample size, and the complex characteristics of ovarian cancer tissues in these studies.
 |
Table 1 Diagnosis of Ovarian Cancer Using Tissue Samples Included in the Review |
The Diagnosis of Ovarian Cancer Using Blood and Urine Samples
In addition to the infrared imaging of cancer cells and tissues, the spectral analysis of serum or plasma from patients can also be used to diagnose ovarian cancer. Gajjar et al46 demonstrated a 96.7% accuracy in diagnosing ovarian cancer (30 ovarian cancer patients vs 30 normal controls) and an 81.7% accuracy in diagnosing endometrial cancer (30 endometrial cancer patients vs 30 normal controls) using serum or plasma samples by attenuated total reflection FTIR (ATR-FTIR) spectra coupled with a proposed classification method. Owens et al47 explored the spectral characteristics of serum and plasma in patients with ovarian cancer using both ATR-FTIR and Raman spectroscopy. The diagnostic accuracy of the Raman spectrum was 74%, and that of the ATR-FTIR spectrum was 93.3%. Lima et al48 further confirmed a 100% sensitivity and specificity for differentiating stage I from stages II–IV in ovarian cancer, a 94.0% sensitivity and specificity for diagnosing serous and non-serous ovarian cancers, and a 100% sensitivity and specificity for distinguishing between patients under 60 years of age and those over 60 years of age using plasma samples; the diagnostic accuracies for these categories were 91.6%, 93.0% and 96.0%, respectively, when the spectra from patients’ serum samples were used.
In a recent study, Paraskevaidi et al49 used ATR-FTIR spectroscopy to assess urine samples from patients with endometrial cancer (n = 10), patients with ovarian cancer (n = 10) and normal subjects (n = 10). The diagnostic accuracy was high for both cancers (endometrial: 95%; ovarian: 100%). These findings provide preliminary evidences that infrared spectroscopy from blood and urine samples can potentially be a powerful tool for screening and diagnosing ovarian cancer. Another advantage is that as a non-destructive, label-free and sensitive technique, FTIR imaging, which relies on a minimal amount of blood and urine samples, shows no harm to ovarian cancer patients.
The Diagnosis of Ovarian Cancer Using Distinctive Marker Groups
FTIR spectroscopy is powerful for analyzing functional groups within molecules. The methylation of cytokines in CpG islands has been demonstrated to induce ovarian cancer. FTIR spectroscopy can distinguish cells with high methylation levels from those with low methylation levels, an ability that may lead to the early diagnosis of ovarian cancer and the identification of demethylating anticancer drugs.50 This result also provides new insights for potential ovarian cancer diagnosis by detecting the known molecular biomarkers screened by previous studies.
Comparison of FTIR Spectroscopy with Other Diagnostic Methods
As an assistive diagnostic technique, FTIR spectroscopy has been used in multiple cancers, including ovarian cancer, showing high specificity and accuracy. Thus, the efficacy of the FTIR technique has been compared with widely used methods. Sindhuphak et al51 compared FTIR results with histological examinations on cervical cell samples from 108 abnormal and 167 normal cases of Thai women undergoing hysterectomy. According to the histological results, the FTIR results showed up to a 96.3% sensitivity and 96.4% specificity. When high definition (HD) and ultra-high definition (UHD) FTIR spectral data were compared with histopathological examination in a breast cancer mouse model, the two methods showed good consistency with respect to the localization of metastases smaller than 1 mm. In addition, the infrared spectra can differentiate the types of malignant cells.52 These results show that spectral histopathology is in good agreement with the histopathological diagnosis, and can provide more specific and in-depth interpretation.
Smolina et al53 demonstrated that FTIR data were in strong correlation with the gene expression mode in diverse breast cancer cell lines, indicating that the two methods exhibited consistent patterns of cell variations. Rymsza et al54 also observed that ATR-FTIR spectroscopy analysis was consistent with the results of PCR testing that amplified the L1 gene for human papillomavirus (HPV) detection in 41 patients undergoing gynecological examination. These results show that spectral detection and molecular detection have the same effectiveness in some aspects.
The Real-Time Monitoring of Tumor Development and Treatment Progress by FTIR Spectroscopy
FTIR Detection of Response to Chemotherapy
Real-time monitoring of ovarian cancer development and treatment process is still in the laboratory stage using cell lines. For example, infrared spectroscopy has preliminarily shown potential for the identification of chemoresistance. Zendehdel et al55 used FTIR spectroscopy to study two cisplatin-resistant ovarian cancer cell lines (OV2008-DDP (C13) and A2780-CP) and a cisplatin-sensitive cell line (A2780). They demonstrated that changes in the secondary structure of proteins and a transition to high wavenumbers related to CH2 stretching vibrations were the spectral characteristics of cisplatin resistance. The data provided primary evidence and research direction for the potential identification of resistance to cisplatin in the clinic.
Besides ovarian cancer, the application of FTIR for evaluating the response to chemotherapy in other cancers, such as breast cancer, using tissue samples has been described by Depciuch et al.56 They observed that the infrared spectra of breast tissues after chemotherapy were similar to those of healthy breast tissues, indicating a good treatment effect. The chemotherapy was ineffective when the spectra of breast tissues after chemotherapy were similar to those of cancerous tissues, indicating a useful approach for the detection of chemotherapy efficacy.57 The same conclusion was seen in colorectal cancer.58
Further mechanisms underlying the chemotherapeutic drugs and DNA interaction can be studied using multiple experimental techniques, including FTIR spectroscopy. For example, after exposure to two cisplatin-like Pt/Pd-drugs, DNA was extracted from a human triple-negative breast cancer cell line and detected by ATR-FTIR. Batista et al found the main pharmacological targets and the DNA conformation changes after treatment with these drugs.59 This may provide new insights into the mechanism of the chemotherapy drugs.
FTIR Detection of Response to Other Drugs
As for monitoring the responses to other antitumor drugs in ovarian cancer, Al-Jorani et al60 used ATR-FTIR to detect the effects of organoamidoplatinum (ii) complexes on cellular metabolism in cisplatin-sensitive and cisplatin-resistant cell lines. Our previous work also used FTIR to monitor the dihydroartemisinin-induced growth inhibition effect in ovarian cancer cells and normal cells, showing an increase in the amount of lipids and nucleic acids in the growth inhibition cells (data unpublished).
Drug treatment can lead to molecular changes in tumor cells, resulting in the corresponding changes in molecular vibrations captured by FTIR. Gasparri et al61 monitored the cell apoptosis induced by camptothecin, a cytotoxic drug, in HL60 leukemia cells by ATR-FTIR and observed that the apoptotic maker was correlated with the absorption of nucleic acids (1200–900 cm−1). Plaimee et al62 investigated the apoptotic effects of melatonin in a human lung cancer cell line SK-LU-1 by FTIR spectroscopy and revealed an increase in lipids and a decrease in nucleic acid/DNA. The secondary structure of protein was also changed in content and in the position of peaks. Zelig et al22 used FTIR to distinguish and characterize the different modes of cell death, such as apoptosis and necrosis, after exposure to different drugs. Therefore, these studies demonstrate FTIR spectroscopy as a useful tool for studying drug responses.
FTIR Monitoring of Tumor Development
Besides capturing the responses to agents, spectral biomarkers can also monitor cancer progression in real time, including changes in the intensities and positions of the specific bands of proteins, lipids and nucleic acids during tumor metastasis.63 Although FTIR imaging has not been studied in monitoring ovarian cancer development to date, it has been used in other cancers that can be seen as a reference.
Yang et al64 established an in vitro 3D model exploring the mechanism of lung cancer cell metastasis. Cell invasion was detected by FTIR technique. The authors found that compared with the spectra of non-invading cells, the band position assigned to amide A, I and II of the spectra of the invading cells changed. The band 1080 cm−1 can be an indicator for the invading cells. Tian et al65 used FTIR spectroscopy for the identification of lymph node metastasis during surgery, and the sensitivity, specificity and accuracy were 94.7%, 90.1% and 91.3%, respectively. These studies provide new evidences for the evaluation of tumor metastasis, which might facilitate the stratification of patients and adjustment of treatment strategies in time.
Applications of FTIR Spectroscopy in Other Areas
In addition to ovarian cancer, IR spectroscopy has been widely implemented in other biomedical and biological areas (Table 2). Multiple studies have focused on cancer investigation, such as brain,66 lung,67 and prostate cancer,68 as well as non-cancerous diseases; for example, neurodegenerative disorders,69 nephropathy,70 malaria,71 and osteoarthritis.72 Microbiology is also a major field that uses this technology for detecting and classifying microbes73–75 and identifying microbial colony heterogeneity.76 This technique has also been applied in other fields, such as food safety77 and environmental pollution.78 Implementation in other fields is helpful to the further understanding and development of IR spectroscopy in the diagnosis and monitoring of ovarian cancer.
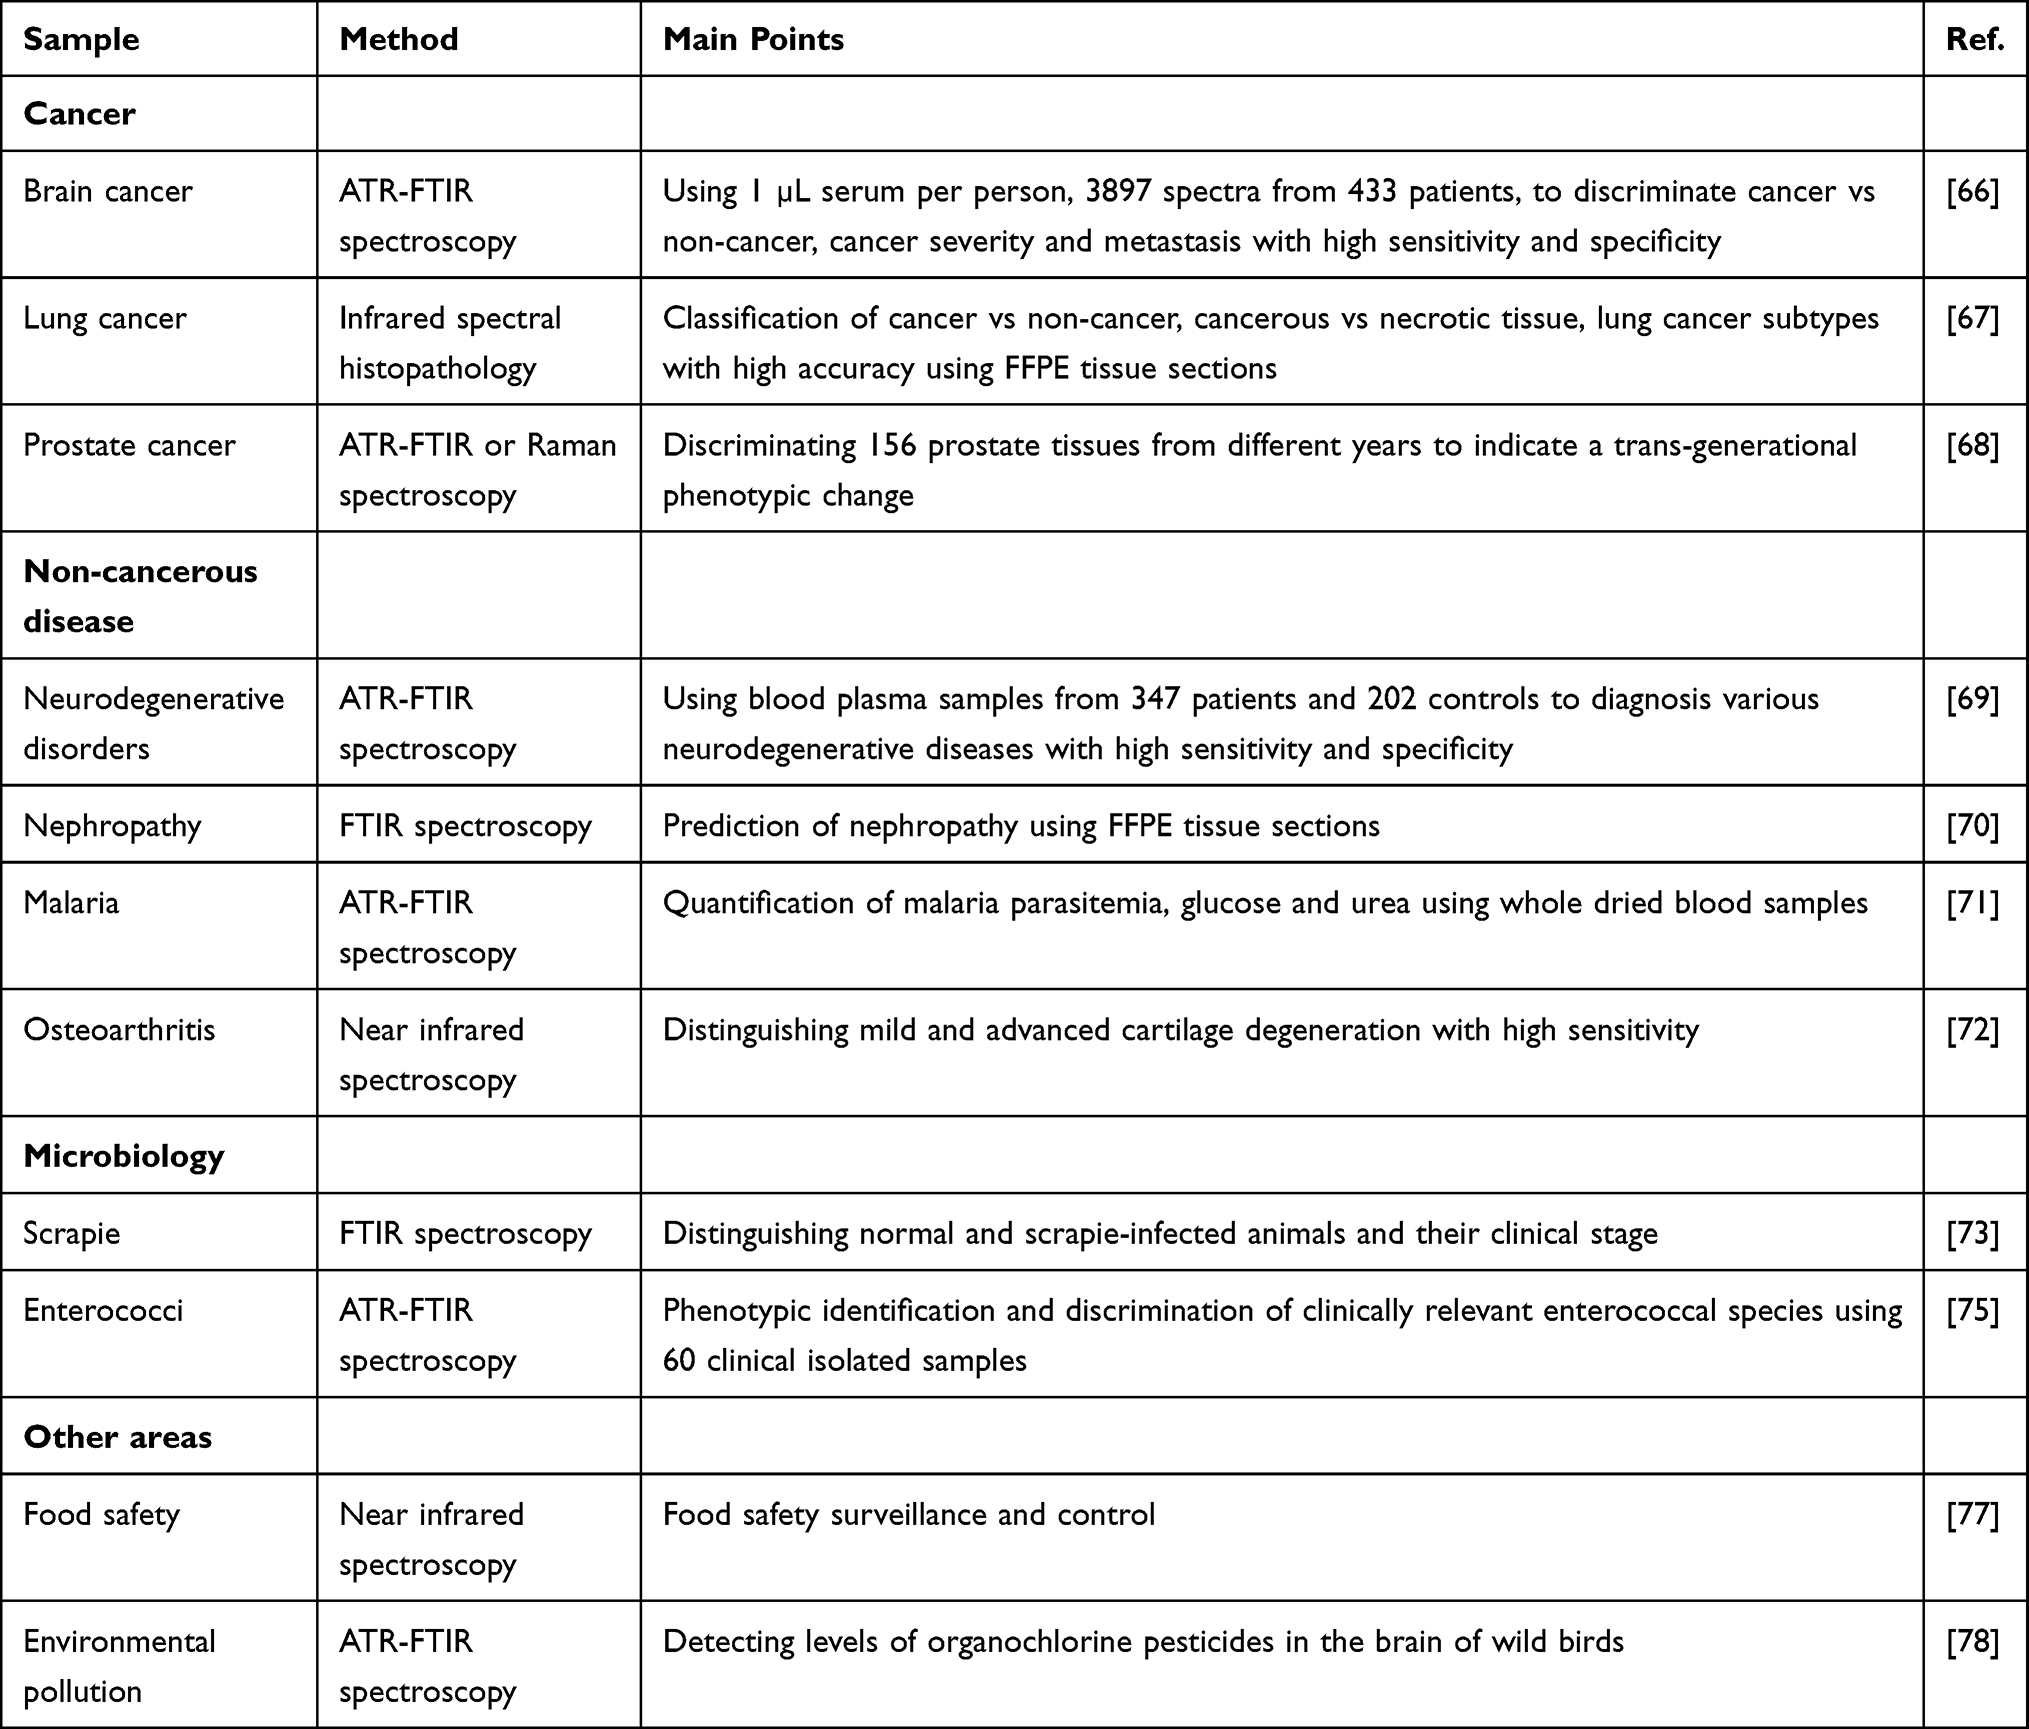 |
Table 2 Examples of Applications of FTIR Spectroscopy in Other Areas |
Future Challenges and Considerations
Standardization of Spectral Detection and Analysis in Cancer Diagnosis
As mentioned above, various biological samples, including tissues, cellular materials and biological fluids, can be spectral analyzed. Although still in the experimental stage, due to the sensitivity of spectral detections, it is also essential to have repeatability and reliability of the spectral data in large-scale studies or from different research groups, which will make the technology more convenient for clinical applications. For example, to reduce differences in personal operation, instruments, laboratories, and the environment (eg, temperature and humidity), it is not negligible to normalize the sample preparation procedure and develop a standardized spectrum analysis model.79
The preparation of these samples varies according to the type of samples. Fresh and snap-frozen tissues are preferred, as they have no contaminants. Formalin-fixed, paraffin-embedded (FFPE) treatment contributes to characteristic peaks and hinders biological information. FFPE samples need to be thoroughly deparaffinized before analyzing.80 As water can interfere and cover the biological information in the spectra, the internal instrument should be dried to lower the humidity, and samples should also be dried to avoid water interference.79 The biofluids can be centrifuged and the supernatant can be retained for further analysis if the cells in these fluids are not the focus of the research. Anticoagulant (EDTA, citrate or heparin) should also be taken into account, as it may form unexpected peaks.81,82 It is also worth noting that repeated freezing and thawing should be avoided, as well as long-term storage, since these may lead to confounding factors for the spectral analysis.83 Thus, stable samples and a consistent preparation are crucial for obtaining reliable results. Additionally, five or more spectra should be collected for each sample, and for heterogeneous samples, spectra should be collected to cover the whole sample as uniformly as possible. It is also recommended to collect three sample replicas.17,84 In addition to the investment of the instrument, spectral detection has the advantages of low cost and convenient preparation with a small sample amount.79
Before acquiring a high-quality spectrum, some of the instrument parameters, such as resolution, spectral range, aperture size, interferometer mirror velocity and co-additions should be adjusted to increase the signal-to-noise ratio.79 Each spectrum may be acquired within 2–5 min under the instrument. A background spectrum should be acquired before each sample to reflect atmospheric changes. The spectra are subjected to a primary system to undergo a standardization model in which all the spectra data are first preprocessed in the same steps, followed by exploratory analysis, outlier detection, classification techniques and data standardization; after these processes, the final model would be constructed.17,79 It may take a technician to perform the experimental procedures and an analytical chemist to construct the model. Thus, the spectra collected from different conditions can be standardized into a chemometric model using this computational-based analysis, making a practical spectral analysis model available for routine detection and clinical application in the future, especially in cancer diagnosis.
Application in Ovarian Cancer Diagnosis
Currently, few studies have screened ovarian cancer by FTIR spectral profile. Although there are some common insights in the above-mentioned studies, some results are conflicting; for example, regarding the differences in protein content between cancer tissues and normal tissues. Another limitation of the previous studies is the relatively small sample size. Therefore, more work needs to be done to support the diagnosis of ovarian cancer by FTIR spectroscopy.
- It is necessary to perform more comprehensive studies by FTIR spectroscopy in larger cohorts in order to establish a data bank of spectral features and summarize the accurate cancer markers for the possible discrimination of ovarian cancer.
- The data bank may include diversified samples: blood, urine and ascitic fluid samples; tissue samples from healthy and tumor tissues with heterogeneous subtypes of ovarian cancer and different developmental and treatment stages.85 Of course, standardized operating procedures should be followed.
- The notable spectral features include the band positions and intensities at 3000–2800 cm−1 (lipids), 1800–1700 cm−1 (phospholipids), 1700–1500 cm−1 (amide I and amide II groups in proteins) and 1200–900 cm−1 (nucleic acids)17 or their relative intensity ratios; the secondary structure of protein; and specific intensity ratios, such as the ratios of 2925/2958 (lipid saturation level), 3013/2958 (lipid unsaturation level)86 and 1454/1400. Our previous study demonstrated a higher 1454/1400 band intensity ratio in normal cells than in ovarian cancer cells.45 We also revealed a higher 1454/1400 ratio in cells exhibiting drug-induced growth inhibition,87 indicating that this ratio may be a spectral marker for detecting the effects of drugs or identifying cells with different growth characteristics. However, this conclusion needs further verification.
- An understanding of the combination of various diagnostic methods will be critical for the development of early detection and therapeutic interventions for ovarian cancer patients. For example, the employment of other/multiple techniques, such as conventional biochemical assays or 3D models for suspected changes in the biomolecules, could supplement the findings of the FTIR detection, leading to a more accurate diagnosis or real-time monitoring during treatment.
Other Applications of FTIR Spectroscopy
The advantage of FTIR imaging is its capability of capturing tiny differences in detailed cell signatures.84 FTIR can be used in a wide range of biomedical fields. In addition to monitoring cell growth and drug responses as mentioned above, subcellular differentiation and organelle localization can also be performed using spectral features; for example, in MCF-7 breast cancer cells.25 Further work using FTIR is required for multiple studies on the biomolecular changes of cancer cells in response to different drugs in different conditions and the biodistribution and discrimination of subcellular organelles.
Conclusion
Currently, FTIR imaging has specifically attracted substantial attention as a tool for cancer diagnosis and real-time monitoring of tumor development and therapy. In addition, new studies are expected, including those on cell growth and differentiation, subcellular processes, cell responses to drugs, and the assessment and identification of synthetic drugs. Overall, FTIR spectroscopy has great potential in ovarian cancer diagnosis and other clinical aspects of ovarian cancer in the future.
Abbreviations
FTIR, Fourier Transform Infrared; PARP, poly(ADP-ribose) polymerase; CA-125, serum Cancer Antigen 125; MRI, Magnetic Resonance Imaging; CT, Computed Tomography; BRCA1/BRCA2, breast cancer susceptibility gene 1/2; ATR-FTIR, attenuated total reflection Fourier-transform infrared; SR-FTIR, synchrotron radiation-based FTIR spectroscopy; HD, high definition; UHD, ultra-high definition; HPV, human papillomavirus; MET, metformin; FFPE, formalin-fixed, paraffin-embedded.
Data Sharing Statement
All data generated or analyzed during this study are included in this article.
Ethics Approval and Consent to Participate
Not applicable.
Consent for Publication
Not applicable.
Funding
This study was supported by the CAMS Innovation Fund for Medical Sciences (CIFMS-2017-I2M-1-002) and the National Natural Science Foundation of China (81502254).
Disclosure
The authors have no conflicts of interest.
References
1. Bray F, Ferlay J, Soerjomataram I, Siegel RL, Torre LA, Jemal A. Global cancer statistics 2018: GLOBOCAN estimates of incidence and mortality worldwide for 36 cancers in 185 countries. CA Cancer J Clin. 2018;68(6):394–424. doi:10.3322/caac.21492
2. Jayson GC, Kohn EC, Kitchener HC, Ledermann JA. Ovarian cancer. Lancet. 2014;384(9951):1376–1388.
3. Banas T, Pitynski K, Okon K, Czerw A. DNA fragmentation factors 40 and 45 (DFF40/DFF45) and B-cell lymphoma 2 (Bcl-2) protein are underexpressed in uterine leiomyosarcomas and may predict survival. Onco Targets Ther. 2017;10:4579–4589.
4. Ferlay J, Colombet M, Soerjomataram I, et al. Cancer incidence and mortality patterns in Europe: estimates for 40 countries and 25 major cancers in 2018. Eur J Cancer. 2018;103:356–387.
5. Ferlay J, Soerjomataram I, Dikshit R, et al. Cancer incidence and mortality worldwide: sources, methods and major patterns in GLOBOCAN 2012. Int J Cancer. 2015;136(5):E359–386.
6. Badgwell D, Bast RC
7. Su Z, Graybill WS, Zhu Y. Detection and monitoring of ovarian cancer. Clin Chim Acta. 2013;415:341–345.
8. English DP, Menderes G, Black J, Schwab CL, Santin AD. Molecular diagnosis and molecular profiling to detect treatment-resistant ovarian cancer. Expert Rev Mol Diagn. 2016;16(7):769–782.
9. Janzen DM, Tiourin E, Salehi JA, et al. An apoptosis-enhancing drug overcomes platinum resistance in a tumour-initiating subpopulation of ovarian cancer. Nat Commun. 2015;6:7956.
10. Vaughan S, Coward JI, Bast RC
11. Kuroki L, Guntupalli SR. Treatment of epithelial ovarian cancer. BMJ. 2020;371:m3773. doi:10.1136/bmj.m3773
12. Boussios S, Abson C, Moschetta M, et al. Poly (ADP-Ribose) polymerase inhibitors: talazoparib in ovarian cancer and beyond. Drugs R D. 2020;20(2):55–73.
13. Naumann D, Helm D, Labischinski H. Microbiological characterizations by FT-IR spectroscopy. Nature. 1991;351(6321):81–82.
14. Andrew Chan KL, Kazarian SG. Attenuated total reflection Fourier-transform infrared (ATR-FTIR) imaging of tissues and live cells. Chem Soc Rev. 2016;45(7):1850–1864.
15. Petibois C, Deleris G. Chemical mapping of tumor progression by FT-IR imaging: towards molecular histopathology. Trends Biotechnol. 2006;24(10):455–462.
16. Dorling KM, Baker MJ. Highlighting attenuated total reflection Fourier transform infrared spectroscopy for rapid serum analysis. Trends Biotechnol. 2013;31(6):327–328.
17. Baker MJ, Trevisan J, Bassan P, et al. Using Fourier transform IR spectroscopy to analyze biological materials. Nat Protoc. 2014;9(8):1771–1791.
18. Malins DC, Anderson KM, Gilman NK, Green VM, Barker EA, Hellstrom KE. Development of a cancer DNA phenotype prior to tumor formation. Proc Natl Acad Sci U S A. 2004;101(29):10721–10725.
19. Krishnan S, Whitwell HJ, Cuenco J, et al. Evidence of altered glycosylation of serum proteins prior to pancreatic cancer diagnosis. Int J Mol Sci. 2017;18:12.
20. Sahu R, Mordechai S. Fourier transform infrared spectroscopy in cancer detection. Future Oncol. 2005;1(5):635–647.
21. Glassford SE, Byrne B, Kazarian SG. Recent applications of ATR FTIR spectroscopy and imaging to proteins. Biochim Biophys Acta. 2013;1834(12):2849–2858.
22. Zelig U, Kapelushnik J, Moreh R, Mordechai S, Nathan I. Diagnosis of cell death by means of infrared spectroscopy. Biophys J. 2009;97(7):2107–2114.
23. Zhou J, Wang Z, Sun S, Liu M, Zhang H. A rapid method for detecting conformational changes during differentiation and apoptosis of HL60 cells by Fourier-transform infrared spectroscopy. Biotechnol Appl Biochem. 2001;33(Pt 2):127–132.
24. Sule-Suso J, Forsyth NR, Untereiner V, Sockalingum GD. Vibrational spectroscopy in stem cell characterisation: is there a niche? Trends Biotechnol. 2014;32(5):254–262.
25. Clede S, Policar C, Sandt C. Fourier transform infrared (FT-IR) spectromicroscopy to identify cell organelles: correlation with fluorescence staining in MCF-7 breast cancer cells. Appl Spectrosc. 2014;68(1):113–117.
26. Smith RA, Andrews KS, Brooks D, et al. Cancer screening in the United States, 2017: a review of current American Cancer Society guidelines and current issues in cancer screening. CA Cancer J Clin. 2017;67(2):100–121.
27. O’Rourke J, Mahon SM. A comprehensive look at the early detection of ovarian cancer. Clin J Oncol Nurs. 2003;7(1):41–47.
28. Horbach SER, Utami AM, Meijer-Jorna LB, et al. Discrepancy between the clinical and histopathologic diagnosis of soft tissue vascular malformations. J Am Acad Dermatol. 2017;77(5):920–929 e921.
29. Fritsche HA, Bast RC. CA 125 in ovarian cancer: advances and controversy. Clin Chem. 1998;44(7):1379–1380.
30. Ahmed AA, Abdou AM. Diagnostic accuracy of CA125 and HE4 in ovarian carcinoma patients and the effect of confounders on their serum levels. Curr Probl Cancer. 2019.
31. Togashi K. Ovarian cancer: the clinical role of US, CT, and MRI. Eur Radiol. 2003;13(Suppl 4):L87–104.
32. Boussios S, Mikropoulos C, Samartzis E, et al. Wise management of ovarian cancer: on the cutting edge. J Pers Med. 2020;10:2.
33. Kaznowska E, Depciuch J, Lach K, et al. The classification of lung cancers and their degree of malignancy by FTIR, PCA-LDA analysis, and a physics-based computational model. Talanta. 2018;186:337–345.
34. Elmi F, Movaghar AF, Elmi MM, Alinezhad H, Nikbakhsh N. Application of FT-IR spectroscopy on breast cancer serum analysis. Spectrochim Acta A Mol Biomol Spectrosc. 2017;187:87–91.
35. Li Q, Hao C, Kang X, et al. Colorectal cancer and colitis diagnosis using fourier transform infrared spectroscopy and an improved K-nearest-neighbour classifier. Sensors (Basel). 2017;17:12.
36. Rigas B, Morgello S, Goldman IS, Wong PT. Human colorectal cancers display abnormal Fourier-transform infrared spectra. Proc Natl Acad Sci U S A. 1990;87(20):8140–8144.
37. Purandare NC, Patel II, Trevisan J, et al. Biospectroscopy insights into the multi-stage process of cervical cancer development: probing for spectral biomarkers in cytology to distinguish grades. Analyst. 2013;138(14):3909–3916.
38. Li QB, Sun XJ, Xu YZ, et al. Diagnosis of gastric inflammation and malignancy in endoscopic biopsies based on Fourier transform infrared spectroscopy. Clin Chem. 2005;51(2):346–350.
39. Peng C, Chiappini F, Kascakova S, et al. Vibrational signatures to discriminate liver steatosis grades. Analyst. 2015;140(4):1107–1118.
40. Depciuch J, Stanek-Widera A, Lange D, et al. Spectroscopic analysis of normal and neoplastic (WI-FTC) thyroid tissue. Spectrochim Acta A Mol Biomol Spectrosc. 2018;204:18–24.
41. Krishna CM, Sockalingum GD, Bhat RA, et al. FTIR and Raman microspectroscopy of normal, benign, and malignant formalin-fixed ovarian tissues. Anal Bioanal Chem. 2007;387(5):1649–1656.
42. Mehrotra R, Tyagi G, Jangir DK, Dawar R, Gupta N. Analysis of ovarian tumor pathology by Fourier Transform Infrared Spectroscopy. J Ovarian Res. 2010;3:27.
43. Theophilou G, Lima KM, Martin-Hirsch PL, Stringfellow HF, Martin FL. ATR-FTIR spectroscopy coupled with chemometric analysis discriminates normal, borderline and malignant ovarian tissue: classifying subtypes of human cancer. Analyst. 2016;141(2):585–594.
44. Grzelak MM, Wrobel PM, Lankosz M, et al. Diagnosis of ovarian tumour tissues by SR-FTIR spectroscopy: a pilot study. Spectrochim Acta A Mol Biomol Spectrosc. 2018;203:48–55.
45. Li L, Bi X, Sun H, et al. Characterization of ovarian cancer cells and tissues by Fourier transform infrared spectroscopy. J Ovarian Res. 2018;11(1):64.
46. Gajjar K, Trevisan J, Owens G, et al. Fourier-transform infrared spectroscopy coupled with a classification machine for the analysis of blood plasma or serum: a novel diagnostic approach for ovarian cancer. Analyst. 2013;138(14):3917–3926.
47. Owens GL, Gajjar K, Trevisan J, et al. Vibrational biospectroscopy coupled with multivariate analysis extracts potentially diagnostic features in blood plasma/serum of ovarian cancer patients. J Biophotonics. 2014;7(3–4):200–209.
48. Lima KM, Gajjar KB, Martin-Hirsch PL, Martin FL. Segregation of ovarian cancer stage exploiting spectral biomarkers derived from blood plasma or serum analysis: ATR-FTIR spectroscopy coupled with variable selection methods. Biotechnol Prog. 2015;31(3):832–839.
49. Paraskevaidi M, Morais CLM, Lima KMG, et al. Potential of mid-infrared spectroscopy as a non-invasive diagnostic test in urine for endometrial or ovarian cancer. Analyst. 2018;143(13):3156–3163.
50. Hsu MM, Huang PY, Lee YC, Fang YC, Chan MW, Lee CI. FT-IR microspectrometry reveals the variation of membrane polarizability due to epigenomic effect on epithelial ovarian cancer. Int J Mol Sci. 2014;15(10):17963–17973.
51. Sindhuphak R, Issaravanich S, Udomprasertgul V, et al. A new approach for the detection of cervical cancer in Thai women. Gynecol Oncol. 2003;90(1):10–14.
52. Augustyniak K, Chrabaszcz K, Jasztal A, et al. High and ultra-high definition of infrared spectral histopathology gives an insight into chemical environment of lung metastases in breast cancer. J Biophotonics. 2019;12(4):e201800345.
53. Smolina M, Goormaghtigh E. Gene expression data and FTIR spectra provide a similar phenotypic description of breast cancer cell lines in 2D and 3D cultures. Analyst. 2018;143(11):2520–2530.
54. Rymsza T, Ribeiro EA, de Carvalho L, Bhattacharjee T, de Azevedo Canevari R. Human papillomavirus detection using PCR and ATR-FTIR for cervical cancer screening. Spectrochim Acta A Mol Biomol Spectrosc. 2018;196:238–246.
55. Zendehdel R, Masoudi-Nejad A, Mohammadzadeh J, Cisplatin Resistant FHS. Patterns in ovarian cell line using FTIR and principle component analysis. Iranian j Pharm Res. 2012;11(1):235–240.
56. Depciuch J, Kaznowska E, Zawlik I, et al. Application of Raman spectroscopy and infrared spectroscopy in the identification of breast cancer. Appl Spectrosc. 2016;70(2):251–263.
57. Depciuch J, Kaznowska E, Golowski S, et al. Monitoring breast cancer treatment using a Fourier transform infrared spectroscopy-based computational model. J Pharm Biomed Anal. 2017;143:261–268.
58. Depciuch J, Kaznowska E, Koziorowska A, Cebulski J. Verification of the effectiveness of the Fourier transform infrared spectroscopy computational model for colorectal cancer. J Pharm Biomed Anal. 2017;145:611–615.
59. Batista de Carvalho ALM, Mamede AP, Dopplapudi A, et al. Anticancer drug impact on DNA - a study by neutron spectroscopy coupled with synchrotron-based FTIR and EXAFS. Phys Chem Chem Phys. 2019;21(8):4162–4175.
60. Al-Jorani K, Ruther A, Haputhanthri R, et al. ATR-FTIR spectroscopy shows changes in ovarian cancer cells after incubation with novel organoamidoplatinum(ii) complexes. Analyst. 2018;143(24):6087–6094.
61. Gasparri F, Muzio M. Monitoring of apoptosis of HL60 cells by Fourier-transform infrared spectroscopy. Biochem J. 2003;369(Pt 2):239–248.
62. Plaimee P, Weerapreeyakul N, Thumanu K, Tanthanuch W, Barusrux S. Melatonin induces apoptosis through biomolecular changes, in SK-LU-1 human lung adenocarcinoma cells. Cell Prolif. 2014;47(6):564–577.
63. Kar S, Katti DR, Katti KS. Fourier transform infrared spectroscopy based spectral biomarkers of metastasized breast cancer progression. Spectrochim Acta A Mol Biomol Spectrosc. 2019;208:85–96.
64. Yang Y, Sule-Suso J, Sockalingum GD, Kegelaer G, Manfait M, El Haj AJ. Study of tumor cell invasion by Fourier transform infrared microspectroscopy. Biopolymers. 2005;78(6):311–317.
65. Tian P, Zhang W, Zhao H, et al. Intraoperative detection of sentinel lymph node metastases in breast carcinoma by Fourier transform infrared spectroscopy. Br J Surg. 2015;102(11):1372–1379.
66. Hands JR, Clemens G, Stables R, et al. Brain tumour differentiation: rapid stratified serum diagnostics via attenuated total reflection Fourier-transform infrared spectroscopy. J Neurooncol. 2016;127(3):463–472.
67. Akalin A, Mu X, Kon MA, et al. Classification of malignant and benign tumors of the lung by infrared spectral histopathology (SHP). Lab Invest. 2015;95(4):406–421.
68. Theophilou G, Lima KM, Briggs M, Martin-Hirsch PL, Stringfellow HF, Martin FL. Corrigendum: a biospectroscopic analysis of human prostate tissue obtained from different time periods points to a trans-generational alteration in spectral phenotype. Sci Rep. 2015;5:14886.
69. Paraskevaidi M, Morais CLM, Lima KMG, et al. Differential diagnosis of Alzheimer’s disease using spectrochemical analysis of blood. Proc Natl Acad Sci U S A. 2017;114(38):E7929–E7938.
70. Varma VK, Kajdacsy-Balla A, Akkina SK, Setty S, Walsh MJ. A label-free approach by infrared spectroscopic imaging for interrogating the biochemistry of diabetic nephropathy progression. Kidney Int. 2016;89(5):1153–1159.
71. Roy S, Perez-Guaita D, Andrew DW, et al. Simultaneous ATR-FTIR based determination of malaria parasitemia, glucose and urea in whole blood dried onto a glass slide. Anal Chem. 2017;89(10):5238–5245.
72. Afara IO, Prasadam I, Arabshahi Z, Xiao Y, Oloyede A. Monitoring osteoarthritis progression using near infrared (NIR) spectroscopy. Sci Rep. 2017;7(1):11463.
73. Carmona P, Monzon M, Monleon E, Badiola JJ, Monreal J. In vivo detection of scrapie cases from blood by infrared spectroscopy. J Gen Virol. 2005;86(Pt 12):3425–3431.
74. Maquelin K, Kirschner C, Choo-Smith LP, et al. Identification of medically relevant microorganisms by vibrational spectroscopy. J Microbiol Methods. 2002;51(3):255–271.
75. Nitrosetein T, Wongwattanakul M, Chonanant C, et al. Attenuated Total Reflection Fourier Transform Infrared Spectroscopy combined with chemometric modelling for the classification of clinically relevant Enterococci. J Appl Microbiol. 2020.
76. Choo-Smith LP, Maquelin K, van Vreeswijk T, et al. Investigating microbial (micro)colony heterogeneity by vibrational spectroscopy. Appl Environ Microbiol. 2001;67(4):1461–1469.
77. Qu JH, Liu D, Cheng JH, et al. Applications of near-infrared spectroscopy in food safety evaluation and control: a review of recent research advances. Crit Rev Food Sci Nutr. 2015;55(13):1939–1954.
78. Heys KA, Shore RF, Pereira MG, Martin FL. Levels of organochlorine pesticides are associated with amyloid aggregation in apex avian brains. Environ Sci Technol. 2017;51(15):8672–8681.
79. Morais CLM, Paraskevaidi M, Cui L, et al. Standardization of complex biologically derived spectrochemical datasets. Nat Protoc. 2019;14(5):1546–1577.
80. Byrne HJ, Knief P, Keating ME, Bonnier F. Spectral pre and post processing for infrared and Raman spectroscopy of biological tissues and cells. Chem Soc Rev. 2016;45(7):1865–1878.
81. Lovergne L, Bouzy P, Untereiner V, et al. Biofluid infrared spectro-diagnostics: pre-analytical considerations for clinical applications. Faraday Discuss. 2016;187:521–537.
82. Martin M, Perez-Guaita D, Andrew DW, Richards JS, Wood BR, Heraud P. The effect of common anticoagulants in detection and quantification of malaria parasitemia in human red blood cells by ATR-FTIR spectroscopy. Analyst. 2017;142(8):1192–1199.
83. Mitchell BL, Yasui Y, Li CI, Fitzpatrick AL, Lampe PD. Impact of freeze-thaw cycles and storage time on plasma samples used in mass spectrometry based biomarker discovery projects. Cancer Inform. 2005;1:98–104.
84. Martin FL, Kelly JG, Llabjani V, et al. Distinguishing cell types or populations based on the computational analysis of their infrared spectra. Nat Protoc. 2010;5(11):1748–1760.
85. Petibois C, Gionnet K, Goncalves M, Perromat A, Moenner M, Deleris G. Analytical performances of FT-IR spectrometry and imaging for concentration measurements within biological fluids, cells, and tissues. Analyst. 2006;131(5):640–647.
86. Gioacchini G, Giorgini E, Vaccari L, et al. A new approach to evaluate aging effects on human oocytes: fourier transform infrared imaging spectroscopy study. Fertil Steril. 2014;101(1):120–127.
87. Li L, Wu J, Weng S, et al. Fourier transform infrared spectroscopy monitoring of dihydroartemisinin-induced growth inhibition in ovarian cancer cells and normal ovarian surface epithelial cells. Cancer Manag Res. 2020;12:653–661.
 © 2021 The Author(s). This work is published and licensed by Dove Medical Press Limited. The
full terms of this license are available at https://www.dovepress.com/terms
and incorporate the Creative Commons Attribution
- Non Commercial (unported, 3.0) License.
By accessing the work you hereby accept the Terms. Non-commercial uses of the work are permitted
without any further permission from Dove Medical Press Limited, provided the work is properly
attributed. For permission for commercial use of this work, please see paragraphs 4.2 and 5 of our Terms.
© 2021 The Author(s). This work is published and licensed by Dove Medical Press Limited. The
full terms of this license are available at https://www.dovepress.com/terms
and incorporate the Creative Commons Attribution
- Non Commercial (unported, 3.0) License.
By accessing the work you hereby accept the Terms. Non-commercial uses of the work are permitted
without any further permission from Dove Medical Press Limited, provided the work is properly
attributed. For permission for commercial use of this work, please see paragraphs 4.2 and 5 of our Terms.