Back to Journals » International Journal of Nanomedicine » Volume 21
Foslip-Mediated Photodynamic Treatment Reprograms Macrophages Phenotype in Tri-Culture Head and Neck Cancer Spheroids
Authors Francois A, Dirheimer L, Mastronicola R, Dolivet G, Bezdetnaya L
Received 11 September 2025
Accepted for publication 12 February 2026
Published 18 March 2026 Volume 2026:21 562422
DOI https://doi.org/10.2147/IJN.S562422
Checked for plagiarism Yes
Review by Single anonymous peer review
Peer reviewer comments 3
Editor who approved publication: Prof. Dr. RDK Misra
Aurélie Francois,1,2 Luca Dirheimer,1 Romina Mastronicola,2,3 Gilles Dolivet,2,3 Lina Bezdetnaya1,2
1Research Department, Institut de Cancérologie de Lorraine, Vandœuvre-lès-Nancy, France; 2Department of Biology, Signals and Systems in Cancer and Neuroscience, CRAN, UMR7039, Université de Lorraine, CNRS, Vandœuvre-lès-Nancy, 54500, France; 3Surgical Department, Institut de Cancérologie de Lorraine, Vandœuvre-lès-Nancy, France
Correspondence: Lina Bezdetnaya, Research Department, Institut de Cancérologie de Lorraine, Vandoeuvre-lès-Nancy, France, Tel +33-03-8359-8353, Email [email protected]
Background: The tumor microenvironment (TME) composition is among the critical events leading to the poor prognosis of head and neck cancers. TME includes immune cells, tumor-associated macrophages (TAMs), cancer-associated fibroblasts (CAF), and other non-cancerous cells, which contribute to therapeutic outcome. The heterogeneity of the TME offers a multitude of potential targets for photodynamic therapy (PDT). Advanced 3D models that closely mimic the microenvironment are a promising tool to study tumor-stroma interactions, TAM plasticity and their impact on Foslip®-PDT outcome.
Objective: The aim of this study was to assess the effect of Foslip-PDT on photo-induced macrophage re-education in 3D tri-culture model composed of cancer cells, CAFs, and macrophages.
Methods: A 3D model was established using FaDu cancer cells, MeWo fibroblasts, and PMA-differentiated U937 macrophages. The spheroids were characterized using immunochemistry, immunofluorescence, and qPCR. Foslip-based photoirradiation was applied to spheroids at different fluences to evaluate the photoinduced cell death. Macrophage phenotypes were assessed by flow cytometry.
Results: The 3D tri-culture model displayed hallmarks of stromal–tumor interactions, including CAF clustering, macrophage infiltration (~30– 40%), and epithelial–mesenchymal transition. Macrophages in the spheroids had prevailing M2 phenotype as deduced from overexpression of immunosuppressive markers (CD163, PDL-1, IL-10). The liposomal photosensitizer Foslip accumulated 2 to 3 times more in macrophage-enriched spheroids, however, PDT induced similar levels of cell death in all tested models. At the same time, Foslip-PDT produced immunomodulatory effect in tri-culture model characterized by the increase of CD80-M1 marker expression and the decrease in the expression of the CD206-M2 marker.
Conclusion: The 3D tri-culture model integrated essential features of the HNSCC microenvironment. Foslip-PDT was effective in reprograming M2 macrophages to tumor-killing M1 macrophages. This study opens the way to combine direct tumor damage with TME modulation.
Keywords: head and neck cancer, spheroids, cancer-associated fibroblasts, photodynamic therapy, Foslip, M1/M2 macrophages
Introduction
Head and neck cancer (HNC) is the seventh most common cancer worldwide.1,2 Head and neck squamous cell carcinoma (HNSCC) is the most prevalent form of HNC, accounting for 90% of all HNC cases. HNSCC primarily originates from the squamous epithelial cells of the pharynx, oral cavity, and larynx. Despite advances in the treatment and understanding of disease biology, HNSCC remains an aggressive malignancy and the five-year survival rate has not improved significantly in the past years (ca. 60%).3–5 The incidence of this disease is estimated to increase by 30% by 20306 thus emphasizing the urgent need for efforts to adjust therapeutic strategies. Among the events leading to the poor prognosis of head and neck cancers, the tumor microenvironment (TME) composition is a critical one. Considering these challenges, the interaction between cellular (cancerous and non-cancerous cells) and non-cellular components in the TME serves as a determinant of therapeutic outcome. The heterogeneous non-cancerous cells can represent up to 90% of the tumor mass3 and include immune cells, endothelial cells, stem cells and cancer associated fibroblasts (CAF), among others. Tumor-associated macrophages (TAM) are the principal tumor-infiltrating innate immune cells.7 In response to certain stimulus TAMs can be polarized to either protumorigenic M2-like or tumoricidal M1-like cell.7 HNSCC are highly infiltrated with M2-TAMs, associated with poor overall survival.8 It has been accepted that macrophages possess a huge plasticity and diversity, thus targeting TAM in order to convert M2-like to tumoricidal M1-like macrophages is challenging and of great significance.8,9
Photodynamic therapy (PDT), widely explored and reported as a theranostic intervention,9 has been approved for the treatment of some cancers and precancerous lesions through the light activation of a photosensitizer (PS) with successive production of toxic reactive oxygen species.10,11 Successful clinical trials led to the approval of temoporfin (or 5,10,15,20-tetrakis(meta-hydroxyphenyl)chlorine mTHPC) for the palliative treatment of head and neck cancers in 2001. Later, nanocarrier strategies offered multiple benefits to PDT, particularly by overcoming the hydrophobicity of free PS, thus improving its bioavailability and tumor selectivity. A liposomal formulation of mTHPC (Foslip®) has proven its efficiency by facilitating tumor accumulation and decreasing dark toxicity, while maintaining high photodynamic efficiency.12
As stated in recent studies, the heterogeneity and complexity of the TME offer a multitude of potential targets for photodynamic nanomedicines, emphasizing the need to identify and target both cancer cells and supporting cells.10,13 Consequently, preclinical models that closely mimic the HNSCC microenvironment are of utmost importance. 3D model over 2D demonstrate numerous advantages being a promising tool to study tumor-stroma interactions, TAM plasticity and their impact on therapeutic issue in cancers.14
In previous studies, we optimized the co-culture of 3D spheroids composed of tumor cells and stroma cells (CAF or macrophages).15–17 These models served to evaluate nanoparticle accumulation and penetration and to reveal how the stroma affects the response to PDT. In particular, recently we showed the potential of co-culture HNSCC 3D model composed of FaDu cancer cells and infiltrated macrophages to recapitulate the interactions between immune cells and cancer cells.15 In this study Foslip photoinduced cell death was not influenced by the subtypes of macrophages (M0, M1, M2). Fibroblasts and macrophages are the key players in the head and neck cancer microenvironment. Thus, in line with this research, we created and characterized an in vitro 3D head and neck tumor tri-culture model in order to simulate interaction between tumor cells, infiltrated immune cells and CAFs. We further assessed the effect of Foslip-PDT on macrophage re-education in a fabricated 3D tri-culture model to determine whether the TME enriched in fibroblasts would affect the PDT response compared to simpler HNSCC cancer models.
Materials and Methods
Cell Lines
The human pharyngeal squamous carcinoma cell line FaDu (Cat. No: ATCC1 HTB-43™), and the human monocyte cell line U937 (Cat. No: ATCC CRL-1593.2) derived from histiocytic lymphoma were cultured in phenol red-free Roswell Park Memorial Institute 1640 medium (RPMI-1640, Invitrogen, Carlsbad, California, USA) supplemented with 10% (v/v) heat-inactivated fetal bovine serum (FBS, Sigma-Aldrich, Saint-Quentin Fallavier, France) and 1% (vol/vol) 0.2 M glutamine (Invitrogen, Carlsbad, California, USA). MeWo cells (Cat No: ATCC HTB-65TM), granular fibroblasts, derived from human melanoma, were used as CAFs.17 MeWo cells were cultured in Minimal Essential Medium (MEM, Sigma-Aldrich, Saint-Quentin Fallavier, France) supplemented with 9% (vol/vol) of FBS and 1% (vol/vol) 0.1 M sodium pyruvate (Sigma-Aldrich, Saint-Quentin Fallavier, France). The cells were maintained in a humidified incubator at 37 °C with 5% CO2 and reseeded either weekly (FaDu and MeWo cells) or twice per week (U937 cells) to ensure exponential growth.
In vitro Differentiation of Macrophages from Monocytes
The U937 cells, differentiated with phorbol myristate acetate (PMA), is commonly used as a simplified in vitro model of macrophage-like cells (M0 macrophages).15,18,19 U937 monocytes, plated at a concentration of 2×10⁵ cells / mL, were differentiated into M0 macrophages after 48h of incubation in complete RPMI medium in the presence of 100 ng/mL phorbol myristate acetate (PMA) (Sigma-Aldrich, Saint-Quentin Fallavier, France).15 At the end of incubation, PMA-differentiated macrophages were rinsed with phosphate buffered saline solution (PBS), and harvested using Accutase Cell Dissociation Solution (GIBCO, ThermoFisher, Waltham, MA, USA) for 15 min at 37 °C for further spheroid generation.
Formation of Three-Dimensional Tumor Spheroids
Multicellular tumor spheroids were generated using the liquid overlay technique, as described previously.17 Briefly, 100 µL of FaDu cells (5 × 10⁴ cells/mL) and 100 µL of complete RPMI medium were added to each agarose-precoated (1% w/v in water) well of 96-well plates (200 µL/well). Homotypic and heterotypic spheroids were fabricated as follows: (1) monoculture composed of 5000 FaDu cells (F5), which served as the control, and (2) co-culture composed of a mixture of MeWo and FaDu cancer cells in a 1:1 ratio (F5Mw5). To establish the infiltration models, a suspension of M0 differentiated macrophages at two concentrations (5×10⁴ cells/mL and 10×104 cells/mL) was added to the F5 and F5Mw5 spheroids 24 h after spheroid formation. The resulting spheroids with infiltrated macrophages were termed F5+M5 and F5+M10, and the tri-culture infiltrated models were termed F5Mw5+M5 and F5Mw5+M10, respectively (Figure 1). Brightfield images were captured daily using an inverted Olympus CK2 microscope (Olympus, Rungis, France) coupled with a camera to assess spheroid growth evolution.
 |
Figure 1 Schematic representation of 3D spheroids generation. Abbreviations: M0, macrophage M0; PMA, Phorbol myristate acetate; CAF, cancer-associated fibroblast. |
Composition of Spheroids
The composition of co- and tri-culture-infiltrated spheroids was studied by flow cytometry, using the fluorescence of membrane-bound dyes to distinguish each cell type. On the day of seeding, the cell types were pre-stained with fluorescent dyes for general cell membrane labeling. The green Fluorescent Cell Linker PKH67, Red Fluorescent Cell Linker PKH26 or CellVue® Claret Far Red Fluorescent Cell Linker (Sigma-Aldrich, Saint-Quentin Fallavier, France) were used according to the manufacturer’s instructions, as previously described.15,17,20 Briefly, with a suspension of 107 cells washed with serum-free medium. The cell pellet was gently mixed with 4 µM of fluorescent dye for 10 min in the dark. The reaction was stopped by the addition of serum for 2 min, washed twice in complete medium, and seeded onto agarose precoated plates. Spheroid cultures were maintained at 37 °C (5% CO2). On day 5 of culture, eight spheroids were dissociated as previously described15 (25 min agitation with 0.025% trypsin and 0.01% EDTA (GIBCO, ThermoFisher, Waltham, MA, USA)). Dissociation was completed by vigorous pipetting before centrifugation at 400 g for 5 min. Cell suspensions were analyzed by flow cytometry (BD Accuri C6 Plus, BD Biosciences, Erembodegem, Belgium). The fluorescence signals of PKH67-, PKH26-, and claret-labelled cells were detected in the fluorescence channels using a 533 ± 30 nm filter (λexc = 488 nm), 585 ± 42 nm filter (λexc = 488 nm), and 661 ± 16 nm filter (λexc = 633 nm). The distribution of cells into spheroids was studied using 10 µm thick frozen spheroids sections. Eight spheroids from at least four different experiments were sectioned at different depths. Frozen sections were analyzed to determine the center of each spheroid, which was defined by its maximum diameter. The fluorescence of the pre-stained cells was then observed using an epifluorescence microscope (Olympus AX-70, Olympus, France) equipped with a CoolLED pe-4000 system (CoolLed, UK). Fluorescence signals from PKH67, PKH26, and the Cell Vue Claret were registered using 510–550 nm filter (λexc = 460 nm), 560–600 nm filter (λexc = 550 nm) and 652–682 nm filter (λexc = 635 nm) filters, respectively. Fluorescent images of spheroids with distinct cell populations were analyzed using ImageJ software. The fluorescence signals from each population were separated by the corresponding channel, thresholded, and quantified using pixel area. The relative proportion of macrophages was calculated as the percentage of the total fluorescent area.
Immunochemistry and Immunofluorescence
For immunohistochemistry and immunofluorescence analysis, 10 µm thick frozen sections of spheroids, embedded in tissue freezing medium (TFM, Microm Microtech, France), were fixed in 96% ethanol or in 4% paraformaldehyde for 10 min at room temperature. Immunological staining for Ki-67, E-Cadherin, and Vimentin was performed on a BechmarkUltra IHC automated Roche (Roche Diagnostics, Rotkreuz, Switzerland) using monoclonal mouse anti-human Ki67 antigen clone Mib1 (1:50 dilution), mouse anti-human anti-E-cadherin clone NCH-38 (1:100 dilution), and mouse anti-human vimentin Clone V9 (1:200 dilution) respectively (Dako, Santa Clara, CA, USA). The macrophage population was identified with the CD68 marker using the Dako Omnis IHC automate (Dako Agilent, Santa Clara, CA, US) with mouse anti-human CD68 (clone PG-M1, Dako Omnis Santa Clara, CA, US). For immunofluorescence staining, frozen sections of spheroids were incubated with a blocking solution for 1 h (3% bovine serum albumin in PBS), followed by overnight incubation at 4 °C with rabbit polyclonal anti-fibronectin (Abcam, 1:100 dilution) antibody. The next day, sections of spheroids were incubated with secondary goat anti-rabbit antibody Atto 550 (Sigma, 1:400 dilution) for 1 h. The nuclei were counterstained with DAPI dye mounting medium (Vectashield with DAPI, Vector Laboratories, USA). Cryosections were observed under an epifluorescence microscope (Olympus AX-70, Olympus, France) equipped with a CoolLED pe-4000 system (CoolLed, UK). DAPI fluorescence was detected using a 420–460 nm filter (λexc = 365 nm), and the signal from Atto550 conjugated antibody was registered with a 560–600 nm filter (λexc = 550 nm).
Relative Gene Expression Using Reverse-Transcription PCR
Spheroids were harvested on days 3 and 5 post-seeding, pooled, and centrifuged for 5 min at 1500 rpm. They were then digested with PBS half-diluted trypsin solution (0.025% trypsin and 0.01% ethylenediaminetetraacetic acid (GIBCO, ThermoFisher, Waltham, MA, USA) for 25 min at 37 °C under agitation. RNA was extracted from the cell pellets using an RNeasy Mini Kit (Qiagen, Hilden, Germany) according to the manufacturer’s instructions. The isolated RNAs was quantified using the Invitrogen Qubit RNA HS Assay Kit (ThermoFisher Scientific, Inc. Waltham, MA, USA). cDNA was obtained from 1 µg of RNA using the iScript cDNA Synthesis Kit (Bio-Rad, Hercules, CA, USA). Primer sequences were purchased from Eurogentec (Seraing, Belgium), and are listed in Supplementary Table 1. Quantitative PCR was performed on a LightCycler® 480 (Roche, Basel, Switzerland) using SYBR green qPCR master mix from CliniSciences (Nanterre, France) and human β-actin as the standard reference gene. Relative gene expression was further normalized to that of FaDu spheroids (F5) on day 3 using the standard 2−ddCt method.
Foslip Incubation
Foslip, a liposomal mTHPC (Temoporfin) formulation, was kindly provided by biolitec research GmbH (Jena, Germany). The 1.5 mM stock solution of Foslip was prepared in water for injection and kept at 4 °C in the dark. On the 4th day of spheroid formation, 100 µL of medium was replaced with 100 µL of double-concentrated Foslip solution to achieve a final mTHPC concentration of 4.5 µM. After 24 h of incubation with Foslip, the spheroids were rinsed with serum-free RPMI medium and subjected to further experiments.
Foslip Accumulation in 3D Spheroids
Foslip accumulation in spheroids was evaluated using flow cytometry to measure mTHPC fluorescence. The spheroids were dissociated, as described above, for 25 min under agitation with half-diluted trypsin. mTHPC fluorescence was registered with a 675 ± 25 nm (λexc = 633 nm) filter, while accumulation of Foslip in the different cellular types was evaluated using the fluorescence of membrane dyes corresponding to each type of cells, as described above, in the “Composition of spheroids” section. Foslip accumulation in 3D spheroids was assessed by mean fluorescence intensity (MFI) values, derived from Flow Cytometry data analysis. Foslip fluorescence was recorded in frozen sections using an epifluorescence microscope (Olympus AX-70) with a high-pass 590 nm filter (λexc = 405 nm). Image analysis was performed using ImageJ software (NIH, USA).
Photo-Induced Cell Death
The spheroids were treated with Foslip for 24 h at 37 °C and then irradiated with a Ceralas PDT diode laser at 652 nm (CeramOptec GmbH, Bonn, Germany). The spheroids were irradiated at 10, 20, and 40 J/cm2 at a fluence rate of 30 mW/cm2. The control conditions “No Light, No Drug” and “Drug only, no light” were performed in parallel. Photo-induced toxicity in dissociated spheroids was assessed by flow cytometry at 24 h post-treatment. Necrotic cells were quantified using propidium iodide (PI) staining (1 µg/mL, BioLegend, San Diego, CA, USA) after 15 min of incubation at room temperature. PI fluorescence was detected using flow cytometry in a channel equipped with a 585 ± 40 nm filter (λexc = 488 nm).
Photo-Induced Modification of Macrophage Phenotype
Control and PDT-treated spheroids were collected 24 h after treatment and dissociated into single cell suspensions. The phenotype of infiltrated immune cells in co- and tri-culture spheroids was analyzed by immunofluorescence staining of surface protein expression as described previously.15 Non-specific Fc Receptor was blocked using a BD Pharmingen Human BD Fc Block (Cat#564220, BD Biosciences; Le Pont de Claix, France) for 10 min at room temperature. The cells were then incubated with the respective antibodies in PBS supplemented with 2% FBS for 45 min. M1 and M2 staining were performed using purified mouse anti-human CD80 (clone L307.4; Cat#557223) and CD206 (clone 19.2; Cat#555953), respectively (BD Biosciences; Le Pont de Claix, France). After washing, the cells were incubated with a secondary goat anti-mouse FITC-conjugated antibody (Sigma-Aldrich) and analyzed by flow cytometry. Data are presented as relative protein expression compared to the respective controls: F5 or F5Mw5 spheroids without irradiation.
Statistical Analysis
The data are representative of at least three independent experiments, and the values are expressed as mean ± standard error of the mean (SEM). Data analysis was performed using the Origin software (OriginLab, Northampton, MA, USA). Statistical analyses, such as unpaired parametric two-tailed t-tests and one-way ANOVA with Tukey’s multiple comparison tests, were applied to determine the statistical significance between the datasets with a significance level of p ≤ 0.05. For qPCR analysis, the statistical significance of gene expression in stroma-enriched spheroids was calculated by comparing them with F5 spheroids or between spheroids in co-culture or tri-culture.
Results
Generation of Macrophage-Enriched Spheroids
Spheroids were generated from FaDu or FaDu / MeWo cells using liquid overlay technique as described previously.15,17,20 We consider MeWo fibroblasts as CAF due to previous paper, where we demonstrated the expression of the characteristic protein of CAF, alpha-SMA and overexpression of fibronectin. The latter increased as the number of MeWo cells increased.17 24h post-culturing, cell suspension of macrophages at two concentrations (5*104 cells/mL “M5” and 10*104 cells/mL “M10”) was added into the wells to study their infiltration into spheroids. In our previous studies related to mTHPC-PDT18 and Foslip-PDT15,19 we have already used PMA- differentiated U937 as a model of M0 macrophages. In these studies we established changes in morphology, adherence properties and functional activity.
In F5 mono-spheroids, we observed a significant increase (p < 0.001) in the diameter of spheroids after the addition of macrophages, irrespective of the experimental conditions (macrophage concentration and day of culturing). At the same time, co-culturing F5Mw5 spheroids with macrophages did not change the size of spheroids, irrespective of the macrophage concentration (Supplementary Figure 1).
The kinetics of macrophage infiltration were evaluated using flow cytometry (Figure 2). Cells were stained with the corresponding membrane dyes to distinguish between each cell type in the co-culture and tri-culture spheroids. Macrophage infiltration was the highest on the 3rd day of growth (except for F5Mw5+M10) and then declined (Figure 2). It has been reported that up to 30% of head and neck cancers are infiltrated by macrophages.21–24 Based on these literature data along with the kinetics of macrophage infiltration, we fixed two conditions for further experiments: day 5th of culturing and macrophage concentration as M10.
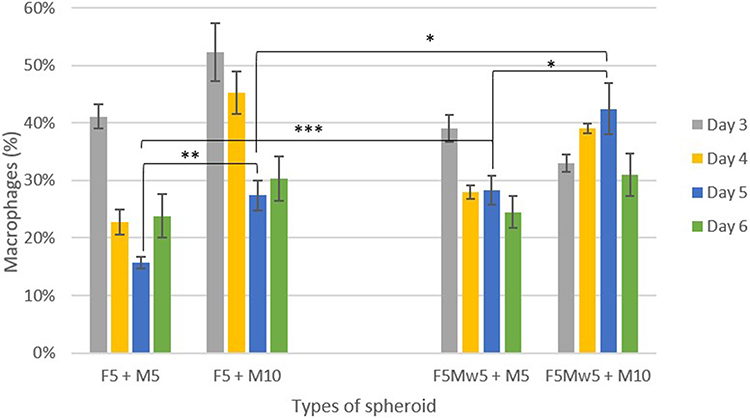 |
Figure 2 Kinetics of macrophages infiltration in spheroids assessed by flow cytometry. Macrophages were pre-stained with the membrane fluorescent dye PKH-67. Data are presented as the mean ± SEM (n = 7). Statistical significance is marked with asterisks (*) *p ≤ 0.05, **p ≤ 0.01, and ***p ≤ 0.001. |
Optical imaging conducted five days post-seeding on macrophage-enriched F5 spheroids (F5+M10) demonstrated the formation of tight round spheres with an even surface (Figure 3A). Typical fluorescent images of the central section of the spheroids revealed the presence of macrophages across the spheroids (Figure 3A, pink). This observation was confirmed by immunohistochemical staining for the pan-macrophage marker CD68 (data not shown). The sphere-shaped tri-culture of F5Mw5+M10 spheroids appeared rather dense, with fibroblast clusters (Figure 3A). The distribution pattern of macrophages in the tri-culture was similar to that in the F5+M10 model (Figure 3A).
 |
Figure 3 Characterization of spheroids. (A) Morphological & histological aspects of spheroids: typical brightfield images (i), Ki67 staining (ii), fluorescence images (iii). Spheroids were generated from pre-stained cells by membrane linker PKH67 (green) for FaDu, PKH26 (red) for MeWo and CellVue Claret (pink) for macrophages. Scale bar = 100µm. (B) Percentage of cell types in spheroids assessed by flow cytometry. Analyses were performed at day 5 of spheroids culturing. Data presented as mean ± SEM (n = 8). Statistical significance is marked with an asterisk (*) *p ≤ 0.05. |
Ki67-assessed staining demonstrated strong cell proliferation in both types of spheroids without a clear necrotic core (Figure 3A). The quantification of each cell type in the spheroids was determined by flow cytometry on day 5 of culture (Figure 3B). The addition of macrophages to mono-spheroid F5 resulted in ca. 30% infiltration. This infiltration level is comparable with our precedent study, where 30% of macrophages were detected in co-cultured FaDu / macrophage spheroids.15 In CAF-enriched FaDu spheroids the number of macrophages was approximately 40%, which was statistically different (p = 0.0127) compared to macrophage-enriched FaDu spheroids (Figure 3B). Using quantitative image analysis (Image J software), we estimated macrophage infiltration to be 27 ± 2% (n = 19) and 26 ± 4% (n =9) for the co-culture and tri-culture, respectively. By combining the data from both techniques, we can conclude that the presence of MeWo cells does not prevent macrophages from infiltrating spheroids.
Assessment of TME Features in Spheroids
To characterize the fabricated spheroid models, IHC staining of E-cadherin, vimentin, and immunofluorescence of fibronectin was performed on frozen sections of spheroids (Figure 4A), along with qPCR analysis of epithelial-mesenchymal transition (EMT) markers (Figure 4B). Compared to F5 spheroids, E-cadherin expression was lower in co- or tri-culture spheroids (Figure 4A). Indeed, the addition of either macrophages or fibroblasts to mono-culture F5 spheroids resulted in the downregulation of E-cadherin gene expression (Figure 4B), thus indicating the loss of adherent junctions and rendering the spheroids more fragile than the parent F5 spheroid. We further assessed N-cadherin expression in co-cultured and tri-cultured spheroids (Figure 4). Two distinct profiles of N-cadherin expression were observed depending on the type of spheroid: downregulation of N-cadherin in F5 spheroids with or without macrophages and significant N-cadherin expression (p < 0.05) in fibroblast-enriched and tri-culture spheroids (Figure 4B).
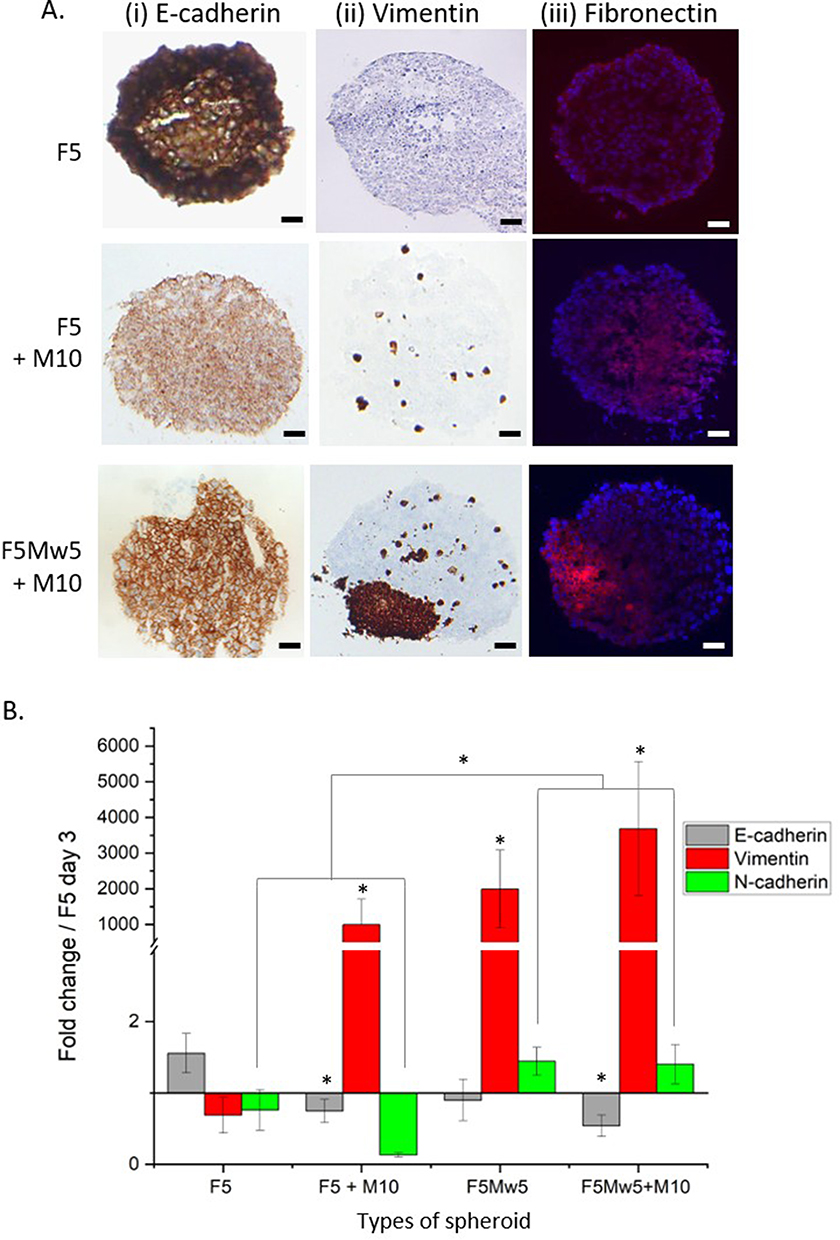 |
Figure 4 Expression of EMT markers on day 5 of spheroids culturing. (A) Immunohistochemical analysis of E-cadherin (i), vimentin (ii) and immunofluorescence-assessed expression of fibronectin (iii, red fluorescence) on frozen cuts of spheroids. Scale bar = 100µm. (B) Change in mRNA expression of E-cadherin, N-cadherin and vimentin. Relative gene expression was normalized to that of FaDu spheroids (F5) on day 3 using the standard 2-ddCt method. A solid black line was added to indicate this normalization. Data presented as mean ± SEM (n = 4–5). Statistical significance is marked with an asterisk (*) *p ≤ 0.05. |
Although loss of E-cadherin and expression of N-cadherin25 are the primary criteria for EMT in cancer, they are not sufficient. To highlight the EMT process, it is necessary to determine the expression of additional mesenchymal markers such as vimentin and fibronectin. Compared with F5 spheroids, we observed a clear increase in the expression of fibronectin and vimentin (Figure 4A) and a strong upregulation of vimentin (p < 0.05) (Figure 4B) in co-culture and tri-culture spheroids. According to these findings, stromal cells such as CAFs and macrophages promote EMT in the proposed 3D tri-culture model, underprinting the mesenchymal nature of the cells.
We further evaluated the phenotype of the macrophage-infiltrating spheroids using qRT-PCR. The macrophages share some M1 and M2 characteristics, however, M2-like macrophages were predominant in macrophage-enriched spheroids, as evidenced by upregulation of CD163 expression (Figure 5A) and low CD80 expression (Figure 5B). The prevalence of M2 pro-tumor type macrophages also correlated with the presence of high levels of immunosuppressive factors or immunomodulators, such as CCL2, PDL-1, and IL-10 (Figure 5A), and low or comparable levels of TNF-α, IL-1β, and IL-12 (Figure 5B), which are characteristic of M1-like cells.
 |
Figure 5 qRT-PCR assessed macrophage differentiation in 3D spheroids on day 5 of spheroids culturing. Gene expression of (A) M2 markers (CD163, IL-10, PDL-1, TGF-β, CCL2 and MMP-9) and of (B) M1 markers (CD80, TNF-α, IL-1β and IL-12) in 3D spheroids. Data presented as mean ± SEM (n= 3–4). Statistical significance is marked with an asterisk **p ≤ 0.01, ***p ≤0.001 compared with F5. Abbreviation: a.u., arbitrary units. |
Foslip Accumulation
After 24 h of incubation, Foslip accumulation in the dissociated spheroids was assessed using flow cytometry by measuring the mean fluorescence intensity (MFI) (Figure 6A). According to MFI values, Foslip accumulation was the same in FaDu spheroids (125,000 ± 15,000 a.u.) and spheroids co-cultured with MeWo (F5Mw5) (151,000 ± 13,000 a.u.; p = 0.187) (Figure 6A). By contrast, Foslip fluorescence increased significantly when macrophages infiltrated spheroids, reaching a 2-times higher value of MFI value than macrophage-free spheroids (Figure 6A).
 |
Figure 6 Foslip accumulation in 3D spheroids assessed by flow cytometry 24 h post-incubation. (A) Overall mTHPC mean fluorescence intensity (MFI) in whole spheroid. (B) Foslip cellular uptake with percentage of Foslip positive cells and (C) subsequent percentage of cells with high Foslip fluorescence. Data presented as mean ± SEM (n = 5–7). Statistical significance is marked with an asterisk (*) *p ≤ 0.05, ** p ≤ 0.01, ***p ≤ 0.001. (D) Typical mTHPC fluorescence pattern displayed in pseudo-colors (ImageJ software). Scale bar 100 μm. Foslip concentration was 4.5 μM. |
As presented in our previous paper,15 three distinct cell populations could be derived from the flow cytometry plots: unstained cells and cells exhibiting low and high mTHPC fluorescence. Based on this analysis (Figure 6B), the fraction of cells with high fluorescence increased significantly upon macrophage infiltration, reaching 55.5% (p = 0.010) and 69.7% (p = 0.00003) in the F5+M10 and F5Mw5+M10 spheroids, respectively. Further investigation was performed to identify the cell types involved in this increase. Using distinct fluorescent membrane dyes, the increased fraction of high fluorescence could be attributed solely to macrophages, as there was no significant change in the percentage of FaDu or Mewo cells with high Foslip fluorescence after macrophage infiltration (Figure 6C). The pattern of Foslip distribution on frozen cuts (Figure 6D) confirmed Foslip accumulation across the spheroid, with strong Foslip fluorescence at its periphery (Figure 6D).
Photo-Induced Cell Death and Modification in Macrophage Phenotype
We evaluated the photoinduced toxicity in mono- and co-culture spheroids 24 h after Foslip-PDT irradiation with escalating light fluences (Figure 7). Dose-dependent cell death was observed in all types of spheroids, with acceptable viability in the control groups (no light, no drug, or drug only) (Figure 7). Photo-induced cell death did not differ between monoculture, co-culture, and tri-culture spheroids at any applied light dose.
 |
Figure 7 Photo-induced cell death in 3D spheroids assessed by flow cytometry 24 h post-PDT. Foslip concentration was 4.5 μM. Data presented as mean ± SEM. |
M2-TAM contribute to an immunosuppressive tumor microenvironment affecting tumor progression and chemotherapy resistance. Considering that the M2 phenotype was predominant in macrophage-enriched spheroids (Figure 5), we were interested in whether a change in macrophage phenotype could be achieved by Foslip-PDT. Spheroids were dissociated 24 h after PDT and analyzed using flow cytometry to assess the expression of CD80 (M1) and CD206 (M2). The protein expression presented in Figure 8 was normalized to that of the spheroids without irradiation (normalized to 1). In F5+M10 spheroids (Figure 8A), CD80 expression increased after irradiation at 20 and 40 J/cm 2, and was accompanied by a notable decrease in CD206 expression. In tri-culture spheroids (Figure 8B), CD80 expression was elevated at all light doses (p < 0.001 at 10 J/cm 2), and CD206 expression was significantly decreased at 20 and 40 J/cm 2 (p < 0.001 and p = 0.0033 respectively) (Figure 8B). Thus, in response to Foslip-mediated PDT, we observed an increase in the M1 marker with a loss of M2 characteristics, suggesting that Foslip-PDT triggers the modification of the macrophage phenotype towards anti-tumor M1-like macrophages.
 |
Figure 8 Photo-induced modifications of macrophages phenotype 24h after Foslip-based PDT. Protein surface expression was assessed by flow cytometry in (A) F5 spheroids with and without macrophages, and (B) F5Mw5 spheroids with and without macrophages. Protein expression was normalized to that in non-irradiated spheroids. The concentration in the Foslip was 4.5 μM. Data are presented as mean ± SEM (n = 3–4). Statistical significance is marked with an asterisk (*) ** p ≤ 0.01 and *** p ≤ 0.001. |
Discussion
Increasing amount of studies indicate that the TME is important for cancer progression, metastasis and resistance to anti-cancer drugs.1 Generally TME consists of irregularly formed tumor vessels, extracellular matrix, cancer-associated fibroblasts (CAF), and immune cells, including TAM.1 Fibroblasts and macrophages are the key players in the head and neck cancer microenvironment.14 Numerous papers investigated the interactions between cancerous and non-cancerous cells (CAFs and TAMs) to improve our understanding of how anti-cancer therapies can affect a variety of malignancies,14,26 including HNC.5,27 CAFs and M2 macrophages may be potential prognostic predictors of oral cancers.28
Both 3D co- and tri-culture models exhibited approximately 30% macrophage infiltration (Figure 2), consistent with previous studies, in which TAM accounted for up to 50% of the tumor mass.24 Special attention was paid to the distribution of stromal cells in the spheroids. In solid tumors, the distribution of immune cells in the TME is heterogeneous with TAMs often found infiltrating the tumor.3 TAMs are also abundant at the tumor margins, where they may be involved in different processes like tissue metastasis and immune surveillance.29 Homogenous macrophages infiltration was observed in macrophages-enriched FaDu spheroids, whereas macrophages were less evenly distributed in tri-culture models (Figure 3A). This change in the distribution pattern was clearly related to fibroblast localization in the tri-culture model. In head and neck cancers, CAFs are distributed at higher densities in the peritumoral stroma, around blood vessels, and in areas of tumor invasion. Their distribution is influenced by factors such as tumor size, hypoxia, inflammation etc.30 We indeed observed predominantly peripheral localization of CAFs, and cells were recurrently assembled in the form of clusters (Figure 3A).
Epithelial-mesenchymal transition (EMT), the acquisition of mesenchymal features from epithelial cells, occurs during tumor progression and is a highly deregulated process.5,31 Tri-culture 3D spheroids demonstrate the main features of EMT, such as a decrease in E-cadherin expression with a simultaneous increase in the expression of N-cadherin. Furthermore, although vimentin was upregulated in all types of co-culture and tri-culture 3D models, fibronectin was overexpressed in tri-cultures only (Figure 4). These changes are clearly related to the mesenchymal phenotype of cells and suggest remodeling of the extracellular matrix, as reported in many studies.26,32 It is widely acknowledged that pro-tumor M2 are the predominant type of TAM in HNSCC.33,34 We observed an upregulation of characteristic markers of M2 (CD163, PDL-1, IL-10, and CCL2) along with downregulation of several M1-like macrophage markers (Figure 5A), thus confirming that M2-like macrophages are the principal type of TAM in the tri-culture model. These data are consistent with the review of Lechien et al, where several studies based on clinical samples demonstrated that over 80% of macrophages in the head and neck TME were M2-macrophages35 It is also known that U937 cells, the precursors of M0 macrophages, are skewed toward the M2 phenotype.36 The upregulation of M2 gene expression was observed from day 3 after spheroid formation (data not shown) and was independent of culture duration or the presence of CAFs. Moreover, M2 upregulation was even improved in the absence of CAFs (Figure 5A). Immune cell recruitment and macrophage polarization are critically dependent on the release of cytokines and growth factors. The secretion of chemokine CCL2 by HNSCC cells37 or fibroblast-rich breast cancer spheroids,38 is associated with monocyte recruitment and polarization to M2 macrophages. Overall, we can conclude that 3D HNSCC models were faithfully generated using human pharyngeal cancer cells and the surrounding stromal components, such as tumor fibroblasts and macrophages, with a predominance of M2 macrophages.
Tri-culture models and the corresponding control spheroids were further subjected to Foslip-PDT at escalating light fluences to explore the influence of cell heterogeneity on the photo-induced response. Our previous study15 conducted in co-culture FaDu/macrophage spheroids, demonstrated improved Foslip accumulation in macrophages compared to FaDu cells. Consistent with this observation, Foslip in tri-culture spheroids also showed efficient accumulation in macrophages (Figure 6C). Better Foslip accumulation in tri-culture may be related to notable macrophage infiltration (Figure 2) and/or enhanced spheroid permeability, as evidenced by reduced E-cadherin staining in the presence of CAFs (Figure 4A and B). Therefore, the accumulation of Foslip was significantly facilitated while maintaining peripheral localization (Figure 6D). Strong Foslip confinement to the periphery of different types of spheroids has already been reported in several papers.20,39,40 In our previous report,15 a better uptake of Foslip by macrophages at the expense of FaDu cells in macrophage-enriched spheroids did not result in improvement of photo-induced PDT efficiency. The same was true for the tri-culture model (Figure 7A). In addition to its direct photo-induced tumor cell death, nanoparticle-based PDT is known to induce immunogenic cell death,41 target TME cells,42,43 modulate the microenvironment,44 and reprogram TAMs.45–48 The ideal way to target TAM is to repolarize M2 macrophages into tumor-killing M1 macrophages, thus promoting the anti-tumor immune response. Only few studies reported photo-induced repolarization to M1 macrophages in cultured tumor cells.10,48–50 A study of Wang et al demonstrated a photo-induced pro‐inflammatory polarization of 2D murine macrophages into M1 macrophages leading to a robust anti-tumor immune response.49 A study of Zhu et al demonstrated that sublethal photodynamic treatment using Temoporfin crystalline nanoparticles triggers repolarization of M1- to M2-like macrophages in 2D macrophages.48 A very recent study51 demonstrated a loss of pro-tumor characteristics of M2 macrophages after their incubation with conditioned medium from PDT–exposed colorectal cancer cell lines. To the best of our knowledge, the photoinduced repolarization of macrophages in 3D tumor models has not yet been reported. Twenty-four hours after Foslip PDT, we observed reduced expression of M2-surface markers (CD206) and an increase in M1-CD80 expression in the tri-culture model, specifically at lower light doses (Figure 8B). Interestingly, the significant photoinduced repolarization of M2 macrophages to M1 was registered only in the tri-culture model. In all probability, an enrichment of TME with fibroblasts enhanced the inflammatory signaling after PDT. Indeed, the fibroblasts can release pro-inflammatory cytokines leading to several phenomena as an upregulation of CD80 and activation of immune cells.52 PDT-induced CD80 up-regulation is also influenced by the photosensitizer, its penetration and by different tumour microenvironment factors, such as the number of macrophages.53 While CAFs have been shown to play a major role in facilitating tumor progression in different types of cancer, including HNSCC,30 numerous studies pointed out to the heterogeneity and complexity of CAFs with either tumor-promoting or tumor-inhibiting properties.5 TAMs is a predominant immune cell population in TME with M2 macrophages being the principal subtype. Therefore, there is a pressing need to identify treatment modalities that can induce the polarization of M2 to M1 macrophages. In this context, Foslip-mediated photoinduced modification of macrophage phenotype repolarization represents a promising avenue for HNC management.
However, a more critical understanding of these issues is required. Rather than THP-1 cells, which skew to M1, U937 cells, which tend towards the M2 phenotype,36 can influence the final outcome. While PMA -treated U937 and THP-1 cells are a useful model to study TAM, it is still a simplified version of TAMs and may not fully replicate all features of TME macrophages. In addition, to confirm the conclusion regarding the repolarization of photoinduced macrophages, it would be beneficial to use a broader panel of M1 and M2 surface markers. In the future, it would be advantageous to determine the levels of the secreted pro- and anti-inflammatory cytokines. While useful, this model is still a simplified version of TAMs and may not fully replicate all features of TME macrophages.
Conclusion
In conclusion, we created a 3D model to study ex vivo tumor microenvironment, which integrates tumor cells with cancer-associated fibroblasts and tumor-associated macrophages. Foslip-based PDT was applied to this microtumor model and was effective in re-educating pro-tumor M2 macrophages in favor of tumor-killing M1 macrophages. These findings open the way to new therapeutic strategies. The consequences of TAM repolarization could be an activation of anti-tumor immunity via the production of pro- inflammtory cytokines; inhibition of tumor growth and metastasis by increasing phagocytosis activity of macrophages8,33,54 and the development of nanoparticle-based strategies for selective TAM targeting, thus reducing systemic toxicity.55
Acknowledgments
The authors are grateful to biolitec research GmbH (Jena, Germany) for providing the Foslip used in this study.
Funding
This study was financially supported by the Institut de Cancérologie de Lorraine.
Disclosure
The authors report no conflict of interest.
References
1. Rad HS, Shiravand Y, Radfar P, et al. Understanding the tumor microenvironment in head and neck squamous cell carcinoma. Clin Transl Immunol. 2022;11(6):e1397. doi:10.1002/cti2.1397
2. Sung H, Ferlay J, Siegel RL, et al. Global Cancer Statistics 2020: GLOBOCAN estimates of incidence and mortality worldwide for 36 cancers in 185 countries. CA Cancer J Clin. 2021;71(3):209–15. doi:10.3322/caac.21660
3. Elmusrati A, Wang J, Wang CY. Tumor microenvironment and immune evasion in head and neck squamous cell carcinoma. Int J Oral Sci. 2021;13(1):24. doi:10.1038/s41368-021-00131-7
4. Ferlay J, Colombet M, Soerjomataram I, et al. Estimating the global cancer incidence and mortality in 2018: GLOBOCAN sources and methods. Int J Cancer. 2019;144(8):1941–1953. doi:10.1002/ijc.31937
5. Rademaekers M, Johansson EO, Johansson E, Roberg K, Wiechec E. Tumor-matched and unmatched cancer associated fibroblasts exhibit differential effect on proliferation and FMOD and MMP9 gene expression in head and neck squamous cell carcinoma cells when cocultured in spheroids. Cancer Cell Int. 2024;24(1):190. doi:10.1186/s12935-024-03388-0
6. Bray F, Laversanne M, Sung H, et al. Global cancer statistics 2022: GLOBOCAN estimates of incidence and mortality worldwide for 36 cancers in 185 countries. CA Cancer J Clin. 2024;74(3):229–263. doi:10.3322/caac.21834
7. Uthaman S, Pillarisetti S, Lim YM, et al. Light and immunostimulant mediated in situ re-education of tumor-associated macrophages using photosensitizer conjugated mannan nanoparticles for boosting immuno-photodynamic anti-metastasis therapy. Biomater Sci. 2023;11(1):298–306. doi:10.1039/D2BM01508K
8. Furgiuele S, Descamps G, Cascarano L, et al. Dealing with macrophage plasticity to address therapeutic challenges in head and neck cancers. Int J Mol Sci. 2022;23(12):6385. doi:10.3390/ijms23126385
9. Olek M, Kasperski J, Skaba D, Wiench R, Cieślar G, Kawczyk-Krupka A. Photodynamic therapy for the treatment of oral squamous carcinoma—Clinical implications resulting from in vitro research. Photodiagn Photodyn Ther. 2019;27:255–267. doi:10.1016/j.pdpdt.2019.06.012
10. Modi SK, Mohapatra P, Bhatt P, et al. Targeting tumor microenvironment with photodynamic nanomedicine. Med Res Rev. 2024:
11. Wiehe A, Senge MO. The Photosensitizer Temoporfin (
12. Yakavets I, Millard M, Zorin V, Lassalle HP, Bezdetnaya L. Current state of the nanoscale delivery systems for temoporfin-based photodynamic therapy: advanced delivery strategies. J Control Release. 2019;304:268–287. doi:10.1016/j.jconrel.2019.05.035
13. Song PN, Mansur A, Lu Y, et al. Modulation of the tumor microenvironment with trastuzumab enables radiosensitization in HER2+ breast cancer. Cancers. 2022;14(4):1015. doi:10.3390/cancers14041015
14. Arora L, Kalia M, Dasgupta S, Singh N, Verma AK, Pal D. Development of a multicellular 3D tumor model to study cellular heterogeneity and plasticity in NSCLC tumor microenvironment. Front Oncol. 2022;12:881207. doi:10.3389/fonc.2022.881207
15. Francois A, Dirheimer L, Chateau A, Lassalle HP, Yakavets I, Bezdetnaya L. A macrophages-enriched head and neck tumor spheroid model to study Foslip® behavior in tumor microenvironment. Int J Nanomedicine. 2023;18:6545–6562. doi:10.2147/IJN.S427350
16. Yakavets I, Francois A, Guiot M, et al. NIR imaging of the integrin-rich head and neck squamous cell carcinoma using ternary copper indium selenide/zinc sulfide-based quantum dots. Cancers. 2020;12(12):3727. doi:10.3390/cancers12123727
17. Yakavets I, Jenard S, Francois A, et al. Stroma-rich co-culture multicellular tumor spheroids as a tool for photoactive drugs screening. J Clin Med. 2019;8(10):1686. doi:10.3390/jcm8101686
18. Coutier S, Bezdetnaya L, Marchal S, et al. Foscan® (mTHPC) photosensitized macrophage activation: enhancement of phagocytosis, nitric oxide release and tumour necrosis factor-α-mediated cytolytic activity. Br J Cancer. 1999;81(1):37–42. doi:10.1038/sj.bjc.6690648
19. Reinhard A, Bressenot A, Dassonneville R, et al. Photodynamic therapy relieves colitis and prevents colitis-associated carcinogenesis in mice. Inflamm Bowel Dis. 2015;21(5):985–995. doi:10.1097/MIB.0000000000000354
20. Yakavets I, Francois A, Lamy L, et al. Effect of stroma on the behavior of temoporfin-loaded lipid nanovesicles inside the stroma-rich head and neck carcinoma spheroids. J Nanobiotechnol. 2021;19(1):3. doi:10.1186/s12951-020-00743-x
21. Bisheshar SK, Van Der Kamp MF, De Ruiter EJ, et al. The prognostic role of tumor associated macrophages in squamous cell carcinoma of the head and neck: a systematic review and meta-analysis. Oral Oncol. 2022;135:106227. doi:10.1016/j.oraloncology.2022.106227
22. He KF, Zhang L, Huang CF, et al. CD163+ tumor-associated macrophages correlated with poor prognosis and cancer stem cells in oral squamous cell carcinoma. Biomed Res Int. 2014;2014:1–9. doi:10.1155/2014/838632
23. Mhaidly N, Journe F, Najem A, et al. Macrophage profiling in head and neck cancer to improve patient prognosis and assessment of cancer cell-macrophage interactions using three-dimensional coculture models. Int J Mol Sci. 2023;24(16):12813. doi:10.3390/ijms241612813
24. Xue Y, Song X, Fan S, Deng R. The role of tumor-associated macrophages in oral squamous cell carcinoma. Front Physiol. 2022;13:959747. doi:10.3389/fphys.2022.959747
25. Ribatti D, Tamma R, Annese T. Epithelial-mesenchymal transition in cancer: a historical overview. Transl Oncol. 2020;13(6):100773. doi:10.1016/j.tranon.2020.100773
26. Dhandapani H, Siddiqui A, Karadkar S, Tayalia P. In vitro 3D spheroid model preserves tumor microenvironment of hot and cold breast cancer subtypes. Adv Healthc Mater. 2023;12(21):2300164. doi:10.1002/adhm.202300164
27. Higashino N, Koma YI, Hosono M, et al. Fibroblast activation protein-positive fibroblasts promote tumor progression through secretion of CCL2 and interleukin-6 in esophageal squamous cell carcinoma. Lab Invest. 2019;99(6):777–792. doi:10.1038/s41374-018-0185-6
28. Fujii N, Shomori K, Shiomi T, et al. Cancer‐associated fibroblasts and CD163‐positive macrophages in oral squamous cell carcinoma: their clinicopathological and prognostic significance. J Oral Pathol Med. 2012;41(6):444–451. doi:10.1111/j.1600-0714.2012.01127.x
29. Hu J, Xu X, Du Y. Targeting tumor-associated macrophages for imaging. Pharmaceutics. 2022;15(1):144. doi:10.3390/pharmaceutics15010144
30. Cirri P, Chiarugi P. Cancer associated fibroblasts: the dark side of the coin. Am J Cancer Res. 2011;1(4):482–497.
31. Xiao J, Song Y, Gao R, et al. Changes of immune microenvironment in head and neck squamous cell carcinoma in 3D-4-culture compared to 2D-4-culture. J Transl Med. 2023;21(1):771. doi:10.1186/s12967-023-04650-1
32. Jang SD, Song J, Kim HA, et al. Anti-cancer activity profiling of chemotherapeutic agents in 3D co-cultures of pancreatic tumor spheroids with cancer-associated fibroblasts and macrophages. Cancers. 2021;13(23):5955. doi:10.3390/cancers13235955
33. Li B, Ren M, Zhou X, Han Q, Cheng L. Targeting tumor-associated macrophages in head and neck squamous cell carcinoma. Oral Oncol. 2020;106:104723. doi:10.1016/j.oraloncology.2020.104723
34. Mantovani A, Marchesi F, Malesci A, Laghi L, Allavena P. Tumour-associated macrophages as treatment targets in oncology. Nat Rev Clin Oncol. 2017;14(7):399–416. doi:10.1038/nrclinonc.2016.217
35. Lechien JR, Descamps G, Seminerio I, et al. HPV involvement in the tumor microenvironment and immune treatment in head and neck squamous cell carcinomas. Cancers. 2020;12(5):1060. doi:10.3390/cancers12051060
36. Nascimento CR, Rodrigues Fernandes NA, Gonzalez Maldonado LA, Rossa Junior C. Comparison of monocytic cell lines U937 and THP-1 as macrophage models for in vitro studies. Biochem Biophys Rep. 2022;32:101383. doi:10.1016/j.bbrep.2022.101383
37. Gao L, Wang FQ, Li HM, et al. CCL2/EGF positive feedback loop between cancer cells and macrophages promotes cell migration and invasion in head and neck squamous cell carcinoma. Oncotarget. 2016;7(52):87037–87051. doi:10.18632/oncotarget.13523
38. Ksiazkiewicz M, Gottfried E, Kreutz M, Mack M, Hofstaedter F, Kunz-Schughart LA. Importance of CCL2-CCR2A/2B signaling for monocyte migration into spheroids of breast cancer-derived fibroblasts. Immunobiology. 2010;215(9–10):737–747. doi:10.1016/j.imbio.2010.05.019
39. Gaio E, Scheglmann D, Reddi E, Moret F. Uptake and photo-toxicity of Foscan®, Foslip® and Fospeg® in multicellular tumor spheroids. J Photochem Photobiol B. 2016;161:244–252. doi:10.1016/j.jphotobiol.2016.05.011
40. Millard M, Yakavets I, Piffoux M, et al. mTHPC-loaded extracellular vesicles outperform liposomal and free mTHPC formulations by an increased stability, drug delivery efficiency and cytotoxic effect in tridimensional model of tumors. Drug Deliv. 2018;25(1):1790–1801. doi:10.1080/10717544.2018.1513609
41. Duan X, Chan C, Lin W. Nanoparticle‐mediated immunogenic cell death enables and potentiates cancer immunotherapy. Angew Chem Int Ed. 2019;58(3):670–680. doi:10.1002/anie.201804882
42. Ji B, Wei M, Yang B. Recent advances in nanomedicines for photodynamic therapy (PDT)-driven cancer immunotherapy. Theranostics. 2022;12(1):434–458. doi:10.7150/thno.67300
43. Swetha KL, Maravajjala KS, Li SD, Singh MS, Roy A. Breaking the niche: multidimensional nanotherapeutics for tumor microenvironment modulation. Drug Deliv Transl Res. 2023;13(1):105–134. doi:10.1007/s13346-022-01194-7
44. Gao Y, Wang Z, Jin X, et al. Enhanced osteosarcoma immunotherapy via CaCO3 nanoparticles: remodeling tumor acidic and immune microenvironment for photodynamic therapy. Adv Healthc Mater. 2024:2400538. doi:10.1002/adhm.202400538
45. Chen X, Li R, Zhao H, Wang X, Shao Z, Shang Z. Phenotype transition of fibroblasts incorporated into patient‐derived oral carcinoma organoids. Oral Dis. 2023;29(3):913–922. doi:10.1111/odi.14071
46. Xu H, Zhang Y, Guo S, et al. Macrophage reprogramming combined with enhanced photodynamic therapy increases the patency of malignant esophageal obstruction after stenting. Nanoscale. 2024;16(34):16035–16047. doi:10.1039/D4NR01140F
47. Ye J, Yang Y, Dong W, et al. Drug-free mannosylated liposomes inhibit tumor growth by promoting the polarization of tumor-associated macrophages. Int J Nanomedicine. 2019;14:3203–3220. doi:10.2147/IJN.S207589
48. Zhu Z, Scalfi-Happ C, Ryabova A, et al. Photodynamic activity of Temoporfin nanoparticles induces a shift to the M1-like phenotype in M2-polarized macrophages. J Photochem Photobiol B. 2018;185:215–222. doi:10.1016/j.jphotobiol.2018.06.015
49. Wang T, Zhang H, Han Y, et al. Light-enhanced O2-evolving nanoparticles boost photodynamic therapy to elicit antitumor immunity. ACS Appl Mater Interfaces. 2019;11(18):16367–16379. doi:10.1021/acsami.9b03541
50. Yang G, Lu SB, Li C, et al. Type I macrophage activator photosensitizer against hypoxic tumors. Chem Sci. 2021;12(44):14773–14780. doi:10.1039/D1SC04124J
51. Butkute A, Kazlauske E, Mlynska A, et al. Unveiling theranostics: nanocomplex-assisted photodynamic eradication of aggressive cancer cells and modulation of tumor-associated macrophages. Int J Nanomedicine. 2025;20:9787–9806. doi:10.2147/IJN.S518050
52. Kalluri R. The biology and function of fibroblasts in cancer. Nat Rev Cancer. 2016;16(9):582–598. doi:10.1038/nrc.2016.73
53. Beltrán Hernández I, Yu Y, Ossendorp F, Korbelik M, Oliveira S. Preclinical and clinical evidence of immune responses triggered in oncologic photodynamic therapy: clinical recommendations. J Clin Med. 2020;9(2):333. doi:10.3390/jcm9020333
54. Gao J, Liang Y, Wang L. Shaping polarization of tumor-associated macrophages in cancer immunotherapy. Front Immunol. 2022;13:888713. doi:10.3389/fimmu.2022.888713
55. Khan MM, Li Y, Zhou Z, et al. Macrophage-modulating nanomedicine for cancer immunotherapy. Nanoscale. 2024;16(15):7378–7386. doi:10.1039/D3NR06333J
 © 2026 The Author(s). This work is published and licensed by Dove Medical Press Limited. The
full terms of this license are available at https://www.dovepress.com/terms
and incorporate the Creative Commons Attribution
- Non Commercial (unported, 4.0) License.
By accessing the work you hereby accept the Terms. Non-commercial uses of the work are permitted
without any further permission from Dove Medical Press Limited, provided the work is properly
attributed. For permission for commercial use of this work, please see paragraphs 4.2 and 5 of our Terms.
© 2026 The Author(s). This work is published and licensed by Dove Medical Press Limited. The
full terms of this license are available at https://www.dovepress.com/terms
and incorporate the Creative Commons Attribution
- Non Commercial (unported, 4.0) License.
By accessing the work you hereby accept the Terms. Non-commercial uses of the work are permitted
without any further permission from Dove Medical Press Limited, provided the work is properly
attributed. For permission for commercial use of this work, please see paragraphs 4.2 and 5 of our Terms.