Back to Journals » Psychology Research and Behavior Management » Volume 15
Formulation of a Mapping Formula to Estimate Well-Being Utility from Clinical Subjective Well-Being Scales
Authors Koreki A ![]() , Nagaoka M
, Nagaoka M ![]() , Ninomiya A, Mimura M
, Ninomiya A, Mimura M ![]() , Sado M
, Sado M ![]()
Received 21 July 2022
Accepted for publication 10 September 2022
Published 4 November 2022 Volume 2022:15 Pages 3233—3241
DOI https://doi.org/10.2147/PRBM.S383266
Checked for plagiarism Yes
Review by Single anonymous peer review
Peer reviewer comments 2
Editor who approved publication: Dr Igor Elman
Akihiro Koreki,1– 3 Maki Nagaoka,1,3 Akira Ninomiya,1,3 Masaru Mimura,1,3 Mitsuhiro Sado1,3,4
1Department of Neuropsychiatry, Keio University School of Medicine, Tokyo, Japan; 2Department of Psychiatry, National Hospital Organization Shimofusa Psychiatric Medical Center, Chiba, Japan; 3Center for Stress Research, Keio University, Tokyo, Japan; 4Health Center, Keio University, Tokyo, Japan
Correspondence: Mitsuhiro Sado, Department of Neuropsychiatry, Keio University School of Medicine, Shinanomachi 35, Shinjuku-ku, Tokyo, 160-8582, Japan, Tel +81-3-3353-1211 Ext. 62454, Fax +81-3-5379-0187, Email [email protected]
Purpose: Cost-effective analysis is one of the most useful analyses for political decision-making in medicine under a limited budget. Although the data of the ICEpop CAPability measure for Adults (ICECAP-A) is sometimes essential for the measurement of cost effectiveness, such data are often lacking in most clinical trials. Therefore, a conversion formula (ie mapping) derived from the values of clinical assessment scales into utility is required.
Patients and Methods: We used an internet survey where 500 general residents were asked to fill in four kinds of self-reported questionnaires [ICECAP-A, the Satisfaction with Life Scale (SWLS), Flourishing Scale (FS), and the Scale of Positive and Negative Experience (SPANE)]. A beta regression was conducted with the utility assessed by ICECAP-A as a dependent variable.
Results: We developed several mapping formulae depending on available questionnaires. These mapping formulae were well-validated in our validation sample. The models using a greater number of questionnaires tended to show better mapping.
Conclusion: The mapping function of our formula was within the range of other reported mapping studies. We believe this formula is useful for cost effective analyses of several trials where utility data are lacking.
Keywords: mapping, well-being, ICECAP, SWLS, FS, SPANE
Introduction
Health economic evaluations are conducted to inform health care resource allocation decisions.1 This is significant in terms of the optimal allocation of restricted resources. Among the various type of economic evaluations, cost-effectiveness analysis is the gold standard utilized to assess the value of an intervention per unit cost. It is assessed by the incremental cost-effectiveness ratio (ICER), determined by the difference in costs between two health care programs divided by the difference in outcomes between the programs with the comparison typically being between a new health care program and the existing approach to dealing with the same patient group.2 Although approaches to assessing the value of health outcomes differ depending on the context of the literature, they include natural units such as life-years gained, disability days avoided, or cases detected.3 Cost-effectiveness analysis, in which primary outcome is set as a preference-based non-monetary unit, such as quality adjusted life years (QALYs), is specifically referred to as cost-utility analysis.4 To calculate QALYS, a preference-based health-related utility score, such as EuroQol 5 Dimensions (EQ5D),5 which assesses the health conditions of respondents based on five dimensions—mobility, self-care, usual activities, pain/discomfort, and anxiety/depression—is required.
However, several concerns have been raised that measuring health alone in economic evaluation is inadequate.6–9 This is especially the case when the intervention to be evaluated combines health and social care, where they are relevant to public health and the effects of the interventions are anticipated to create an impact beyond the recipients, (ie their careers, families, or the general public.)6 In such cases, scales require the function to assess well-being from a broader perspective. The ICEpop CAPability measure for Adults (ICECAP-A) is a preference-based scale that is expected to address this issue.10 Introduced as a Sen’s capability approach,11,12 it is a self-report scale that assesses a person’s ability to achieve important “functioning” and consists of five attributes with four levels ranging from “full capability” to “no capability.” The five attributes include: 1) Stability (being able to feel settled and secure), 2) Attachment (being able to have love, friendship, and support), 3) Autonomy (being able to be independent), 4) Achievement (being able to achieve and progress), 5) Enjoyment (being able to have enjoyment and pleasure).
In the field of clinical research, well-being has also been attracting significant attention.13,14 Specifically, eudaimonic well-being and two aspects of subjective well-being (life evaluation and affect) are recognized as the dominant concepts.13–15 Each aspect of well-being is assessed using typical clinical scales, including the Satisfaction with Life Scale (SWLS)16 for life evaluation, the Scale of Positive and Negative Experience (SPANE)17 for affect, and the Flourishing Scale (FS)18 for eudaimonia. An extensive body of evidence has endorsed the validity and reliability of the first two scales for assessing life evaluation and affect, and proposed the latter as a reference scale for eudaimonic well-being.19
However, in the field of well-being studies, discrepancies in the well-being scales used, creates difficulties in economic evaluations. This is because most existing clinical trials tend to solely adopt clinical scales and lack the ICECAP data required for economic evaluation. For appropriate economic evaluation, it is then necessary to derive a mapping formula from the values of clinical assessment scales. This allows health economic evaluation of populations who have been assessed with well-being, but where the data of utility is lacking. In the present study, we developed a mapping formula to convert the scores of the well-being clinical scales into utility scores weighted by ICECAP-A.
Materials and Methods
Ethics
This study was approved by the ethics review committee of the Keio University School of Medicine (20210096), and is registered under the UMIN Clinical Trials Registry identifier: UMIN: R000051079. Our study was conducted in accordance with the ethical guidelines set forth by the Declaration of Helsinki.
Design
A cross-sectional internet survey study was conducted.
Participants
The participants of the survey comprised 500 Japanese general residents recruited through the survey system offered by Macromill (https://www.macromill.com/). The candidates were invited to participate in the survey if they were general residents (with no specific restrictions on health conditions, such as past illnesses), in the age group of 20 to 65 years, and able to understand the purpose of the survey and accordingly provide their consent. No particular exclusion criteria existed. Because the level of the relationship between the questionnaires was unknown (also an integral reason for conducting the current study), strict sample size estimation was not conducted, and sample size was determined with reference to other mapping studies.18
Procedures
We conducted the internet-survey using the system provided by Macromill. An email was sent to the registered samples to announce this study. The candidates who showed interest and were ascertained as eligible for the study were offered a written leaflet that provided detailed information about the research. Once they provided their consent through the survey system, they were requested to complete four self-reported questionnaires related to well-being.
Clinical Scales
The survey included the following scales: ICECAP-A, SWLS, FS, and SPANE. It must be noted that the notion of well-being is complex and there is no consensus among researchers regarding its parameters. However, to date, it is thought that well-being consists of different aspects and measuring such aspects is crucial in providing comprehensive snapshots of the respondents’ well-being.19 The Organisation for Economic Co-operation and Development (OECD) has prescribed guidelines on measuring subjective well-being. Therefore, in this survey, we requested participants to complete the following three clinical scales, in addition to ICECAP-A, each of which measures a different aspect of well-being—SWLS: life evaluation; SPANE: affect; FS: eudemonic (meaningful life-associated) aspect of well-being.
Icecap-A
ICECAP-A was developed to measure the capability well-being of adults, which was not captured adequately in pre-existing health-related quality of life scales. As presented in the Introduction, it consists of five attributes and provides a single index value for well-being utility ranging between 0 and 1. A higher score indicates a better well-being status.10
Swls
This scale is a 5-item self-reported questionnaire that evaluates the life evaluation aspect of subjective well-being. Scores for each subscale range from 1 = strongly disagree to 7 = strongly agree. Total scores range from 5 to 35, with higher scores indicating higher satisfaction.15
Fs
This scale includes eight items relevant to significant aspects of human functioning, ranging from positive relationships to feelings of competence, meaning, and having a purpose in life. FS is recognized as a scale that measures the eudemonic aspect of subjective well-being. Each item is answered on a 1–7 Likert scale that ranges from strong disagreement (1) to strong agreement (7). Possible scores range between 8 and 56. A higher score indicates that the respondent has a better eudemonic well-being.16
Spane
This scale consists of 12 items, including six items to assess positive experiences and six to assess negative experiences.17 The positive score (SPANE-P) and the negative score (SPANE-N) are in the range of 6 to 30. A higher score means higher positive or negative affective aspects of well-being.
Statistics
Given the score of ICECAP-A ranges from 0 to 1, which is a beta distribution, a beta regression was conducted to predict the score of ICECAP-A. Because the tariff of ICECAP-A among Japan’s population remains unavailable, we used the weighted utility scores by ICECAP-A among UK samples.6 Regarding independent variables, age, sex, SWLS, FS, and SPANE were set depending on several statistical models (ie A-G: total score was used, a-g: each sub-score was used). The independent variables in each model were as follows:
Model name:
-Uppercase means total score was used, while lowercase means each subscale was used
-Number means the number of questionnaires used in the model
- model 1A/a: SWLS, model 1B/b: FS, model 1C/c: SPANE-P, model 1D/d: SPANE-N
- model 2A/a: SWLS and FS, model 2B/b: SWLS and SPANE-P, model 2C/c: SWLS and SPANE-N, model 2D/d: FS and SPANE-P, model 2E/e: FS and SPANE-N, model 2F/f: SPANE-P and SPANE-N
- model 3A/a: SWLS, FS and SPANE-P, model 3B/b: SWLS, FS and SPANE-N, model 3C/c: SWLS, SPANE-P and SPANE-N, model 3D/d: FS, SPANE-P and SPANE-N
- model 4A/a: SWLS, FS, SPANE-P and SPANE-N
After developing each model, these fitting levels were compared using the mean absolute error (MAE) and the root mean squared error (RMSE) because those error values provide better means to assess mapping functions than R-squared, which focuses on how well the model explains the dataset it was estimated on.18
In addition, to check moderation of socio-economic factors on the relationship between ICECAP and each scale, we conducted sensitivity analyses, where additional regression analyses for our main models were conducted with socio-economic factors (marital status, having children, personal income (median split: median = the category of 2–4 million/year yen), and being employed) as additional dependent variables.
All participants were divided into two groups. Three hundred participants were randomly selected, and their data were used for the development of the model (estimation sample). The data of the remaining participants were used to assess the validity of the developed model (validation sample). These analyses were conducted using R (4.1.0).
Results
Five hundred individuals (age: 44.0 ± 11.5 years old, 287 females, utility assessed by ICECAP-A: 0.62 ± 0.21, SWLS: 19.8 ± 7.1, FS: 32.8 ± 9.3, SPANE-P/N: 19.2 ± 5.3/18.3 ± 4.8) completed the questionnaires using the internet survey. The data in the estimation sample and validation sample were like that of total sample, with no significant difference between them (Table 1). ICECAP-A was correlated with SWLS, FS, SPANE-P, and SPANE-N (r = 0.65, 0.67, 0.65 and −0.47, respectively), SWLS was correlated with FS, SPANE-P, and SPANE-N (r = 0.77, 0.68 and −0.44, respectively), FS was correlated with SPANE-P and SPANE-N (r = 0.74 and −0.39, respectively) (Figure 1). All p-values of correlation analyses were <0.01.
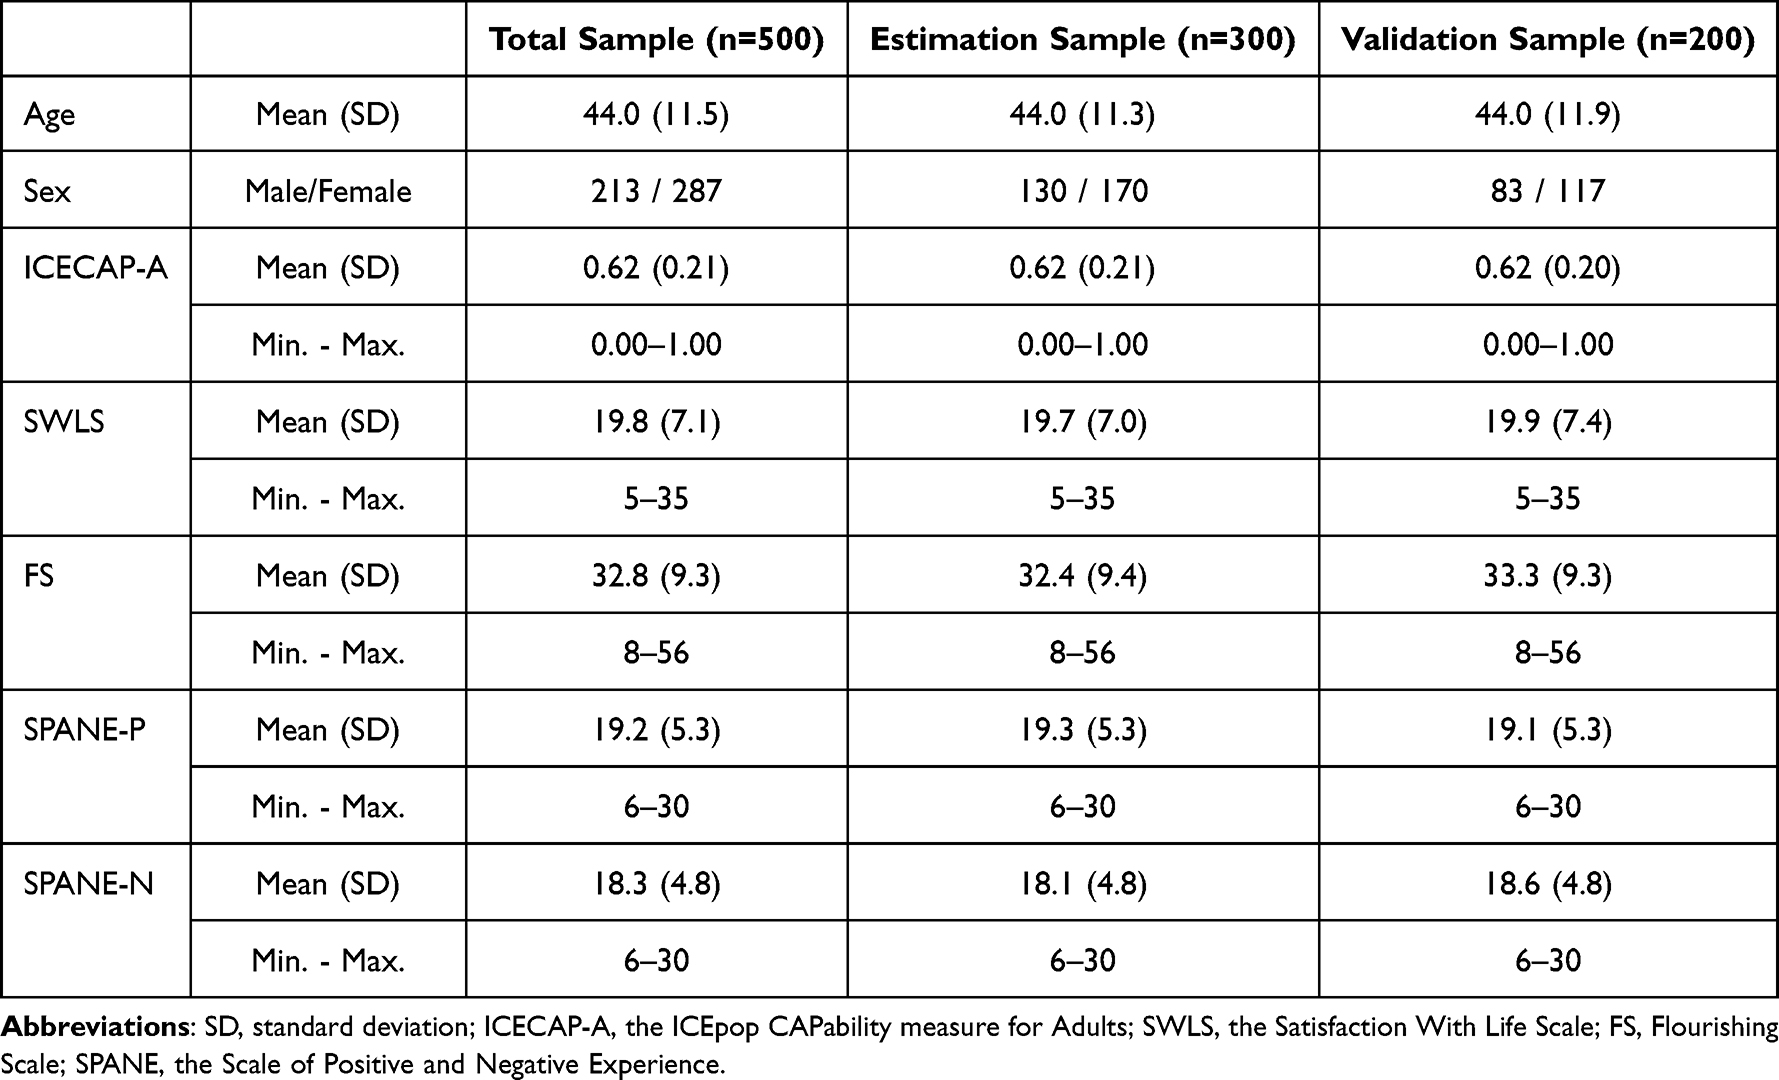 |
Table 1 Characteristics of Our Sample |
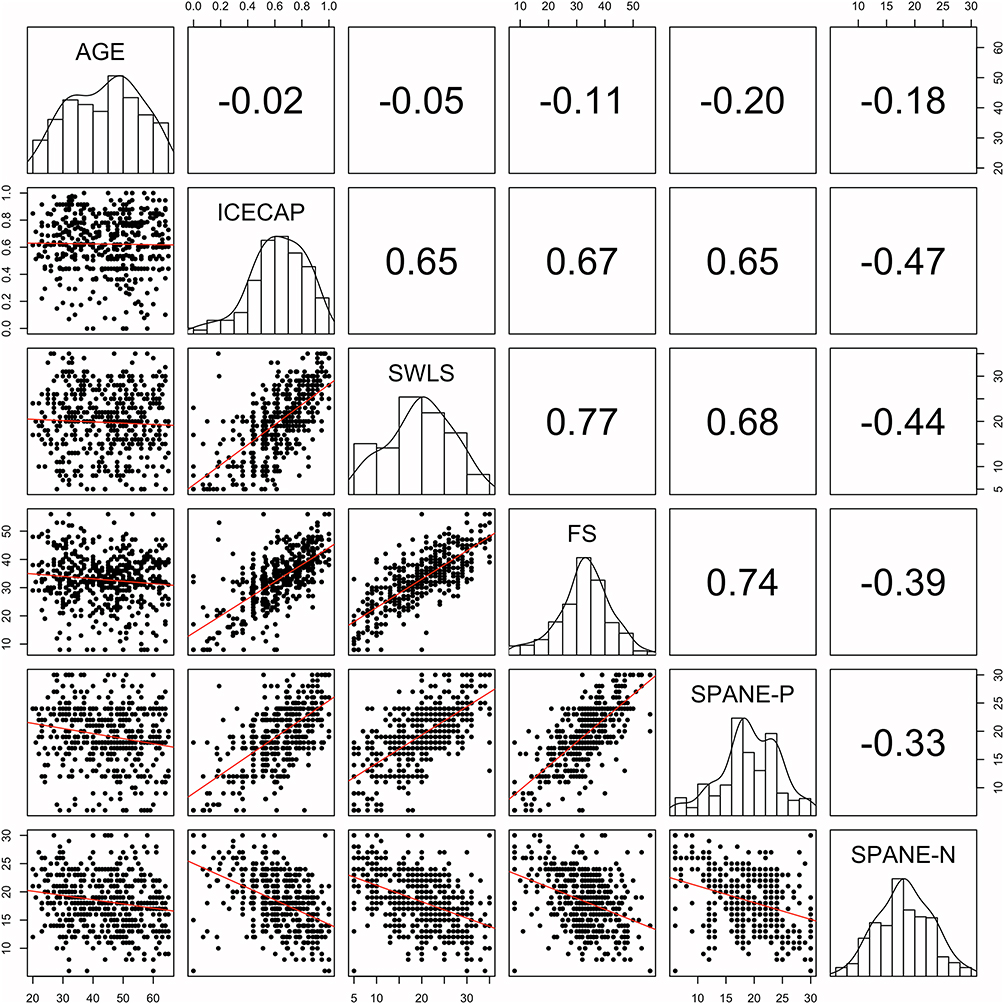 |
Figure 1 Correlation matrix among age and each score of questionnaires regarding well-being. |
The modelling and fitting in each model are presented in Table 2. In total, the model that used more questionnaires showed better modelling and fitting. The model using subscales did not demonstrate any significant changes; rather, its results worsened. The smallest RMSE and MAE were found in Model 4A, where all the questionnaires were used. The estimation of better fitting models is offered in Table 3. One example of formula (model4A) is as follows: ICECAP-A=1/(1+exp (-(Intercept+Estimate1*Age+Estimate2*Female+Estimate3*SWLS)))
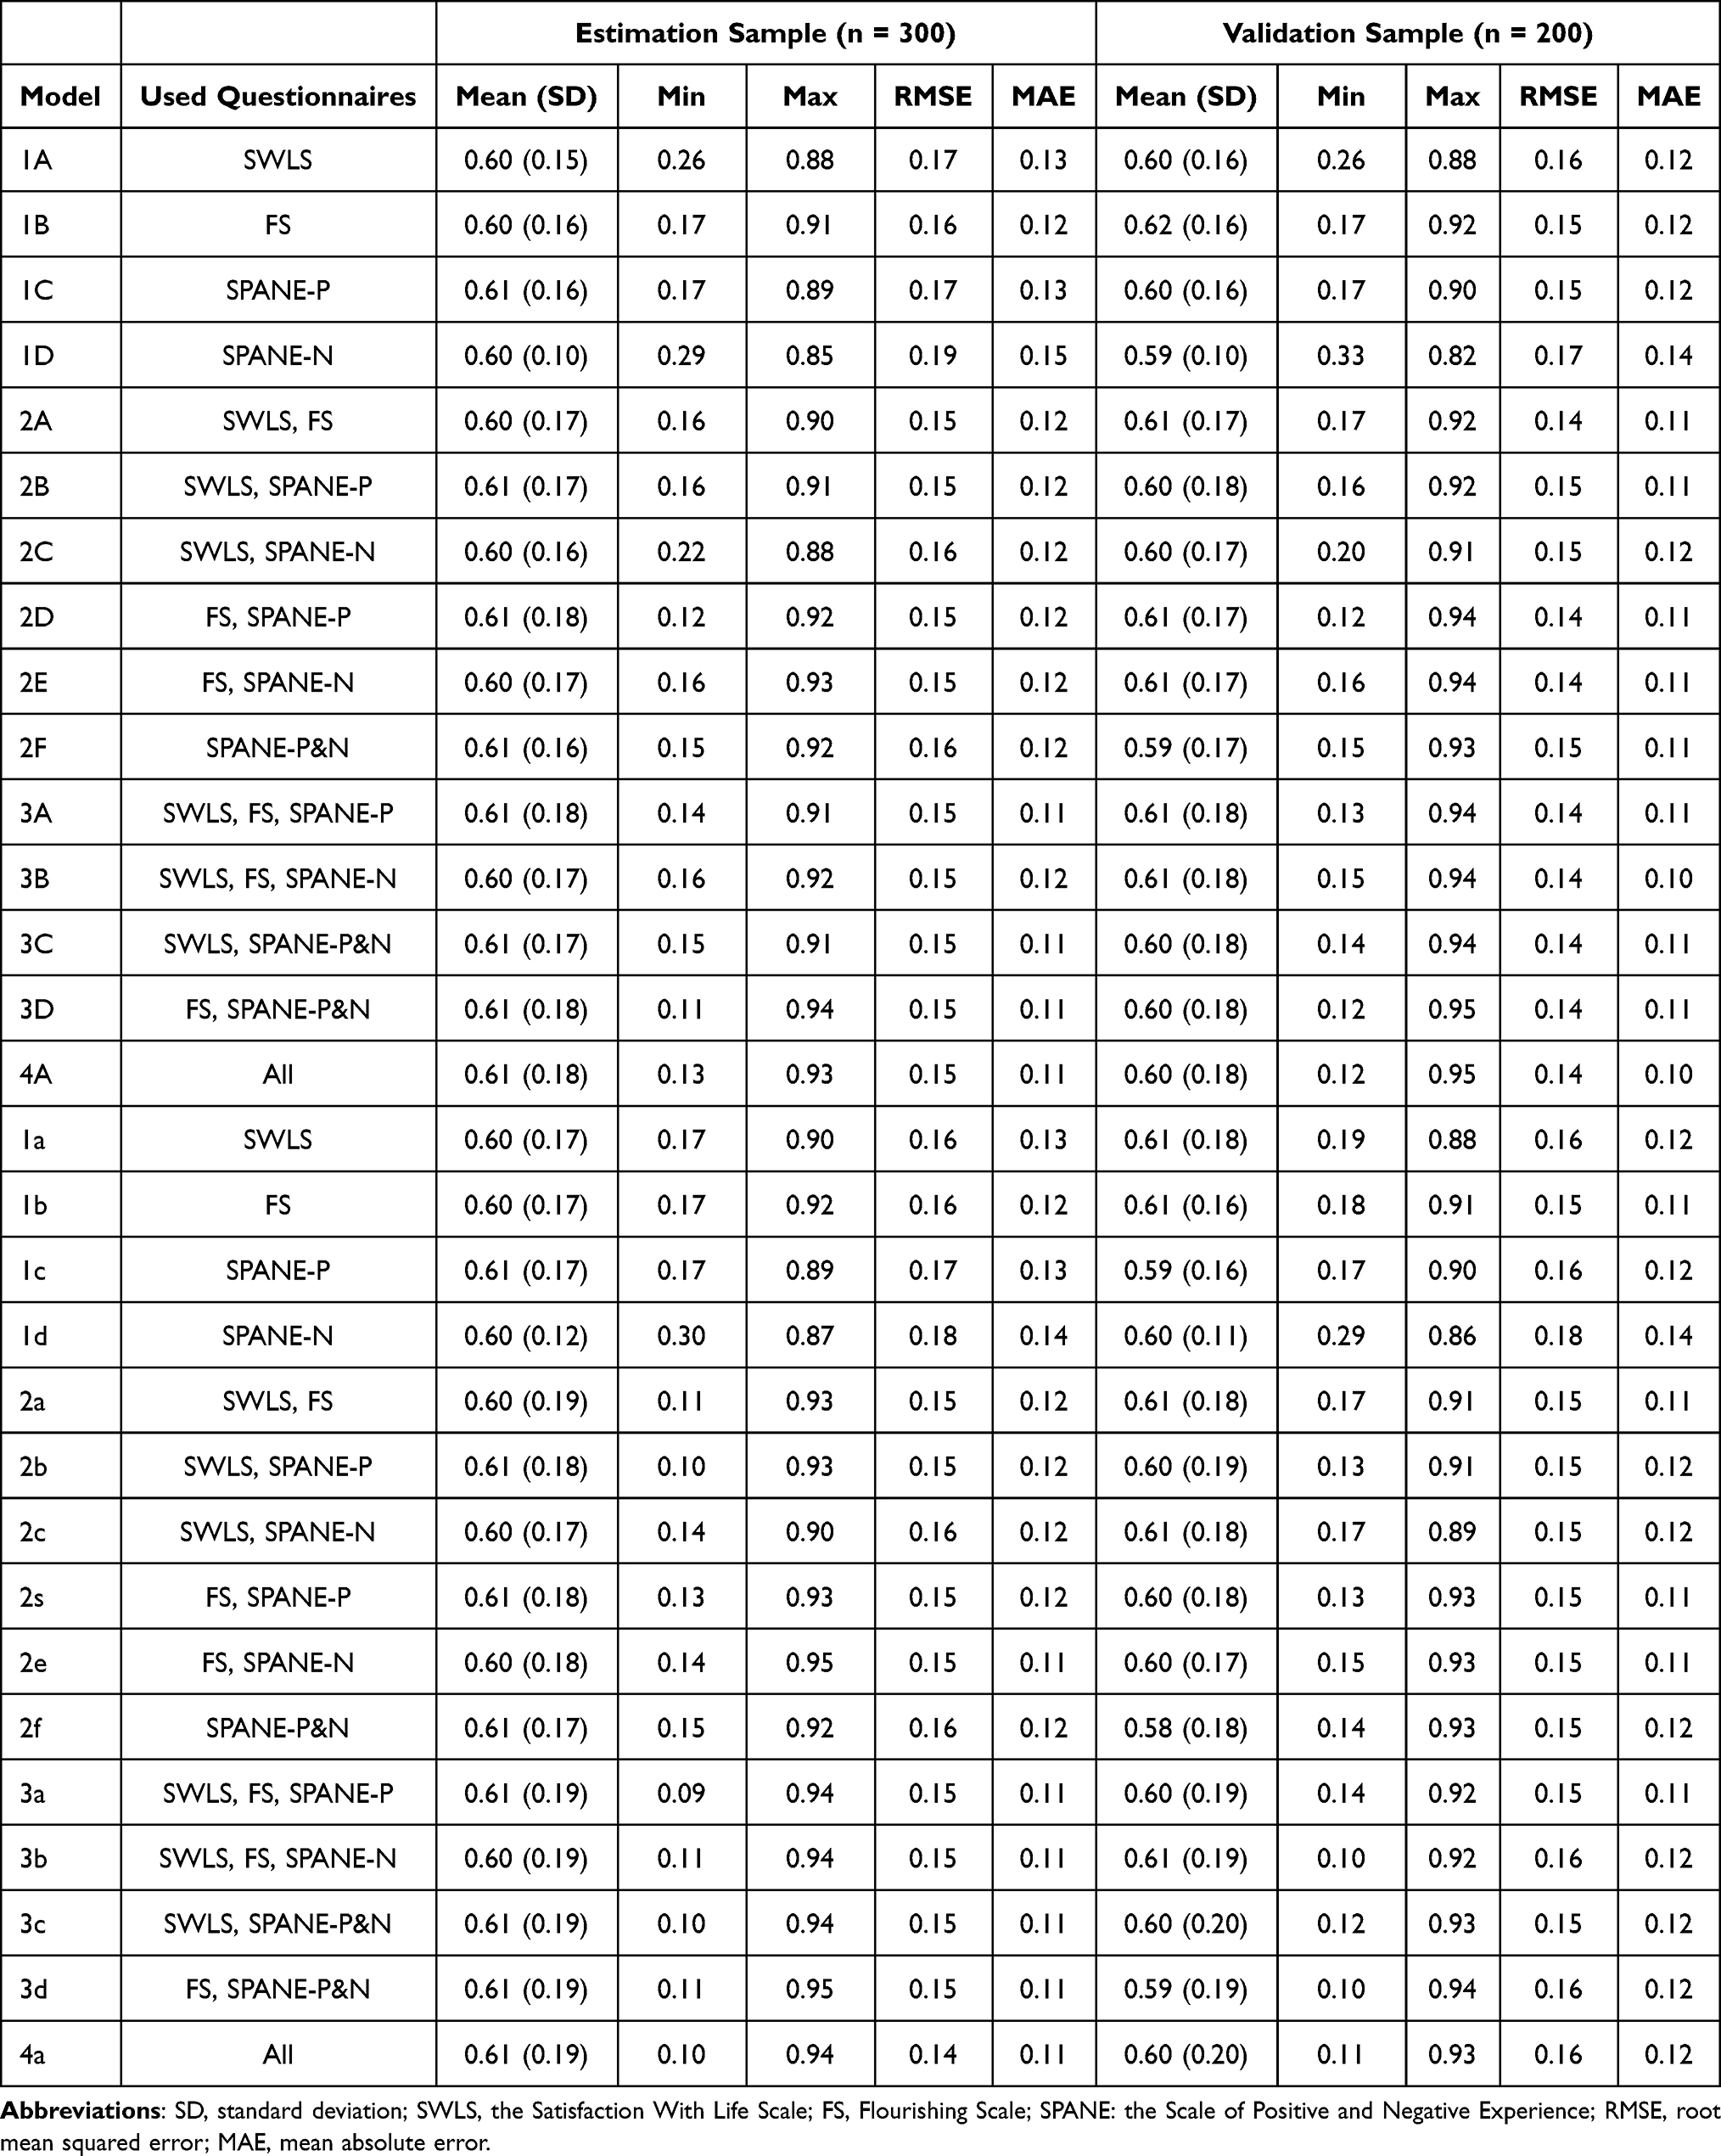 |
Table 2 Modeling and Fitting of Each Model |
 |
Table 3 Estimation of Our Recommended Modelings |
=1/(1+exp (-(−1.4091+(−0.0002)*Age+(−0.1070)*Female+(0.0977)*SWLS))) (also see the footnote of Table 3). In sensitivity analyses with socio-economic factors, similar RMSE and MAE were found (Table 4), suggesting no impact of these factors on our mapping formula.
 |
Table 4 Effect of Socio-Economic Factors on Our Mapping Formula |
Discussion
We developed a mapping formula using subjective well-being questionnaires (SWLS, FS, and SPANE) for the utility assessed by ICECAP-A. To the best of our knowledge, this is the first mapping formula to assess utility scores weighted by ICECAP-A from the aforementioned subjective well-being scales. These models were well-validated in our validation sample. The models that used more questionnaires tended to have a better fit. Given that the mapping formula required is based on which questionnaire is included in the original research, we developed several models, including those using only one questionnaire.
In our model, which included RMSE and MAE (used for assessing mapping functions and where smaller values of errors means better mapping function), the RMSE was 0.14–0.16, and the MAE was 0.10–0.12, which are within the range of other reported mapping studies (MSE: 0.084–0.2 and MAE: 0.0011 to 0.19).14 Models using more questionnaires showed smaller RMSEs and MAEs. Given that SWLS, FS, and SPANE can assess slightly different aspects of well-being and these scores complement each other, this finding is convincing. In contrast, models using subscales did not show any great improvement and indicated slightly higher RMSEs and MAEs than models using the total score. We speculate that subscales in each questionnaire offset each other because of their similarity. Statistically, a greater number of independent variables does not always improve results. Indeed, offsetting, rather than complementing, was observed in the model using subscales, because subscales within a questionnaire have equal contexts. In addition, our sensitivity analyses, which included socio-economic factors as additional independent variables, did not improve mapping function. Therefore, improvement along with a greater number of questionnaires regarding well-being may complement each other among questionnaires. Regarding R-squared, as described in our statistics section, while MAE and RMSE provide mapping function (for another dataset), R did not provide it.18 Therefore, we did not describe it to avoid confusion.
In addition to predictive validity, where errors were assessed, the contextual similarity among the questionnaires should be discussed as content validity. Given the focus of ICECAP-A on stability, attachment, autonomy, achievement, and enjoyment,10 in our estimation, the ICECAP-A score could be related more to FS (eudaimonia), than to SWLS (life evaluation well-being) and SPANE (affect).15–17 This is because the concept of eudaimonic well-being is developed based on eudaemonia, which includes the sense of achievement and of sufficiency, while the concept of affective well-being is developed based on a hedonic perspective.15–17,20 OECD guideline defines these three aspects (ie life evaluation, affect, and eudaimonia) as three encompassed elements, allowing multifaceted evaluation of well-being. In the multifaceted evaluation and interplay among these different aspects, we expected that ICECAP-A could be related more to FS than other scales from the perspective of content validity.19 In truth, FS had the highest correlation with ICECAP-A, although the difference was not significant compared to the correlations of the other two questionnaires (ie SWLS and SPANE-P) with ICECAP. Conversely, we found improvement of the mapping function upon using a greater number of questionnaires. This suggests that the score of ICECAP-A might contain eudaimonia as well as aspects of life evaluation and affect, although the focus of ICECAP-A is on stability, attachment, autonomy, achievement, and enjoyment.
Autonomy and achievement are mainly associated with FS, evaluating human functioning, such as a positive relationship and a purpose in life; achievement is mainly associated with SWLS, evaluating life satisfaction; and enjoyment is mainly associated with SPANE, evaluating emotional experiences.
Our sensitivity analyses revealed no impact of those available socio-economic factors on our mapping formula. Marital status, having children, income, and being unemployed are known as factors influencing well-being19 Here, it should be noted that the issue is with regard to whether these factors affect the relationship between ICECAP and each well-being scale, and not well-being itself. The score of each questionnaire has been already reflected in these factors. Our result suggests that our mapping formula may work regardless of socio-economic status, and it can still be useful for research where socio-economic data are insufficient.
Our present study has several limitations. First, it was difficult to predict lower values of ICECAP-A because the minimum mapped value was 0.10, while the actual minimum value was 0.00. Second, our mapping function was reasonable but not perfect, indicating that there were other factors that affected the ICECAP-A score aside from the three questionnaires used in this study. However, given that data are usually limited when mapping is required, our formula is reasonable from a practical perspective. Third, other demographic factors, such as marital status and employment, were not included because our mapping formula was developed for research with insufficient data and we predicted that such research had insufficient demographic data. In addition, although socio-economic factors, such as education, emotional distress, and physical conditions were not included, our sensitivity analyses revealed no impact of the available factors on our mapping formula Therefore, although exclusion of other factors raises a limitation, we believe our model is useful for such research because the score of each questionnaire has been already reflected in these factors. Finally, as discussed previously, the utility weighted by ICECAP-A in the study was derived from UK samples due to the unavailability of the tariff among Japanese samples. Given that the value of well-being should also correspond with the given culture of samples, one should be aware of such a limitation when applying this formula. Relatedly, the development of the ICECAP-A tariff among Japanese samples and the mapping formula based on it can be expected in the near future.
Conclusion
In conclusion, we developed several mapping formulae from questionnaires (SWLS, FS, and SPANE) to derive the utility assessed by ICECAP-A. These formulae were validated in our sample. When a study includes only well-being scores (eg, SWLS, FS, or SPANE), and does not include any data that can be used to calculate QALYs, our mapping formulae are useful. Researchers may choose the appropriate mapping formula depending on which questionnaire is included in their original research, allowing their health economic evaluation.
Abbreviations
ICECAP-A, the ICEpop CAPability measure for Adults; SWLS, Satisfaction with Life Scale; FS: Flourishing Scale; SPANE, Scale of Positive and Negative Experience; QALYs, quality adjusted life years; OECD, Organisation for Economic Co-operation and Development; MAE, mean absolute error; RMSE, root mean squared error.
Acknowledgments
This work was supported by Edoga Inc. The funding source had no role in the study design, data collection, management, analysis, interpretation of the data, or in the writing of the paper.
Disclosure
Prof. Dr. Masaru Mimura reports personal fees and/or grant from Byer Pharmaceutical, Daiichi Sankyo, Dainippon-Sumitomo Pharma, Fuji Film RI Pharma, Eisai, Eli Lilly, Hisamitsu Pharmaceutical, Janssen Pharmaceutical, Kyowa Pharmaceutical, Mochida Pharmaceutical, Mylan, MSD, Nihon Medi-physics, Nippon Chemipher, Novartis Pharma, Ono Yakuhin, Otsuka Pharmaceutical, Pfizer, Santen Pharmaceutical, Shire Japan, Takeda Yakuhin, Tsumura, Yoshitomi Yakuhin, Shionogi, and Tanabe Mitsubishi, outside the submitted work. The author reports no other conflicts of interest in this work.
References
1. Husereau D, Drummond M, Petrou S, et al. ISPOR health economic evaluation publication guidelines-CHEERS good reporting practices task force. Consolidated Health Economic Evaluation Reporting Standards (CHEERS)--explanation and elaboration: a report of the ISPOR health economic evaluation publication guidelines good reporting practices task force. Value Health. 2013;16(2):231–250.
2. Gafni A, Birch S. Incremental cost-effectiveness ratios (ICERs): the silence of the lambda. Soc Sci Med. 2006;62(9):2091–2100.
3. Drummond MF, Sculpher MJ, Torrance G, et al. Methods for the Economic Evaluation of Health Care Programmes.
4. Tsuchiya A, Williams A. Welfare economics and economic evaluation. In: Drummond M, McGuire A, editors. Economic Evaluation in Health Care: Merging Theory with Practice. New York: Oxford University Press; 2001:22–45.
5. EuroQol G. EuroQol--A new facility for the measurement of health-related quality of life. Health Policy. 1990;16:199–208.
6. Flynn TN, Huynh E, Peters TJ, et al. Scoring the Icecap-A capability instrument. Estimation of a UK general population tariff. Health Econ. 2015;24(3):258–269. doi:10.1002/hec.3014
7. Oliver A, Healey A, Donaldson C. Choosing the method to match the perspective: economic assessment and its implications for health-services efficiency. Lancet. 2002;359(9319):1771–1774.
8. Coast J. Is economic evaluation in touch with society’s health values? BMJ. 2004;329(7476):1233–1236.
9. Ryan M, Netten A, Skåtun D, Smith P. Using discrete choice experiments to estimate a preference-based measure of outcome--an application to social care for older people. J Health Econ. 2006;25(5):927–944.
10. Al-Janabi H, Flynn T, Coast J. Development of a self-report measure of capability wellbeing for adults: the ICECAP-A. Qual Life Res. 2012;21:167–176.
11. Sen A. Inequality Reexamined. New York: Russell Sage Foundation; 1992.
12. Sen A. Capability and well-being. In: Nussbaum MC, editor. The Quality of Life. Oxford: Clarendon Press; 1993.
13. Ryff CD. Psychological well-being revisited: advances in the science and practice of eudaimonia. Psychother Psychosom. 2014;83:10–28.
14. Diener E, Lucas RE, Oishi S. Advances and open questions in the science of subjective well-being. Collabra Psychol. 2018;4(1):15.
15. Keyes CL, Shmotkin D, Ryff CD. Optimizing well-being: the empirical encounter of two traditions. J Pers Soc Psychol. 2022;82:1007–1022.
16. Diener E, Emmons RA, Larsen RJ, Griffin S. The satisfaction with life scale. J Pers Assess. 1985;49(1):71–75.
17. Diener E, Tov W, Kim-Prieto C, Choi D, Oishi S, Biswas-Diener R. New well-being measures: short scales to assess flourishing and positive and negative feelings. Soc Indic Res. 2010;97:143–156.
18. Brazier JE, Yang Y, Tsuchiya A, Rowen DL. A review of studies mapping (or cross walking) non-preference based measures of health to generic preference-based measures. Eur J Health Econ. 2010;11(2):215–225.
19. OECD. OECD Guidelines on Measuring Subjective Well-Being. Paris: OECD Publishing; 2013.
20. Sirgy MJ. Positive balance: a hierarchical perspective of positive mental health. Qual Life Res. 2019;28(7):1921–1930.
 © 2022 The Author(s). This work is published and licensed by Dove Medical Press Limited. The
full terms of this license are available at https://www.dovepress.com/terms
and incorporate the Creative Commons Attribution
- Non Commercial (unported, 3.0) License.
By accessing the work you hereby accept the Terms. Non-commercial uses of the work are permitted
without any further permission from Dove Medical Press Limited, provided the work is properly
attributed. For permission for commercial use of this work, please see paragraphs 4.2 and 5 of our Terms.
© 2022 The Author(s). This work is published and licensed by Dove Medical Press Limited. The
full terms of this license are available at https://www.dovepress.com/terms
and incorporate the Creative Commons Attribution
- Non Commercial (unported, 3.0) License.
By accessing the work you hereby accept the Terms. Non-commercial uses of the work are permitted
without any further permission from Dove Medical Press Limited, provided the work is properly
attributed. For permission for commercial use of this work, please see paragraphs 4.2 and 5 of our Terms.