Back to Journals » International Journal of Nanomedicine » Volume 14
Formulation design, characterization, and in vitro and in vivo evaluation of nanostructured lipid carriers containing a bile salt for oral delivery of gypenosides
Authors Yang G, Wu F, Chen M, Jin J, Wang R ![]() , Yuan Y
, Yuan Y
Received 16 November 2018
Accepted for publication 9 February 2019
Published 1 April 2019 Volume 2019:14 Pages 2267—2280
DOI https://doi.org/10.2147/IJN.S194934
Checked for plagiarism Yes
Review by Single anonymous peer review
Peer reviewer comments 2
Editor who approved publication: Dr Linlin Sun
Gang Yang, Feihua Wu, Minyan Chen, Jian Jin, Rong Wang, Yongfang Yuan
Department of Pharmacy, Shanghai 9th People’s Hospital, Shanghai Jiao Tong University School of Medicine, Shanghai 200011, China
Background: Gypenosides (GPS) have been used as traditional medicine for centuries with various pharmacological effects. However, its therapeutic effects were restricted owing to the poor lipid and water solubility and low absorption. This study aimed to develop nanostructured lipid carriers (NLCs) containing a bile salt formulation (sodium glycocholate, SGC) for GPS, and to evaluate the potential of the GPS-SGC-NLCs as an oral delivery system.
Methods: The preparation of GPS-SGC-NLCs was investigated using a single-factor test and a central composite design of response surface methodology. In vitro release and pharmacokinetics studies were used to evaluate the dissolution and bioavailability of GPS. Furthermore, In vivo imaging and in situ intestinal perfusion studies were performed to investigate the absorption of the preparations in the gastrointestinal tract.
Results: The optimised formulation yielded nanoparticles with an approximate diameter of 146.7 nm, polydispersity of 0.137, zeta potential of -56.0 mV, entrapment efficiency of 74.22% and drug loading of 4.89%. An in vitro dissolution analysis revealed the sustained release of contents from GPS-SGC-NLCs over 48 h with 56.4% of the drug released. A pharmacokinetic analysis revealed an 8.5-fold increase of bioavailability of the GPS-SGC-NLCs compared with GPS powder. In vivo imaging and in situ intestinal perfusion studies showed that SGC-NLCs could significantly increase the absorption of GPS in intestinal tract. In vitro cytotoxicity evaluated using Caco-2 cells demonstrated that GPS-SGC-NLCs decrease the cytotoxicity of the drug.
Conclusion: The SGC-NLC formulation can significantly improve the absorption of GPS, which provides an effective approach for enhancing the oral absorption of drugs.
Keywords: gypenosides, nanostructured lipid carriers, bile salt, in vitro release, bioavailability
Introduction
Gypenosides (GPS) are the major components in the extracts of Gynostemma pentaphyllum. They are used extensively as a traditional Chinese medicine for a long time. GPS is a bioactive component with various pharmacological properties and beneficial clinical effects on conditions including hyperlipoproteinemia,1 cancer,2–4 hepatitis,5 and cardiovascular disease.6 However, like other saponins, GPS are easily degraded due to their sensitivity to environmental factors, such as heat, light, and oxygen and are limited in their bioavailability and clinical applications owing to their poor lipid and water solubilities and hemolytic properties. Recent studies have focused on strategies to enhance the stability and bioavailability of GPS, which include the use of microcapsules and liposomes.7,8
Nanoparticles composed of biocompatible lipids have become an attractive option for the transport of insoluble drug.9 Solid lipid nanoparticles (SLNs) and nanostructured lipid carriers (NLCs) are typical of lipid nanoparticles. SLNs comprise solid lipids; their unique advantages include good biodegradability and biocompatibility, high bioavailability, improved solubility, good stability, and drug-releasing properties.10 NLCs are second-generation SLNs that comprise a combination of spatially different phospholipids. A mix of solid and liquid lipids in NLCs might overcome the limitations of SLNs, allowing the packaging of more drug molecules, thereby minimizing drug leakage during storage and modulating drug release due to the varied lipid matrix.11,12 Nevertheless, the use of lipid nanoparticles for oral delivery may be impeded by the necessity of passage through the gastrointestinal tract. The low pH and presence of lipases and, in particular, bile salts can destabilize lipid nanoparticles.13–15 Over the past decade, studies have certified the advantage of the inclusion of bile salts in promoting the absorption of poorly absorbable drugs and enhancing the stability and performance of oral drugs.16–18 On the one hand, the addition of bile salts to a nanoparticle preparation can stabilize the lipid structure and prevent it from being damaged by physiological bile salts of the gastrointestinal system.19 On the other hand, it can improve the passage of drug molecules across the cytoplasmic membrane to enhance the oral bioavailability of drugs.20
Therefore, this study was brought out with a purpose to optimize the formulation of GPS to enhance its dissolution and bioavailability. GPS-loaded lipid nanocarriers containing a bile salt (sodium glycocholate, SGC) were prepared and the preparation conditions for the GPS-SGC-NLCs were optimized by single-factor test and response surface methodology. Polydispersity index (PDI), particle size, encapsulation efficiency (EE), drug loading, and other parameters were evaluated. In addition, both dissolution in vitro and pharmacokinetics in vivo were studied to investigate the oral bioavailability of GPS. To demonstrate the pharmacokinetic results, in vivo imaging and in vivo intestinal perfusion experiments were carried out to observe the absorption of preparations in the gastrointestinal tract. Finally, the intestinal toxicity was determined by a cell viability experiment.
Materials and methods
Materials
GPS (purity >98%) was obtained from Shanghai Yuanye Biotech Co, Ltd (Shanghai, People’s Republic of China). SGC was provided by Sinopharm Chemical Reagent Co, Ltd (Shanghai, People’s Republic of China). Polysorbate 80 (Tween 80®) and glycerol monostearate (GMS) were obtained from the China National Pharmaceutical Group Corporation (Shanghai, People’s Republic of China). Soybean lecithin (Lipoid S 100) was supplied by Lipoid GmbH (Ludwigshafen, Germany). Oleoyl macrogolglycerides (Labrafil M1944 CS®) and glyceryl monolinoleate (Maisine 35-1®) were obtained from Gattefosse France (Gennevilliers, France). 3-(4,5-dimethylthiazol-2-yl)-2,5-diphenyltetrazoliumbromide (MTT) was provided by Shanghai Usen Biotechnology (Shanghai, People’s Republic of China). All other chemicals were purchased from Sinopharm Chemical Reagent (Shanghai, People’s Republic of China) and were high-performance liquid chromatography (HPLC) or analytical grade.
Animals and cell lines
Male Wistar rats weighing 250±10 g were used for in vivo experiments. The experiments were conducted in accordance with the Principles of the Animal Care, and ethical approval was obtained from the institutional review board of the Experiment Committee of Ninth People’s Hospital, affiliated with Shanghai Jiao Tong University School of Medicine before the initiation of the study. All the animals were provided by the university’s Laboratory Animal Center and were maintained at the hospital’s Animal Research Center. The animals were housed in standard cages at 25°C±2°C and 70%±5% relative humidity under natural conditions and were fed with food and water ad libitum before the start of the study. The Caco-2 cell line was provided by the Chinese Academy of Medical Sciences (Beijing, China).
HPLC analysis
GPD quantitative determinations were performed by using the HP 1260 HPLC system (Agilent Technologies, Inc., Santa Clara, CA, USA) with a reverse-phase Diamonsil® Plus C18 column, (250×4.6 mm, 5 mm; Dikma Technologies, Foothill Range, CA, USA). The mobile phase consisted of acetonitrile and pure water (35:65, v/v) at a flow rate of 1.0 mL/min. The column temperature was maintained at 30°C and the effluent was monitored at 203 nm. Quantified samples were filtered through a 0.45-mm filter membrane prior to automatic injection into the HPLC system.
Preparation of GPS-SGC-NLCs
A hot melting, high-pressure, homogenization method was employed for the production of GPS-SGC-NLCs.21,22 In brief, aqueous and oil phases were prepared separately. The lipids consisted of a mixture of liquid (Labrafil M1944 CS and Maisine 35-1) and solid lipids (GMS) and were maintained in a water bath at 65°C to prevent the recrystallization of lipids during the process until they were totally melted. The same-temperature aqueous phase (GPS, SGC, Tween 80, and soybean lecithin in purified water) was then slowly added to the oil phase at a constant rate with high-speed mixing using an Ultra Turrax T25 device (IKA, Staufen, Germany). This pre-emulsion was homogenized using a model NS1001 L high-pressure homogenizer (GEA, Parma, Italy). To solidify the lipid matrix and form GPS-SGC-NLCs, the obtained sample was cooled in an ice bath. For comparison, GPS-NLCs preparations were prepared using the same method with the exclusion of SGC.
Experimental design
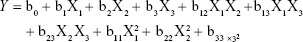
The central composite design (CCD), a popular template for response surface methodology, was used to explore the effects of independent variables on various dependent variables using Design Expert software (Version 8.0.6; Stat-Ease, Minneapolis, MN, USA). The three independent variables were the total lipid concentration (solid and liquid lipids, X1), the ratio of liquid lipid to total lipid (X2), and the surfactant concentration (X3). The parameters and their levels are described in Table 1. Each variable was coded at the levels corresponding to the preliminary study results. This scheme produced 20 experimental points that were characterized by the dependent variables of particle size, EE, and drug loading (DL). The relationship between variables and response was analyzed by the following nonlinear quadratic model:
|
|
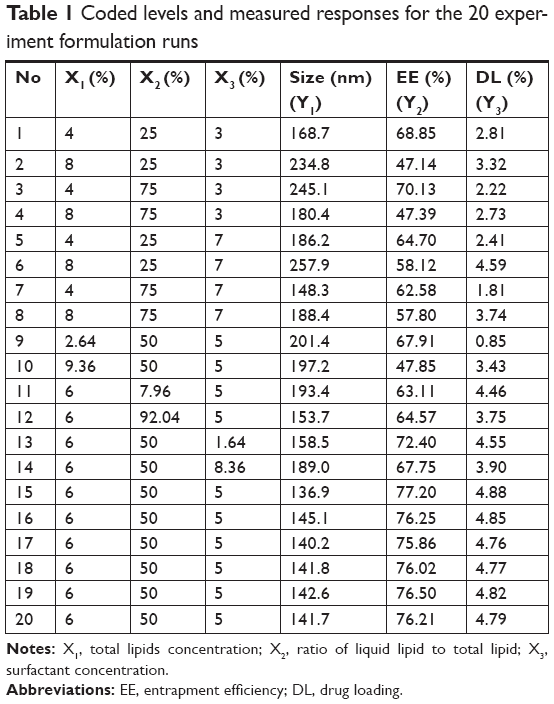 | Table 1 Coded levels and measured responses for the 20 experiment formulation runs |
where Y is the response of dependent variable associated with each factor level combination, expressed in terms of the particle size, EE, and DL for the formulation variables; b0 is an intercept; and b1 to b33 are the regression coefficients of respective variables.
The P-values associated with the regression coefficients were used to gauge the correlation of the factors on the response. Analysis of variance and the predicted R2 value were provided to determine the suitability of the model.
Characterization of NLC dispersion
Mean particle size, PDI, and zeta potential of samples were determined using a Nano ZS90 Zetasizer (Malvern Instruments Ltd, Worcestershire, UK). NLCs were diluted with an appropriate volume of distilled water before measuring. Particle size was evaluated using volume distribution. The zeta potential was calculated using the Smoluchowski equation. Each measurement was carried out in triplicate and standard deviations were calculated.
Ultrafiltration was used to estimate the EE and DL of NLCs by separating the free GPS and lipids from the aqueous medium.23 A volume of 0.5 mL of each drug-loaded sample was centrifuged in a centrifugal filter tube (10 kDa; Pall Corporation, Port Washington, NY, USA) at 10,000 rpm for 20 minutes to separate the lipid and aqueous phases. The free drug was separated from the drug encapsulated in the NLCs and collected at the bottom of the centrifuge tube through the membrane. The total and separated drug contents were measured using HPLC, and the EE and DL were mathematically calculated using the following equations:
|
|
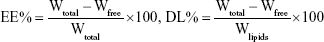
where Wfree and Wtotal are the weight of untrapped drug and total drug, respectively, and Wlipids is the weight of lipids in NLCs.
Transmission electron microscopy (TEM) was performed using a JEM-1230 apparatus (JEOL, Tokyo, Japan) to determine the shape and physical appearance of the negatively stained preparations of NLCs. Initially, each sample was diluted with appropriate volume of distilled water and a drop was added to a film-coated copper grid (Zhong Jing Ke Yi Technology Inc., Beijing, China) and air dried for about 20 minutes. The sample then received a drop of 2% aqueous solution of sodium phosphotungstic acid for contrast enhancement and was allowed to dry before TEM observation.
Differential scanning calorimeter (DSC) (Q2000; New Castle, DE, USA) was used to analyze the thermal behaviors of the NLCs. Samples (5–10 mg) were accurately weighed in a specialized aluminum pan with a pinhole. DSC scans were made with a heating rate of 10°C/min and range of 30°C–300°C. An empty pan was used as the reference.
X-ray diffraction (XRD) analysis of NLCs were performed using a model D8 ADVANCE X-ray diffractometer (Bruker, Hamburg, Germany) in which Cu-Ka radiation was employed as the source of X-rays at an operating voltage of 40 kV and electricity setting of 30 mA. Samples were scanned over the range of 3°–50° 2θ at a scanning rate of 5°/min and a step size of 0.02°.
Accelerated stability studies of NLCs were carried out at 0, 1, 2, 3, and 6 months to compare the changes in particle size and EE over time at a temperature of 40°C±2°C and relative humidity of 75%±5%.
In vitro dissolution
Release studies were performed to evaluate the in vitro drug release pattern using the dialysis bag technique.24 The dialysis bag with a molecular weight cutoff of 14 kDa (Pall Corporation, Port Washington, NY, USA) was soaked in release medium for 12 hours before use. Five milliliters of each test formulation was individually put in a dialysis bag that was firmly tied. They were then immersed in 100 mL of phosphate buffered solution (pH 6.8) containing 20% (v/v) polyethylene glycol 400 and maintained at 37°C±0.5°C with stirring at 100 rpm. At each sampling time point, 1 mL was withdrawn and the volume was replenished with the same volume of fresh medium. The samples were filtered through a 0.45-mm membrane and analyzed using HPLC. All experiments were performed in triplicate.
In vivo pharmacokinetics
Male Wistar rats (250±10 g) were fasted overnight before administration. They were allowed drinking water ad libitum. Rats were randomly divided into three groups of six rats each and randomized to the treatment. One group of rats was treated orally with a suspension of GPS powder prepared by adding GPS to purified water. The second group was treated orally with GPS-NLCs. The third group received GPS-SGC-NLCs orally. All rats were administered 20 mg/kg GPS equivalent. At predetermined time intervals, blood samples (0.4 mL) were collected from the orbit of eyes into heparinized tubes. Plasma was separated from each blood sample by centrifugation at 5,000 rpm for 10 minutes in a microcentrifuge (Eppendorf, Hamburg, Germany) and stored at −20°C until analyzed.
Pharmacokinetic parameters were calculated by a model-independent method, using the DAS 2.1.1 computer program (supplied by the State Food and Drug Administration of China for pharmacokinetic study). Maximum concentration (Cmax), time of Cmax (Tmax), and mean residence time (MRT) were determined from the raw data. Area under the curve to the last measurable concentration (AUC0–t) was estimated by the linear trapezoidal rule.
In vivo optical imaging study
Fluorescence (Cy5.5 NHS)-loaded SGC-NLCs were prepared according to the preparation method of GPS-SGC-NLCs away from light, using Cy5.5 NHS instead of GPS. In vivo imaging method was performed to study the drug distribution in gastrointestinal tract after oral administration of fluorescence solution, NLCs, and SGC-NLCs. BALB/c nude mice were orally given 0.1 mL/10 g (concentration of 10 mM/mL) Cy5.5 NHS equivalent, and they were then anesthetized immediately by inhaling 4% isoflurane-oxygen. The in vivo fluorescence images were studied at 0.5, 1, 2, 4, 6, and 8 hours after oral administration using the Caliper IVIS Imaging System (Lumina XR; Perkin Elmer, Waltham, MA, USA) with excitation of 678 nm and emission 695 nm (Cy5.5 NHS). All fluorescence images were conducted with an exposure time of 60 ms and presented at the same fluorescent intensity.
Intestinal perfusion study
Male Wistar rats were fasted for 18 hours prior to the start of the experiment with free drinking. Rats were then narcotized by injecting 3.5% chloral hydrate solution (10 mL/kg) into the abdominal cavity and immobilized. All the animals were placed on a heated pad at 37°C during the surgery and throughout in situ intestinal perfusion. Later, the enterocoelia was cut for approximately 3 cm along the ventrimeson, and a tube was inserted in the operative incision of both ends of the intestinal segment to be investigated, which were ligated and fixed. The intestinal segment was washed with homothermal saline to remove the contents at a flow rate of 5 mL/min and finally the cannula was connected to the perfusion instrument. Then, the perfusion solution (37°C) was transfused with a flow rate of 0.25 mL/min for 90 minutes. The perfusion solution was collected every 15 minutes using centrifuge tubes with known weight in the outlet. After the experiments were finished, the animals were sacrificed by anesthetic (urethane). The intestinal segments were cut off and their length and radius were measured.
Apparent absorption coefficient (Papp) of GPS was calculated from the constant concentration of the preparations in the perfusion solution collected after correction for net water flux. Papp was calculated using the following equation:
|
|
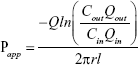
where Qin and Qout are the volume of the inlet and outlet perfusates, respectively; Cin and Cout are the drug concentrations of the inlet and outlet perfusates, respectively; Q is the flow rate; l and r are the length and radius of the intestine, respectively.
In vitro cytotoxicity
The human colon adenocarcinoma cell line, Caco-2 cells, have features similar to the absorptive intestinal cells, such as microvilli, the carrier-mediated transport systems, and paracellular transport through the tight junctions.25 Therefore, the Caco-2 cells were used to study the effect of different concentrations of GPS powder suspension, blank NLCs, GPS-NLCs, GPS-SGC-NLCs, and empty vehicles on cell toxicity. Viability was determined using MTT assay.26 Caco-2 cells were seeded at 4×10³ cells/well into 96-well culture plates and incubated at 37°C for 24 hours before the assay. Cells in the wells were treated with various concentrations of test solutions. After a 24-hour incubation, 20 mL MTT was added to each well and the cells were incubated for another 4 hours. After removing the culture medium, 200 mL of dimethylsulfoxide was added to dissolve the insoluble formazan that had formed. The plate was then shaken for 10 minutes in the dark and the absorbance was measured at 570 nm using a microplate reader (Biotek Synergy HT; Gene Company Limited, Hong Kong, China). All determinations were performed in triplicate.
Statistical analysis
Data are expressed as mean ± standard deviation. Statistical data were analyzed by multivariate linear regression for uniform design experiments, and comparisons were made with one-way analysis of variance using SPSS software (v 19.0; IBM Corporation, Armonk, NY, USA). A P-value <0.05 was considered statistically significant.
Results and discussion
Preparation of the GPS-SGC-NLCs
The stirring power (Watts), stirring time (min), homogenization pressure (bar), and homogenization cycle were the factors that were evaluated to optimize the preparation of the GPS-SGC-NLCs, with the particle size and PDI as the indexes. Stirring power had no apparent effect on particle size and PDI (Figure 1). As stirring time, homogenization pressure, and homogenization cycle increased, the particle size was initially reduced followed by a slight increase. It was previously reported that the stability of the preparation system decreases with an increase in the homogenization pressure and homogenization cycle, resulting in increased kinetic energy.27 Therefore, the production parameters were set as follows: stirring power, 6,000 Watts; stirring time, 6 minutes; homogenization pressure, 800 bar; and eight homogenization cycles.
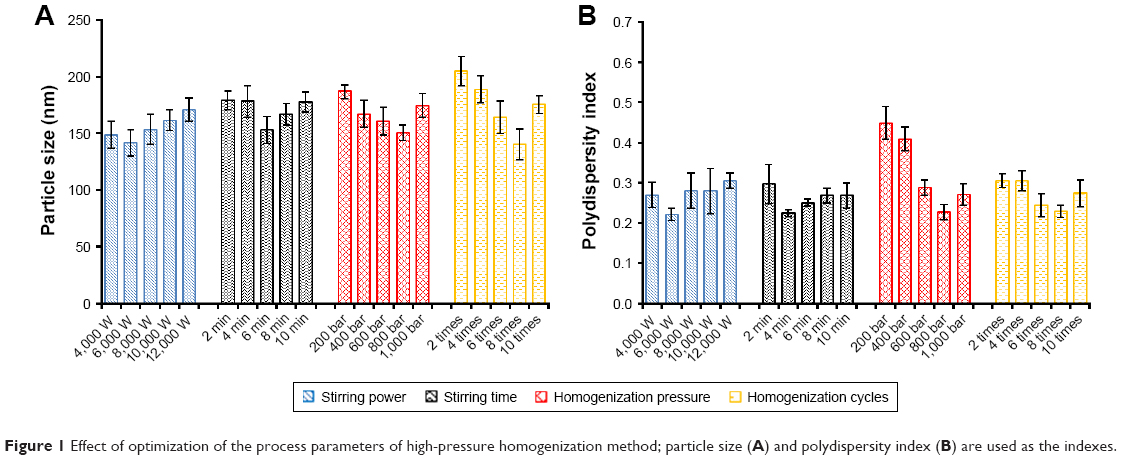 | Figure 1 Effect of optimization of the process parameters of high-pressure homogenization method; particle size (A) and polydispersity index (B) are used as the indexes. |
Design of experiment
Response data for all experiments are given in Table 1 and the three-dimensional response surface graphs for the most statistically significant variables on the evaluated parameters are shown in Figure 2. The polynomial equations that were generated explained the individual main effects and interaction effects of independent factors on each dependent variable using the aforementioned software.
 | Figure 2 Response surface models showing the influence of the factors on the responses. |
To develop the model, the coefficients related to the independent variables with significant t-values (P<0.05) were used. A lower P-value indicated a higher significant effect of the independent variables on the responses.28 The model was further developed with only significant items. The predicted R2 value of Y1, Y2, and Y3 were 0.8559, 0.9632, and 0.9537, respectively. This indicated that 85.6%, 96.3%, and 95.4% of the variation were attributed to the independent variable. The predicted optimum ranges of the independent variables (Table 2) showed that the experimental values were very close to the predicted values, with low percentage bias, suggesting that the optimized formulation was reliable and reasonable.
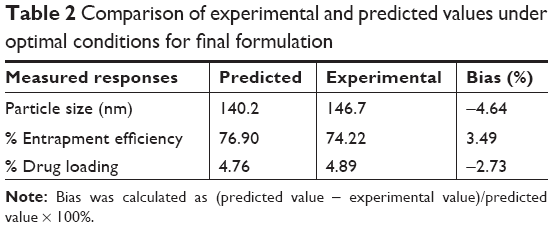 | Table 2 Comparison of experimental and predicted values under optimal conditions for final formulation |
According to the regression coefficients calculated for the experimental data, the relationship between the variables and particle size (Y1) was represented by the following equation:
|
|
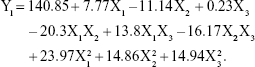
As represented in Figure 2A and as calculated by the Y1 equation, the effect of the factor levels on particle size was significantly influenced by the total lipid concentration (X1) and the ratio of liquid lipid to total lipid (X2), with large coefficients (7.77 and −11.14). This suggested that the particle size increased as the lipid concentration increased. The result could be due to the fact that molecule dispersing rate was reduced by raising the viscosity of system.29 Furthermore, with the increase of lipid concentration, the collision and aggregation of particles would add which led to the increase of particle size.30 However, the system has an optimum range of lipid concentration. At low concentrations, particle sizes decrease with increasing lipid concentration until attaining a minimum limit. In addition, the particle size decreases with an increase in the ratio of liquid lipid to total lipid. This may have occurred due to the low viscosities of Labrafil M1944 CS and Maisine 35-1, which can control the rising viscosity of the lipid phase. Thus, increasing the liquid lipid content decreased the inner viscosity of the particles.
The model that describes the relationship between the independent variables and EE (Y2) can be represented by equation (4):
|
|
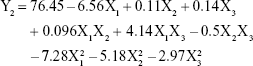
From this equation and Figure 2B, it is evident that the total lipid concentration (X1) had a negative coefficient (−6.56) with a primary influence, with a higher lipid concentration leading to a lower EE. In contrast, EE increased with increasing surfactant concentration. Similar results have been reported by other researchers.31,32 The findings have been attributed to the efficient loading retention of drug molecules within the lipid matrix or at the surface of NLCs at higher surfactant concentration.
The equation in term of independent variables for responses DL (Y3) is given in equation (5):
|
|
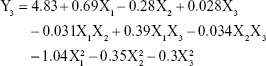
From this equation and Figure 2C, it is evident that DL of NLCs was strongly influenced by the total lipid concentration and ratio of liquid lipid to total lipid, indicating the importance of lipid in determining drug loading. As the total lipid concentration increased, the DL also increased initially and then decreased with further increase in the concentration of the lipids. This might be because when the concentration of lipids is low, more drugs would be packaged with increasing lipid concentrations, while a high concentration of lipid might reduce the ratio of drug to lipids. The ratio of liquid lipid to total lipid positively influenced DL (0.28). This implies that the addition of liquid lipid to the solid lipid in NLCs causes distortion of crystalline structure of the lipid, which favors higher DL.31
Particle size and zeta potential
Particle size and zeta potential data of the optimized formulation are shown in Figure 3. GPS-SGC-NLCs were nanometric and unimodal with a relatively narrow size distribution (PDI =0.137±0.011) and an average diameter of 146.7±6.8 nm (Figure 3A). Lower particle size of nanoparticles could make the suspension clearer, which is considered as an advantage of oral liquid formulations. Furthermore, smaller particles and lower PDI would decrease settling rate which could remain suspended in a solution.33 Zeta potential could reflect the stability of a colloidal system to some extent. GPS-SGC-NLCs possessed a high zeta potential (−56.0±3.4 mV), which indicated that the nanoparticles were very stable (Figure 3B). This is likely because particles repel each other, thereby lessening the tendency of aggregation.34
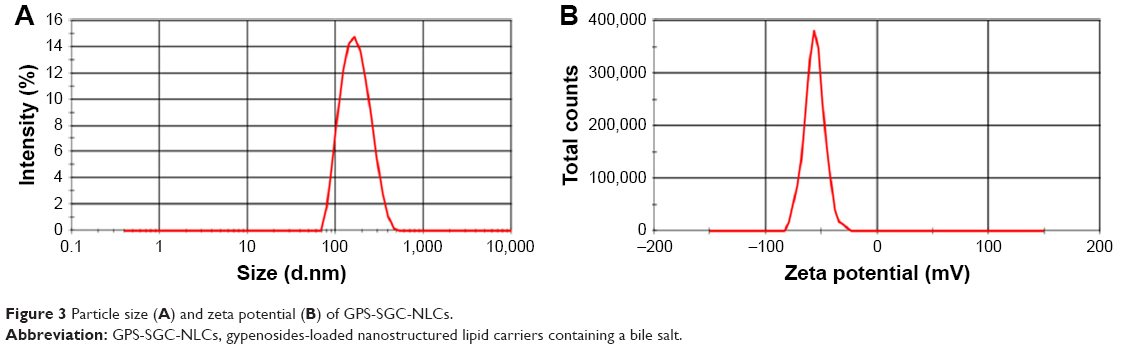 | Figure 3 Particle size (A) and zeta potential (B) of GPS-SGC-NLCs. |
Morphological imaging
TEM revealed that most of the GPS-SGC-NLCs were spheroidal with uniform distribution (Figure 4), which corroborated the particle size measurements.
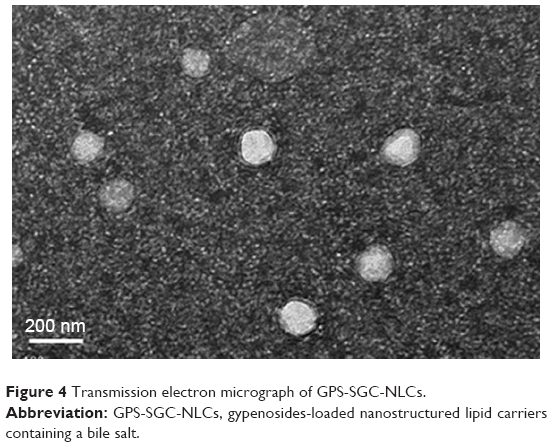 | Figure 4 Transmission electron micrograph of GPS-SGC-NLCs. |
DSC study
DSC is a basic method to investigate the crystallization or amorphous state of drugs and NLCs by confirming the change of energy and temperature at phase transformation.35 DSC thermogram data (Figure 5) revealed that the cryoprotectant (mannitol) reached an endothermic peak with a high intensity of approximately 167.13°C, which was exactly the same melting point of mannitol. GPS and GMS reached endothermic peaks at 166.67°C and 57.15°C, respectively. SGC displayed a melting point of 257.62°C. The DSC analysis revealed no relocation of the peaks in the physical mixture (composed of mannitol, GPS, SGC, and GMS), where the characteristic melting points of the samples were almost unchanged, except for the increase or decrease of the endothermic peak areas. This may have been due to the rise in the molten state of the partial bulk drug in the solid lipids as the temperature rose, which would have led to changes in the crystalline structure. However, the endothermic peaks of GPS and SGC were not observed in NLCs, which suggested that the drug was dispersed in the nanoparticles in a noncrystalline state.
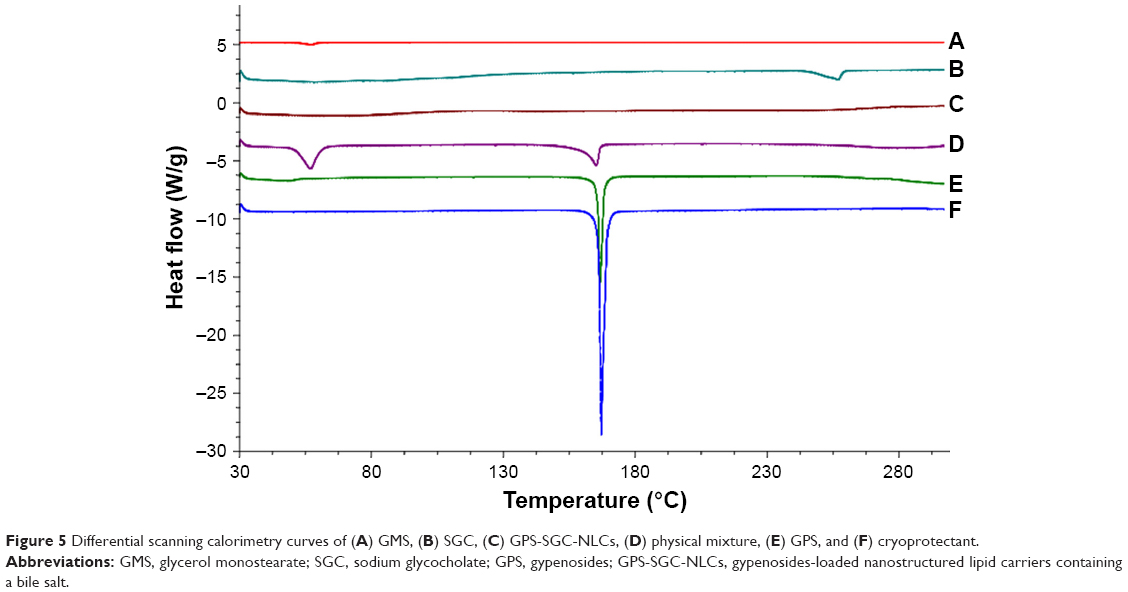 | Figure 5 Differential scanning calorimetry curves of (A) GMS, (B) SGC, (C) GPS-SGC-NLCs, (D) physical mixture, (E) GPS, and (F) cryoprotectant. |
XRD study
XRD was carried out with the support of DSC to verify the reduction in the crystalline nature of GPS in the prepared formulation. XRD of cryoprotectant, GPS, SGC, GMS, the physical mixture, and the GPS-SGC-NLCs is shown in Figure 6. There were several diffraction peaks associated with the diffraction pattern of cryoprotectant (10.329°, 14.816°, 18.867°, and 23.735°), SGC (14.769° and 15.728°), and GMS (5.593°, 19.686°, 22.618°, and 23.694°). The characteristic main peaks for these were absent in the XRD pattern of the formed NLCs. The findings indicated partial recrystallization with the formation of less-ordered crystals. GPS displayed intensely sharp peaks at 2θ values of 13.873°, 17.457°, 19.941°, 20.826°, and 21.688°, indicating the crystalline nature of GPS. However, these peaks disappeared in NLCs, suggesting that drug in NLCs may occur in an amorphous state. For the physical mixtures, the XRD pattern showed a number of different peaks that were retained from cryoprotectant, GPS, SGC, and GMS. These XRD results agreed with the DSC results.
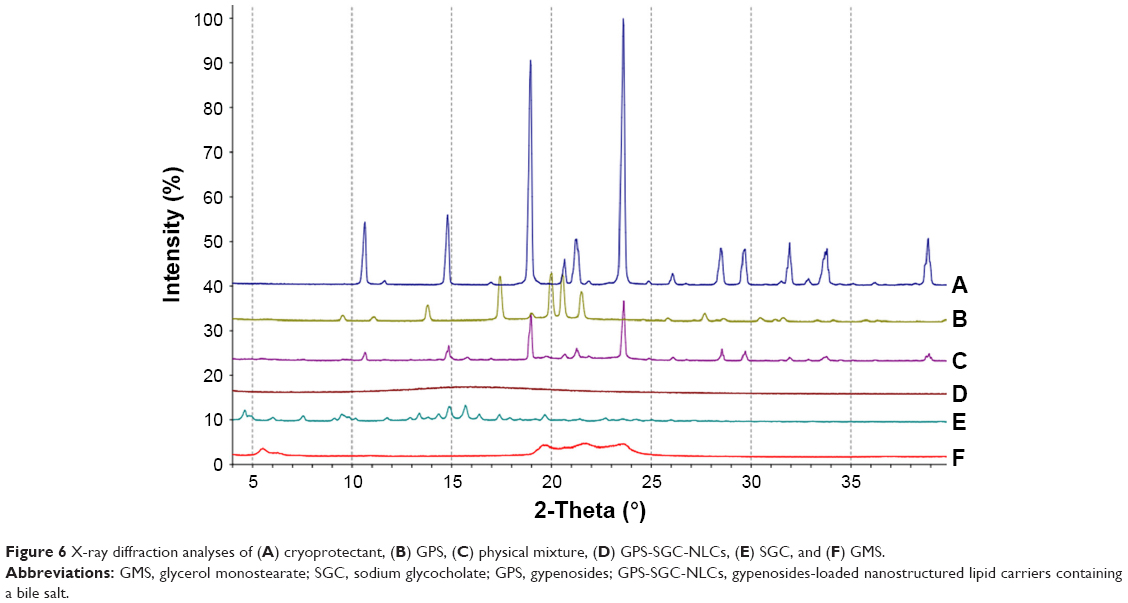 | Figure 6 X-ray diffraction analyses of (A) cryoprotectant, (B) GPS, (C) physical mixture, (D) GPS-SGC-NLCs, (E) SGC, and (F) GMS. |
Accelerated stability studies
The results of stability studies are depicted in Table 3. The particle size and EE of GPS-NLCs and GPS-SGC-NLCs did not change significantly following storage for 6 months, which indicated that they existed in the stable state. In addition, the larger change of GPS-SGC-NLCs compared with GPS-NLCs may due to the presence of SGC, which could slightly affect the structure of NLCs with a few drug leakage. On the whole, it showed a very little effect on stability.
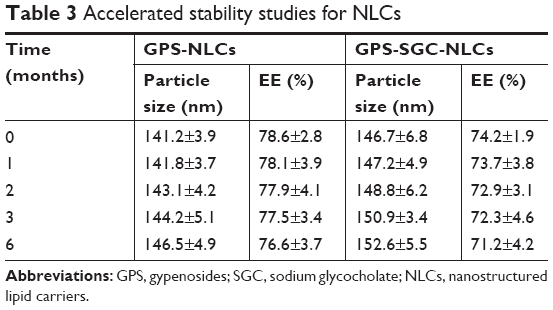 | Table 3 Accelerated stability studies for NLCs |
In vitro dissolution
The release profiles of drug powder suspension, GPS-NLCs, and GPS-SGC-NLCs through the dialysis bag in phosphate buffered solution (pH 6.8) are presented in Figure 7. The release in the GPS powder group was much faster than that in the GPS-NLCs and GPS-SGC-NLCs with 29.4% of drug released within 6 hours. In contrast, only 25.6% and 23.1% of GPS were released from GPS-NLCs and GPS-SGC-NLCs within 6 hours, respectively. After 48 hours, more than 50% of drug was released from GPS-NLCs and GPS-SGC-NLCs into the dissolution medium, while only 32.2% of GPS was released from the drug powder suspension.
 | Figure 7 In vitro release of GPS, GPS-NLCs, and GPS-SGC-NLCs in phosphate buffered solution (pH =6.8). |
The slower rate of drug release from NLCs was due to the lipid layer that inhibits the diffusion of GPS out of the NLCs. The higher cumulative dissolution rate of NLCs was most likely due to the disordered crystalline state of the drug that exhibited higher solubilization and was selected for nanoparticle formation.36 Furthermore, GPS-SGC-NLCs were more soluble than GPS-NLCs due to the solubilization effect of the bile salt. Thus, GPS-SGC-NLCs enhanced the sustained and efficient release of GPS compared to GPS powder suspension and GPS-NLCs.
Pharmacokinetics
The pharmacokinetic parameters in rats after oral administration of GPS powder suspension, GPS-NLCs, and GPS-SGC-NLCs at same dose are summarized in Table 4. The plasma concentration–time profiles are illustrated in Figure 8. As shown in Table 4, the absorption of GPS powder suspension (Tmax =0.792 hour) was shorter than that of GPS-NLCs (Tmax =1.417 hour) and GPS-SGC-NLCs (Tmax =2.250 hour), suggesting that GPS powder suspension was absorbed more rapidly than NLCs, with GPS-SGC-NLCs displaying the longest absorption. A similar variation trend was also observed in MRT (GPS powder =6.224 hour, GPS-NLCs =11.832 hour, and GPS-SGC-NLCs=21.589 hour). Compared to the GPS powder formulation, the GPS-NLCs increased the Cmax by 1.5-fold and the AUC by 3.4-fold, while GPS-SGC-NLCs increased the Cmax and AUC by approximately 1.9- and 8.5-fold, respectively.
 | Table 4 Pharmacokinetic parameters of the three formulations (n=6) |
 | Figure 8 In vivo plasma concentration–time profiles. Levels of GPS following oral administration of GPS powder suspension, GPS-NLCs, and GPS-SGC-NLCs (n=6). |
The results of Tmax and MRT indicate that the drug in GPS-SGC-NLCs remains in circulation for a significantly longer period of time. This may be due to the nanosized architecture of the bile salt–containing carrier system that features the slow release of GPS. Other possible mechanisms include that the incorporation of bile salts in lipid structure could stabilize the NLCs against the detrimental effects of physiological bile acids in the gastrointestinal tract. The stabilizing effect might extend the resident time of GPS-SGC-NLCs in the gastrointestinal tract,18 resulting in longer Tmax and MRT compared with that of GPS powder suspension and GPS-NLCs. The data of Cmax and AUC revealed that both the GPS-NLCs and GPS-SGC-NLCs have enhanced the oral absorption of GPS compared with GPS suspension. However, the GPS-SGC-NLCs have a better effect in improving the bioavailability of GPS. The improved oral bioavailability of GPS with GPS-SGC-NLCs may be attributed to the NLCs containing a bile salt. It was reported that the oral absorption occurred from the interaction with bile acid transporter (ASBT) in the intestine as well as the increased transcellular activity throughout the enterocytes. Bile acid–based enhancers reversibly bind and form a complex with the drug, which could enhance the transport of drugs across Caco-2 cell monolayer as in the case of rat intestine.37–41
In vivo optical imaging study
Based on the results of pharmacokinetics, we investigated the distribution of the preparations in gastrointestinal tract by in vivo imaging. The persistence at different times of various preparations in the gastrointestinal tract was shown in Figure 9. Each group was given the same dose of fluorescent agent. The retention effect of the NLCs groups in the gastrointestinal tract is much better than that of the Cy5.5 solution, among which SGC-NLCs presented the strongest signal and longest persistence in the gastrointestinal tract, manifesting more Cy5.5 retaining in the gastrointestinal tract. The Cy5.5 signal increased steadily until reaching a peak at 2 hours and then slowly decreased. However, the fluorescence intensity of the Cy5.5 solution group immediately increased but rapidly decreased after oral administration. The results suggest a higher accumulation of Cy5.5 encapsulated by SGC-NLCs was achieved than that of free Cy5.5 in the gastrointestinal tract. It may be attributed to the protection mechanism of SGC-NLC, which had advantages in extending retention time and maintaining drug activity.42,43
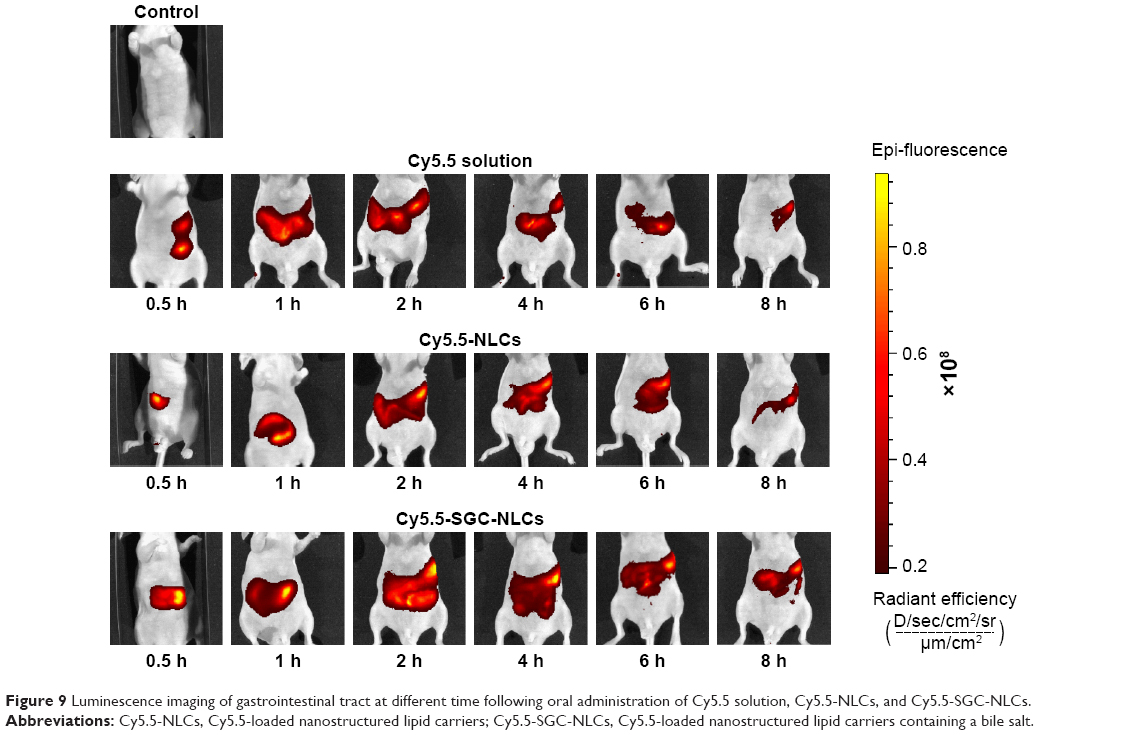 | Figure 9 Luminescence imaging of gastrointestinal tract at different time following oral administration of Cy5.5 solution, Cy5.5-NLCs, and Cy5.5-SGC-NLCs. |
Intestinal perfusion study
The intestinal absorption of GPS suspension, GPS-NLCs, and GPS-SGC-NLCs in different intestinal segments of the rat was measured using the in situ single-pass perfusion method. As shown in Figure 10, the main absorption area of GPS was the jejunum. In general, if the Papp of drug is less than 1.8×10⁻⁴ cm·min−1, it can be considered as poor absorption.44 The Papp value of GPS indicated a low permeability and bioavailability. In this study, the administration of both the kinds of GPS-NLCs and GPS-SGC-NLCs resulted in significant enhancement of Papp in each segment. Taking the example of drug absorption in the jejunum, the Papp values of GPS-NLCs and GPS-SGC-NLCs were 2.24- and 5.11-fold higher, respectively, compared with GPS suspension (P<0.05). The high molecular weight of GPS may reduce its transmembrane transport, which would limit the absorption process of GPS in the intestine.45 The SGC-NLCs could significantly enhance the absorption of drugs with the excellent biocompatibility of NLCs and by promoting the transmembrane transportation of SGC, which would result in a greater improvement of drug bioavailability.
 | Figure 10 Papp of GPS powder suspension, GPS-NLCs, and GPS-SGC-NLCs (n=6). (Compared with GPs powder, *P<0.05; compared with GPS-NLCs, #P<0.05). |
In vitro cytotoxicity
To determine the activity of different formulations on cells, the percent survival of Caco-2 cells was determined using MTT/cell cytotoxicity assay. Figure 11 presents the percentage cell survival at different concentration ranges after 24 hours of posttreatment. The viability of Caco-2 cells decreased with an increase in the concentrations of all the formulations. Moreover, blank NLCs had no significant toxicity on cells, because the cell viability rates of the blank NLCs in different concentrations exceeded 95%. The findings suggested that GPS exhibited a cytotoxic effect. At the same dose, the viability of cells treated with GPS-SGC-NLCs was slightly lower than that of the cells treated with GPS-NLCs without significant difference, but it was markedly higher than the viability of cells treated with GPS powder (P<0.05), which proved the lack of cytotoxicity of the SGC bile salt. GPS-SGC-NLCs greatly decreased the cytotoxicity of the drug, and the percentage of cell viability of GPS-SGC-NLCs at 5 mg/mL, 50 mg/mL, and 100 mg/mL was approximately 94.5%, 91.0%, and 86.7%, while that of the GPS powder was 85.8%, 78.3%, and 70.9% at the corresponding concentrations. These findings suggested that the GPS-SGC-NLCs were biocompatible with Caco-2 cells and well tolerated by the gastrointestinal tract.
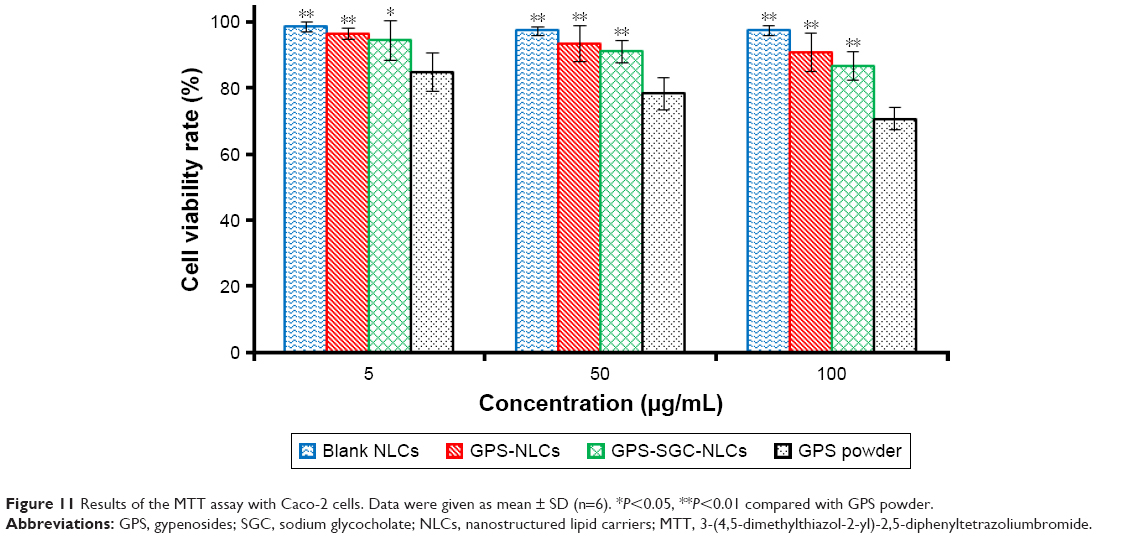 | Figure 11 Results of the MTT assay with Caco-2 cells. Data were given as mean ± SD (n=6). *P<0.05, **P<0.01 compared with GPS powder. |
Conclusion
We successfully fabricated GPS-loaded NLCs containing a bile salt using a hot melting, high-pressure, homogenization method. Optimization by CCD helped to improve our understanding of the factors involved and to predict the relationships between various independent and dependent variables associated with GPS-SGC-NLCs system, promoting the preparation of a formulation capable of optimal performance. GPS incorporated into NLCs was in an amorphous form as confirmed by DSC and XRD analyses. In vitro and in vivo study showed that GPS-SGC-NLCs could remarkably enhance the dissolution and bioavailability of GPS and GPS-NLCs. In vivo imaging and in vivo intestinal perfusion studies had further demonstrated that SGC-NLCs could promote the absorption of drugs in the intestine, which indicated that SGC-NLCs are superior to conventional NLCs in improving the oral bioavailability and are a promising system for oral delivery of GPS.
Acknowledgments
This work was sponsored by the Interdisciplinary Program of Shanghai Jiao Tong University (project number YG2016QN08).
Disclosure
The authors report no conflicts of interest in this work.
References
Yang Y-H, Yang J, Jiang Q-H. Hypolipidemic effect of gypenosides in experimentally induced hypercholesterolemic rats. Lipids Health Dis. 2013;12(1):1–6. | ||
Liu J-S, Chiang T-H, Wang J-S, et al. Induction of p53-independent growth inhibition in lung carcinoma cell A549 by gypenosides. J Cell Mol Med. 2015;19(7):1697–1709. | ||
Shi L, Pi Y, Luo C, Zhang C, Tan D, Meng X. In vitro inhibitory activities of six gypenosides on human liver cancer cell line HepG2 and possible role of HIF-1α pathway in them. Chem Biol Interact. 2015;238:48–54. | ||
Mu R-H, Fang X-Y, Wang S-S, et al. Antidepressant-like effects of standardized gypenosides: involvement of brain-derived neurotrophic factor signaling in hippocampus. Psychopharmacology. 2016;233(17):3211–3221. | ||
Chen M-H, Chen S-H, Wang Q-F, et al. The molecular mechanism of gypenosides-induced G1 growth arrest of rat hepatic stellate cells. J Ethnopharmacol. 2008;117(2):309–317. | ||
Yu H, Guan Q, Guo L, et al. Gypenosides alleviate myocardial ischemia-reperfusion injury via attenuation of oxidative stress and preservation of mitochondrial function in rat heart. Cell Stress Chaperones. 2016;21(3):429–437. | ||
Yu F. Preparation, characteristics and bioactivity of Gypenosides-Loaded microcapsules. Adv Mat Res. 2013;710:195–198. | ||
Yu Y, Lu Y, Bo R, et al. The preparation of gypenosides liposomes and its effects on the peritoneal macrophages function in vitro. Int J Pharm. 2014;460(1–2):248–254. | ||
Beloqui A, Solinís María Á, Rodríguez-Gascón A, Almeida AJ, Préat V. Nanostructured lipid carriers: promising drug delivery systems for future clinics. Nanomedicine 2016;12(1):143–161. | ||
Luan J, Zheng F, Yang X, Yu A, Zhai G. Nanostructured lipid carriers for oral delivery of baicalin: in vitro and in vivo evaluation. Colloids Surf A. 2015;466:154–159. | ||
Chen Z, Lai X, Song S, Zhu X, Zhu J. Nanostructured lipid carriers based temozolomide and gene co-encapsulated nanomedicine for gliomatosis cerebri combination therapy. Drug Deliv. 2016;23(4):1369–1373. | ||
Khan S, Baboota S, Ali J, Narang RS, Narang JK. Chlorogenic acid stabilized nanostructured lipid carriers (NLC) of atorvastatin: formulation, design and in vivo evaluation. Drug Dev Ind Pharm. 2016;42(2):209–220. | ||
Roger E, Lagarce F, Garcion E, Benoit J-P. Biopharmaceutical parameters to consider in order to alter the fate of nanocarriers after oral delivery. Nanomedicine. 2010;5(2):287–306. | ||
Mudie DM, Amidon GL, Amidon GE. Physiological parameters for oral delivery and in vitro testing. Mol Pharm. 2010;7(5):1388–1405. | ||
Zhang Z, Gao F, Jiang S, et al. Bile salts enhance the intestinal absorption of lipophilic drug loaded lipid nanocarriers: mechanism and effect in rats. Int J Pharm. 2013;452(1–2):374–381. | ||
Niu M, Lu Y, Hovgaard L, Wu W. Liposomes containing glycocholate as potential oral insulin delivery systems: preparation, in vitro characterization, and improved protection against enzymatic degradation. Int J Nanomedicine. 2011;6:1155–1166. | ||
Yang G, Zhao Y, Zhang Y, Dang B, Liu Y, Feng N. Enhanced oral bioavailability of silymarin using liposomes containing a bile salt: preparation by supercritical fluid technology and evaluation in vitro and in vivo. Int J Nanomedicine. 2015;10:6633–6644. | ||
Guan P, Lu Y, Qi J, et al. Enhanced oral bioavailability of cyclosporine A by liposomes containing a bile salt. Int J Nanomedicine. 2011;6:965–974. | ||
Senior K. Bilosomes: the answer to oral vaccine delivery? Drug Discov Today. 2001;6(20):1031–1032. | ||
Mikov M, Fawcett JP, Kuhajda K, Kevresan S. Pharmacology of bile acids and their derivatives: absorption promoters and therapeutic agents. Eur J Drug Metab Pharmacokinet. 2006;31(3):237–251. | ||
Sanap GS. Design and evaluation of miconazole nitrate loaded nanostructured lipid carriers (NLC) for improving the antifungal therapy. J App Pharm Sci. 2013;3(1):1–2. | ||
Singh P, Arya M, Kanoujia J, Singh M, Gupta KP, Saraf SA. Design of topical nanostructured lipid carrier of silymarin and its effect on 7,12-dimethylbenz[a]anthracene (DMBA) induced cellular differentiation in mouse skin. RSC Advances. 2016;6(88):84965–84977. | ||
Rahman HS, Rasedee A, How CW, et al. Zerumbone-loaded nanostructured lipid carriers: preparation, characterization, and antileukemic effect. Int J Nanomedicine. 2013;8:2769–2781. | ||
Zhou X, Zhang X, Ye Y, et al. Nanostructured lipid carriers used for oral delivery of oridonin: an effect of ligand modification on absorption. Int J Pharm. 2015;479(2):391–398. | ||
Desai MP, Labhasetwar V, Walter E, Levy RJ, Amidon GL. The mechanism of uptake of biodegradable microparticles in Caco-2 cells is size dependent. Pharm Res. 1997;14(11):1568–1573. | ||
Chen Y, Yuan L, Zhou L, Zhang Z-Hai, Cao W, Wu Q. Effect of cell-penetrating peptide-coated nanostructured lipid carriers on the oral absorption of tripterine. Int J Nanomedicine. 2012;7(4):4581–4591. | ||
Siekmann B, Westesen K. Melt-homogenized solid lipid nanoparticles stabilized by the nonionic surfactant tyloxapol. I. Preparation and particle size determination. Pharm Pharmacol Lett. 1994;3:194–197. | ||
de Carvalho SM, Noronha CM, Floriani CL, et al. Optimization of α-tocopherol loaded solid lipid nanoparticles by central composite design. Ind Crops Prod. 2013;49:278–285. | ||
Hejri A, Khosravi A, Gharanjig K, Hejazi M. Optimisation of the formulation of β-carotene loaded nanostructured lipid carriers prepared by solvent diffusion method. Food Chem. 2013;141(1):117–123. | ||
Zhang J, Fan Y, Smith E. Experimental design for the optimization of lipid nanoparticles. J Pharm Sci. 2009;98(5):1813–1819. | ||
Jain K, Sood S, Gowthamarajan K. Optimization of artemether-loaded NLC for intranasal delivery using central composite design. Drug Deliv. 2015;22(7):940–954. | ||
das S, Ng WK, Tan RBH. Are nanostructured lipid carriers (NLCs) better than solid lipid nanoparticles (SLNs): development, characterizations and comparative evaluations of clotrimazole-loaded SLNs and NLCs? Eur J Pharm Sci. 2012;47(1):139–151. | ||
Qian C, McClements DJ. Formation of nanoemulsions stabilized by model food-grade emulsifiers using high-pressure homogenization: factors affecting particle size. Food Hydrocolloids. 2011;25(5):1000–1008. | ||
Wang F, Chen L, Jiang S, et al. Optimization of methazolamide-loaded solid lipid nanoparticles for ophthalmic delivery using Box-Behnken design. J Liposome Res. 2014;24(3):171–181. | ||
Kudarha R, Dhas NL, Pandey A, Belgamwar VS, Ige PP. Box-Behnken study design for optimization of bicalutamide-loaded nanostructured lipid carrier: stability assessment. Pharm Dev Technol. 2015;20(5):608–618. | ||
Elnaggar YSR, El-Massik MA, Abdallah OY. Fabrication, appraisal, and transdermal permeation of sildenafil citrate-loaded nanostructured lipid carriers versus solid lipid nanoparticles. Int J Nanomedicine. 2011;6(6):3195–3205. | ||
Sofou S. Radionuclide carriers for targeting of cancer. Int J Nanomedicine. 2008;3(2):181–199. | ||
Al-Hilal TA, Chung SW, Alam F, et al. Functional transformations of bile acid transporters induced by high-affinity macromolecules. Sci Rep. 2015;4(1):4163–4179. | ||
Mahmud F, Jeon O-C, Al-Hilal TA, et al. Absorption Mechanism of a Physical Complex of Monomeric Insulin and Deoxycholyl-l-lysyl-methylester in the Small Intestine. Mol Pharm. 2015;12(6):1911–1920. | ||
Al-Hilal TA, Alam F, Byun Y. Oral drug delivery systems using chemical conjugates or physical complexes. Adv Drug Deliv Rev. 2013;65(6):845–864. | ||
Meaney CM, O’Driscoll CM. A comparison of the permeation enhancement potential of simple bile salt and mixed bile salt: fatty acid micellar systems using the CaCo-2 cell culture model. Int J Pharm. 2000;207(1–2):21–30. | ||
Hu S, Niu M, Hu F, et al. Integrity and stability of oral liposomes containing bile salts studied in simulated and ex vivo gastrointestinal media. Int J Pharm. 2013;441(1–2):693–700. | ||
Niu M, Tan Ya’nan, Guan P, et al. Enhanced oral absorption of insulin-loaded liposomes containing bile salts: a mechanistic study. Int J Pharm. 2014;460(1–2):119–130. | ||
Nishimura H, Hayashi C, Aiba T, et al. Application of the correlation of in vitro dissolution behavior and in vivo plasma concentration profile (IVIVC) for Soft-Gel Capsules – a Pointless pursuit? Biol Pharm Bull. 2007;30(11):2221–2225. | ||
Li X, Uehara S, Sawangrat K, et al. Improvement of intestinal absorption of curcumin by cyclodextrins and the mechanisms underlying absorption enhancement. Int J Pharm. 2018;535(1–2):340–349. |
 © 2019 The Author(s). This work is published and licensed by Dove Medical Press Limited. The
full terms of this license are available at https://www.dovepress.com/terms
and incorporate the Creative Commons Attribution
- Non Commercial (unported, 3.0) License.
By accessing the work you hereby accept the Terms. Non-commercial uses of the work are permitted
without any further permission from Dove Medical Press Limited, provided the work is properly
attributed. For permission for commercial use of this work, please see paragraphs 4.2 and 5 of our Terms.
© 2019 The Author(s). This work is published and licensed by Dove Medical Press Limited. The
full terms of this license are available at https://www.dovepress.com/terms
and incorporate the Creative Commons Attribution
- Non Commercial (unported, 3.0) License.
By accessing the work you hereby accept the Terms. Non-commercial uses of the work are permitted
without any further permission from Dove Medical Press Limited, provided the work is properly
attributed. For permission for commercial use of this work, please see paragraphs 4.2 and 5 of our Terms.