Back to Journals » International Journal of Nanomedicine » Volume 15
Formulation, Cellular Uptake and Cytotoxicity of Thymoquinone-Loaded PLGA Nanoparticles in Malignant Melanoma Cancer Cells
Authors Ibrahim WN ![]() , Muizzuddin Bin Mohd Rosli L, Doolaanea AA
, Muizzuddin Bin Mohd Rosli L, Doolaanea AA ![]()
Received 25 June 2020
Accepted for publication 2 October 2020
Published 20 October 2020 Volume 2020:15 Pages 8059—8074
DOI https://doi.org/10.2147/IJN.S269340
Checked for plagiarism Yes
Review by Single anonymous peer review
Peer reviewer comments 4
Editor who approved publication: Dr Thomas Webster
Wisam Nabeel Ibrahim,1,2 Luqman Muizzuddin Bin Mohd Rosli,2 Abd Almonem Doolaanea2
1Department of Biomedical Sciences, College of Health Sciences, QU Health, Qatar University, Doha, Qatar; 2Department of Pharmaceutical Technology, Faculty of Pharmacy, International Islamic University Malaysia, Kuantan 25200, Malaysia
Correspondence: Wisam Nabeel Ibrahim Tel +97444036025
Email [email protected]; Abd Almonem Doolaanea Tel +6013-6238628
Email [email protected]
Introduction: Thymoquinone (TQ) is the main active compound extracted from Nigella sativa a traditional herb with wide therapeutic applications and recognizable anticancer properties. This study aimed to formulate and characterize TQ-nanoparticles using PLGA as a biocompatible coating material (TQ-PLGA NPs) with the evaluation of its therapeutic properties in human melanoma cancer cells.
Methods: The TQ-PLGA NPs were prepared and characterized for size, zeta potential, encapsulation efficiency, and release profile.
Results: The particle size was 147.2 nm, with 22.1 positive zeta potential and 96.8% encapsulation efficiency. The NPs released 45.6% of the encapsulated TQ within 3 h followed by characteristic sustained release over 7 days with a total of 69.7% cumulative release. TQ-PLGA NPs were taken up effectively by the cells in a time-dependent manner up to 24 h. Higher cell toxicity was determined within the first 24 h in melanoma cells due to the rapid release of TQ from the NPs and its low stability in the cell culture media.
Conclusion: TQ-PLGA NPs is a potential anticancer agent taking advantage of the sustained release and tailored size that allows accumulation in the cancer tissue by the enhanced permeability and retention effect. However, stability problems of the active ingredient were address in this study and requires further investigation.
Keywords: microencapsulation, thymoquinone, PLGA, nanoparticles, melanoma
Introduction
Malignant melanoma is the third most common malignant skin cancer and the most aggressive in terms of local invasiveness and mortality rate.1,2 A considerable attention is required in this malignancy not only due to the increase in its incidence rate,1,3 but also because this skin malignancy is characterized by its aggressive behavior that often cause treatment relapse with high mortality rate.3
Nigella sativa is well-known traditional medicine in the middle east that is used to treat chronic cardiovascular, hepatic, and renal diseases.4 Most of the pharmacological properties in this seed is attributes to its quinine derivative known as thymoquinone (TQ).5 TQ has been well known for its diverse therapeutic properties including antimicrobial, antioxidants, and anti-inflammatory effects. In cancer, it is deemed therapeutic through its interference with cell proliferation, apoptosis, cell invasion, and metastasis in cancer cells using different in vitro and in vivo models.6–9 Theses anticancer effects were reported in various types of cancers such as breast cancer cells,10 colon cancer,11 lung cancer,12 cervical squamous carcinoma,13 ovarian cancer,14 prostate cancer cell,15 and osteosarcoma.16 In addition, synergistic therapeutic effects were elicited when TQ was given in combination with other chemotherapeutic agents.8,17–21 The anticancer properties are mostly attributed to its antioxidant properties with pieces of evidence pointing towards its interference with specific cancer signaling pathways such as the MAPK, PI3-mTOR, JAK-STAT3 and NF-κB.22–25
Poly lactic-co-glycolic acid (PLGA) is a FDA approved polymer known for its biomedical applications in drug delivery due to its versatility, biodegradability, and biocompatibility.26 It is used extensively to prepare microparticles and nanoparticles to deliver a wide range of therapeutic agents including active pharmacological molecules,27 peptides,28 and nucleic acids.29
Therapeutic nanocarriers had shown promising results in the treatment of cancer partly due to the enhanced selective uptake in cancer tissue through the tumor capillaries a property known as the enhanced permeability and retention (EPR) effect.30,31 This effect is due to the disruption in the integrity of tumor capillaries and the inflamed endothelial cells potentiating the extravasation of nanocarriers through the leaky vasculature and enhancing the targeting strategy of treatment.30,31 The advantage of the EPR effect could be enhanced by nanocarriers based on specific properties such as the size and the surface charge of the particles.30 Particles of 100–200 nm size with hydrophilic surfaces tend to exhibit an improved EPR effect, which is attributed to the increased residence time of nano carriers in the blood circulation.32,33
Therefore, this study aimed to formulate TQ-loaded PLGA nanoparticles (TQ-PLGA NPs) with the evaluation of its properties and uptake in human melanoma cancer cells. The formulation was prepared to have a particle size between 100 and 200 nm, characterized and evaluated for cell uptake and cytotoxicity using the A375 melanoma cancer cell line.
Materials and Methods
Materials
Thymoquinone (Sigma Aldrich; WGK, Germany), medium molecular weight chitosan (190–310 kDa, 75–85% deacetylated) and polyvinyl alcohol (PVA) (Sigma Aldrich; Saint Lois, USA). Tween 80, Acetone and dichloromethane (Merck; Darmstadt, Germany). Poly lactic-co-glycolic acid 5004 (Purasorb; Corbion Purac, Holland). Coumarin-6 (Sigma-Aldrich; Milwaukee, Wisconsin, USA). High glucose of Dulbecco’s modified Eagle medium containing phenol red, L-glutamine and sodium pyruvate (Nacalai Tesque Inc; Kyoto, Japan), fetal bovine serum (Tico Europe; South America), HEPES buffer (Gibco, Life Technology Corporation; Auckland, New Zealand), the penicillin-streptomycin antibiotic (Gibco Invitrogen; Auckland, New Zealand), Tryple E (Gibco, Fischer Scientific; Massachusets, USA). Tissue culture wares (American Type Cell Culture (ATCC); Manassas, USA), all organic solvents used were of HPLC grade. MTT [3-(4,5-Dimethyl-thiazol-2-yl)-2, S-diphenyltetrazolium bromide] (Merck; Darmstadt, Germany), and dimethylsulfoxide (DMSO) (Sigma-Aldrich, Darmstadt, Germany).
Nanoparticle Preparation
The fabrication process was adopted from Doolaanea A. M.34 Briefly, 6 mL aqueous phase (1% w/v chitosan, 0.2% PVA and 0.8% w/v Tween 80) was added into the oil phase (10 mg of TQ and 60 mg of PLGA dissolved in 2 mL mixture of 20:80 v:v ethyl acetate (EA) and dichloromethane (DCM)). The aqueous and oil phases were sonicated using a probe sonicator (Qsonica Q700, Newtown, USA) to form an emulsion that was then dropped slowly into a dispersion medium of 24 mL water and left on a magnetic stirring for 2 h for complete solvent evaporation. The nanoparticles were then washed to remove the excess stabilizers and were collected through centrifugation. Nanoparticles were then re-suspended in 2 mL distilled water and evaluated for nanoparticle size, zeta potential, and encapsulation efficiency. The nanoparticles were lyophilized to form a powdered dosage form using Christ Freeze Dryer (Martin Crist Alpha 1–2LD Plus, Pocklington, UK).
For quantitative analysis using a flow cytometer and qualitative analysis of the cell uptake using the fluorescence microscope, coumarin-6 a fluorescence dye was used. The dye was added together with other excipients that make up the oil phase (0.1% coumarin-6) together with the organic solvent and PLGA.
Nanoparticle Characterization
Particle Size and Zeta Potential
A volume of 20 µL of nanoparticle suspension was diluted in 2 mL of distilled water, then the particle size and zeta potential were measured before lyophilization by dynamic light scattering (DLS) using Zeta sizer Nano-S and Nano-Z from Malvern Instruments Ltd (Malvern, Worcestershire, UK). The values were expressed as median diameter (D 50%) and millivolt (mV), for particle size and zeta potential, respectively. The polydispersity index (PDI) of the particle size was also reported.
Loading Efficiency
Encapsulation efficiency was measured indirectly by quantifying the amount of total un-encapsulated TQ using high-performance liquid chromatography (HPLC) with a validated analytical method as reported before.35 Briefly, after nanoparticle fabrication, 2 mL of the nanoparticle suspension was collected and the supernatant was obtained by centrifugation. The HPLC analysis was performed using Shimadzu LC-20AT equipment (Shimadzu, Japan). A mixture of acetonitrile and water in the ratio of 60:40 was used as a mobile phase at a flow rate of 1 mL/min using Inspire C18 (4.6 x 250 mm, 5 µm) analytical column. The detection was performed at a UV wavelength of 254 nm using a diode-array detector. The encapsulation efficiency was calculated based on the Equation below (Eq.1):

where  is the initial TQ concentration used in the oil phase and
  is the final TQ concentration in the aqueous phase.
Scanning Electron Microscopy
The nanostructure of the particles was observed under a scanning electron microscope (SEM; Zeiss, Evo 50, Germany). The samples were sputter-coated with gold before observation under the SEM. The highest magnification images were obtained to observe the freeze-dried nanoparticle prepared from the optimized formulation.
Release Profile
Five milligrams of the optimized freeze-dried nanoparticles were suspended in 5 mL of phosphate buffer saline (PBS pH 7.4) and incubated at 37°C. At predetermined time points (0 h, 1 h, 3 h, 21 h. 42 h, and 1 week), 1 mL of the release medium was removed, and the NPs were separated by centrifugation. Fresh PBS was added to replace the taken amount. TQ in the release medium was evaluated using HPLC as mentioned before.
Differential Scanning Calorimetry (DSC)
DSC analysis of individual components of the nanoparticle formulation (PLGA polymer, TQ, Tween 80, PVA and chitosan) and the physical mixture of polymer + drug (1:1) was performed using PerkinElmer DSC-7® (PerkinElmer, Inc., MA, USA). Equal weight of about 5 mg of each sample was loaded into 40 µL standard aluminum crucibles then heated under continuous nitrogen purging (20 mL/min) at a heating rate of 10°C/min to 350°C. An empty crucible served as a reference.
Fourier-Transform Infrared Spectroscopy (FTIR)
TQ, PLGA, PVA, TQ-PLGA NPs were examined for FTIR spectra in the range of 400 to 4000 cm−1 at 4 cm−1 resolution (Frontier Optica, Perkin Elmer, Pittsburgh, Pennsylvania, USA).
Stability of the Nanoparticles
Three types of stability assays were performed on TQ nanoparticle formulation and TQ solution. The first assay was based on the observation for changes in the particle size, PDI, and zeta potential using Malvern Zetasizer Nano-S and Nano-Z (Malvern Instruments Ltd, Malvern, Worcestershire, UK). The physical stability study was performed 1 month after preparation of the TQ-loaded PLGA nanoparticle suspensions at four different storage temperatures (−40°C, −20°C, 5°C and 25°C).
The second stability assay involved the assessment of nanoparticles in the cell culture medium. Here, the nanoparticle suspensions were added to complete cell culture medium (DMEM) at different concentrations (0.1 mg/mL to 10 mg/mL). The nanoparticle suspensions were incubated at 37ºC and were tested after 24 h and 48 h, respectively. The parameters used included changes in the particle size, PDI, and zeta potential.
The third stability assay involved the assessment of chemical degradation of TQ in complete cell culture medium (DMEM) using the HPLC.
Cell Culture
A375 human melanoma cells were obtained from American Type Cell Culture (ATCC), Manassas, USA. The cells were cultured in T75 and T25 flasks (Eppendorf, San Diego California, USA) at 37°C and 5% CO2 using High glucose Dulbecco’s modified Eagle medium (DMEM) Eagle’s Minimum Essential Medium (EMEM). Fetal bovine serum, penicillin-streptomycin, and HEPES buffer were added to a final concentration of 10%, 2%, and 1%, respectively, to complete the growth medium.
Cell Uptake of Nanoparticles
A375 cells were seeded in 96-well flat plate at a concentration of 1 x 10⁴ cells/100 µL/well. For concentration-dependent studies of the cell uptake, after the cells adhered to plate within 24 h then treatment started with 0.1, 1.0, 2.5, 5, and 10 mg/mL concentrations of coumarin-TQ-loaded PLGA NPs for 24 h. Meanwhile, for time-dependent cell uptake, the cells were assessed after 2 h, 6 h, and 24 h of treatment, respectively, using a fixed concentration of the NPs. On the time of assay, the cells were washed gently with ice-cold PBS three times before being detached by triple E in the incubator for 2 min.36 The cells were centrifuged at 800 g for 4 min and the supernatant was discarded. The cells were then re-suspended in 4% of formaldehyde for cell fixation and incubated in ice for 10 min. The cells were centrifuged and re-suspended in PBS buffer saline before being evaluated with the flow cytometer. The forward light scatters (FSC) were used to count the total number of cells after the deduction of the background caused by some free NPs in the medium. On the other hand, the green fluorescence channel was used to count the positive cells (successful cell uptake if fluorescent NPs).
The efficiency of cell uptake was also qualitatively assessed using a fluorescent microscope (Cytell cell imaging system, GE Healthcare life science, Buckinghamshire, UK). In this assay, the A375 cells were seeded on round-coated coverslip mounted in 24-well flat plate at a concentration of 1 x 10⁴ cells/well. Cells were allowed to attach for 24 h and then the cells were incubated with a suspension of 1.0 mg/mL coumarin-loaded nanoparticles in growth medium for 2 h. The coverslips were then transferred into wells containing ice-cold 4% paraformaldehyde for 10 min fixation. Then the coverslip was lifted and placed on top of the glass slide with cells facing upwards. A 50 µL of mounting medium containing fluorescent dyes of DAPI and phalloidin with the ratio 1:1 was dropped on the cells before being covered by square coverslip cleaned with 70% ethanol. The glass coverslips were sealed to retain the position on the glass slide before being examined under the Cytell fluorescence microscope.
In vitro Cancer Cytotoxicity Assay
The cytotoxic effect of TQ solution and NPs form was evaluated using the MTT assay (3-(4,5-dimethylthiazol-2-yl)-2,5-diphenyltetrazolium bromide assay) in the A375 cells. The cells were seeded in 96-well flat plate at a concentration of 1 x 10⁴ cells/well and allowed to attach for 24 h. The cells were then treated with TQ solution, TQ-PLGA NPs and blank NPs using concentration gradients of (1–100 µg/mL) and (0.1–10 mg/mL) respectively for 24 h and 48 h. After the treatment, the medium was aspirated, and the cells were washed with PBS and treated with MTT reagent (5 mg/mL in PBS). The formazan crystals produced by mitochondrial reductase enzyme of the living A375 cells were dissolved using dimethyl sulfoxide (DMSO) with continuous agitation. The cells were incubated at room temperature for 30 min before measuring the light absorbance at 570 nm wavelength using a microplate reader (Infinite M200 Nanoquant, Tecan, Austria). The percentage of cell viability were calculated, by deducting the absorbance of the cell-free wells containing MTT only from the absorbance values of treatment wells and then dividing the corrected absorbance value on by the absorbance of healthy-untreated cells.
Statistical Analysis
Comparisons amongst the three formulations were carried out using analysis of variance (ANOVA) with Tukey’s post hoc test while t-test was employed for comparisons within each formulation. P-value < 0.05 was considered statistically significant. Minitab software version 16 (Minitab, State College, PA) was used to perform the statistical analysis.
Results and Discussion
Characterization of Nanoparticles
TQ-PLGA NPs exhibited monomodal particle size distribution (Figure 1) with an average size of Di50 = 147.2 ± 0.4 nm with PDI of 0.142 ± 0.017. The NPs showed a positive zeta potential of 22.1 ± 1.1 attributed to the adsorption of chitosan on the surface. TQ encapsulation efficiency was high (96.81 ± 0.05%) thanks to its low water solubility. The solubility of TQ was reported as 549–669 μg/mL in the aqueous solutions.37 High encapsulation efficiency is usually obtained with hydrophobic drugs when using the solvent evaporation method for nanoparticle preparation. The low aqueous solubility prohibits the material from escaping to the external phase. This is applicable to TQ which is a hydrophobic material with low aqueous solubility.
 |
Figure 1 SEM image of the freeze-dried TQ-PLGA NPs. |
The in vitro release of TQ from PLGA NPs showed a typical biphasic release pattern (Figure 2). The NPs released 45.6% of the encapsulated TQ within the first 3 h followed by characteristic sustained release. The cumulative percentage release of TQ was 65.0% within 48 h followed by slower release pattern to reach only 69.7% after 1 week. The initial burst of TQ release was likely due to the release of TQ loosely attached to the surface of the nanoparticles, whereas the later slow release may indicate the release from the of PLGA NPs matrix.
 |
Figure 2 Release profile of the optimized TQ-PLGA NP formulation (Mean ± SE, n = 3). The release profile has two phases; burst release within 24 h followed by sustained release up to one week. |
Optimum storage conditions for TQ-PLGA NPs were evaluated in this study in which the particles were stored in different storage conditions for 10 days. At freezing temperatures of −20°C and −40°C, the nanoparticles demonstrated a propensity to aggregate after defrosting the nanoparticle suspension that was indicated by the increase in particle size (Figure 3). This may be attributed to the detachment of chitosan molecules from the surface of the nanoparticles as indicated by the decrease of zeta potential values. These loosely attached or detached chitosan molecules may contribute in the adherence between adjacent nanoparticles causing aggregation. When TQ nanoparticles were prepared without using chitosan, the suspension displayed significantly better solubility and less aggregation which further support the claimed observation in this study.36 Therefore, uncoated PLGA NPs exhibited better suspension stability than chitosan-coated PLGA NPs at freezing temperatures.
 |
Figure 3 Stability of TQ-PLGA NP suspension at four different storage conditions. The stability indicators included (A) PS (particle size), (B) PDI (polydispersity index) and (C) ZP (zeta potential). |
The nanoparticles structure plays an important role in determining their interaction and adhesion with body cells. To determine the morphology of the nanoparticles, SEM was carried out. The nanoparticles appeared as clumps of grainy like structure that is mostly attributed to the effect of freezing on the nanoparticle suspension as shown (Figure 3). This finding was supported in other studies, where larger particles are produced when using rapid freezing rate.38 The tendency of nanoparticles for aggregations are more likely to happen when the van der Waals attractive forces between nanoparticles are larger than the electrostatic repulsive forces during the freezing process.39 Chitosan and PVA provide steric stabilization through the binding on the surface of the nanoparticles while Tween 80 provides electrosteric stabilization to the nanoparticle suspension.40 Coating TQ-PLGA NPs with these three materials may have contributed in producing the weak steric or electrostatic stabilization of the nanoparticle rendering most of the particles in a fragile state that could collapsed easily upon freezing and thawing.
The nanoparticles formulations in powdered form are usually more stable than being in the suspension form. Thus the powdered form may prevent the premature release of the encapsulated drug in the dispersed phase; it therefore allows longer terms of storage and ease of transport.41
The aggregation problem observed in the study could be overcome by the usage of cryoprotectants as they shield the nanoparticles from one another through particle isolation hypothesis and therewith hinder the aggregation.42 Based on the findings in the study it is recommended to store TQ-PLGA NPs in the fridge (5 °C) and use the particles suspension within 10 days.
FTIR spectra helps to study interactions between different components in the formulation and such interactions are indicated by appearance or disappearance of peaks or peaks shift.43 The infrared spectra of TQ, blank nanoparticles (PLGA NPs), and TQ-PLGA NPs are shown in Figure 4. The characteristic spectra of all of the samples showed the alkane groups (–CH, –CH2, –CH3) stretching at 2800–3000 cm−1, and ethers group (C–O) stretching at 1050–1250 cm−1. For both blank and loaded nanoparticles, the carboxyl group (–C=O) of PLGA exhibited stretching at 1750–1625 cm−1. Peaks in range of 1600–1580 cm−1 are attributed to the benzene ring of TQ. The characteristic peaks in TQ-PLGA NPs were identical to those of blank PLGA NPs and were therefore attributed to the peaks of PLGA polymer. On the other hand, TQ peaks were not detected in the loaded TQ-PLGA NPs probably due to the small percentage of TQ compared to PLGA and the weak absorption bands of TQ compared to PLGA.
 |
Figure 4 ATR-FTIR spectra of PLGA NPs, TQ-PLGA NPs, and TQ. |
Differential scanning calorimetry (DSC) thermograms for the NP components, physical mixture, blank NPs, TQ, and TQ-PLGA NPs are shown in Figure 5. Melting temperature Tm of TQ was found at 48.33°C. PLGA polymer showed a glass transition Tg onset at 42.45°C with clear enthalpy relaxation. There was no shifting in Tg of the blank nanoparticle curve. TQ-PLGA NP Tg onset was at 30.3°C suggesting a remarkable plasticizing effect of TQ on PLGA. Lowering the glass transition below body temperature may contribute to the rapid release of TQ from the nanoparticles. This is due to the increase in polymer molecular mobility above the glass transition temperature. Consistent observations were reported in TQ, PLGA, and physical mixture thermograms of other studies.44
 |
Figure 5 DSC thermograms of (A) TQ and the components in the NP formulation, physical mixture, and blank NPs and (B) TQ-PLGA NPs. |
TQ melting peaks disappeared in the thermogram of TQ-PLGA NP denoting the amorphous state of TQ in the NP formulation. This may contribute to the fast release from the nanoparticles as amorphous forms usually have better solubility than their crystalline counterparts.
Stability of Nanoparticles in Cell Culture Media
The physical stability of TQ-PLGA NPs was evaluated by measuring particle size, PDI, and zeta potential of various nanoparticle concentrations in the media used for the cell viability, cell cytotoxicity, and cell uptake studies at 37ºC as summarized in Figure 6.
 |
Figure 6 TQ-PLGA NP stability in DMEM media in term of polydispersity index (A), particle size (B), and zeta potential (C) incubated at 37ºC. The values are mean ± standard deviation, n=3, t-test of variance, *p-value ≤0.05, **p-value ≤0.001. |
As shown, there was no significant change in the particle size within 24 h (p > 0.05); however, after 48 h significant changes were elicited as indicated in the figure (p < 0.05).
The poly disparity index (PDI) of the of TQ-PLGA NPs demonstrated significant changes in culture media after 24 h and 48 h storage at different NP concentrations. While the zeta potential values remained considerably stable with lower NP concentrations, unlike the changes observed at higher concentrations. These changes are probably due to the adsorption of protein components within the media with the NPs. The colloidal stability mainly depends on the electrical double layer and the steric repulsion of the particles. The components in the cell culture media like serum albumin/globulins, amino acids, and ionic salts influence the hydrodynamic size and the charge of nanoparticles and these constituents may destabilize the nanoparticle suspension by adsorption leading to loss of surface integrity and function leading to profound aggregation by the electrostatic interactions.40
In addition, TQ degradation in the complete growth media was evaluated at the optimum culture conditions at 37ºC using HPLC analysis as represented in Figure 7. As shown, approximately 18.0% and 77.0% of degradation occurred within 24 h and 48 h, respectively. Even though TQ exerts a considerable rate of degradation within 48 h in CGM at 37ºC, the use of PLGA as carrier played an important role in increasing the stability of TQ and enhance its bioavailability for safe delivery to the targeted cells.45
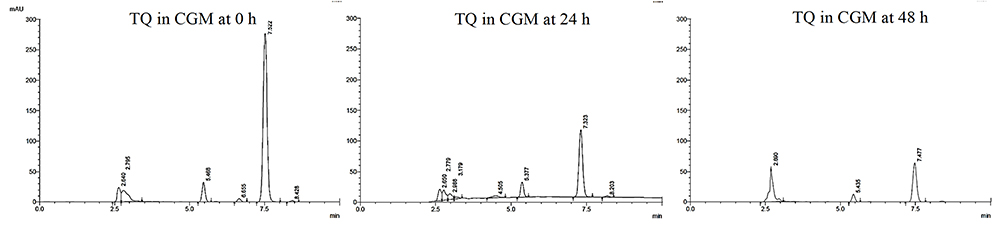 |
Figure 7 HPLC chromatograms demonstrating the stability of TQ in complete cell culture media at 0, 24 and 48 h incubation (37 °C). |
Cellular Uptake of the Nanoparticles
The cellular uptake of TQ nanoparticles was evaluated based on the principles of flow cytometry in which the forward-scattered light (FSC) is proportional to the cell size whereas the side-scattered light (SSC) is related to cell internal complexity.46 The color detection throughout this study was the green color emitted by coumarin-6 fluorescent dye. In the beginning, parameters were set to exclude the free NPs (not being taken up) and the background fluorescence of the untreated A375 cells as shown in Figure 8. Despite washing with ice-cold PBS to remove the non-internalized NPs, some nanoparticles were still present as shown in the Figure. These free nanoparticles exhibited high fluorescence with low forward scattering due to their small size compared to the cell size. Meanwhile, the cell that did not take up nanoparticles had lower fluorescence emissions. Therefore, the vertical line at value 12 on the forward scattering x-axis was set to exclude the background fluorescence of free nanoparticles while the horizontal line at value 100 on the fluorescence y-axis was set to exclude the background fluorescence from the untreated A375 cells. This comparable exclusion criterion was also used in other reports.47 The evaluation of cell uptake using the flow cytometry are demonstrated as histogram plots in Figure 9 for concentration-dependent assessment and Figure 10 for time-dependent assessment. Figure 11 shows the quantification data of coumarin-6 (C6)-PLGA NP uptake by the A375 cells based on the mean fluorescence intensity. The highest intracellular uptake of C6-PLGA NP was at 1.0 mg/mL with time-dependent increase in cell uptake up to 24 h.
 |
Figure 8 Flow cytometric analysis of the controls (A) free nanoparticles spiked in a media (positive control) and (B) untreated cells (negative control). |
 |
Figure 9 Flow cytometric analysis of A375 melanoma cells when incubated with coumarin-loaded nanoparticles in different concentration of nanoparticles suspension; (A) 0.1 mg/mL, (B) 1.0 mg/mL, (C) 2.5 mg/mL, (D) 5.0 mg/mL and (E) 10.0 mg/mL incubated for 24 h. |
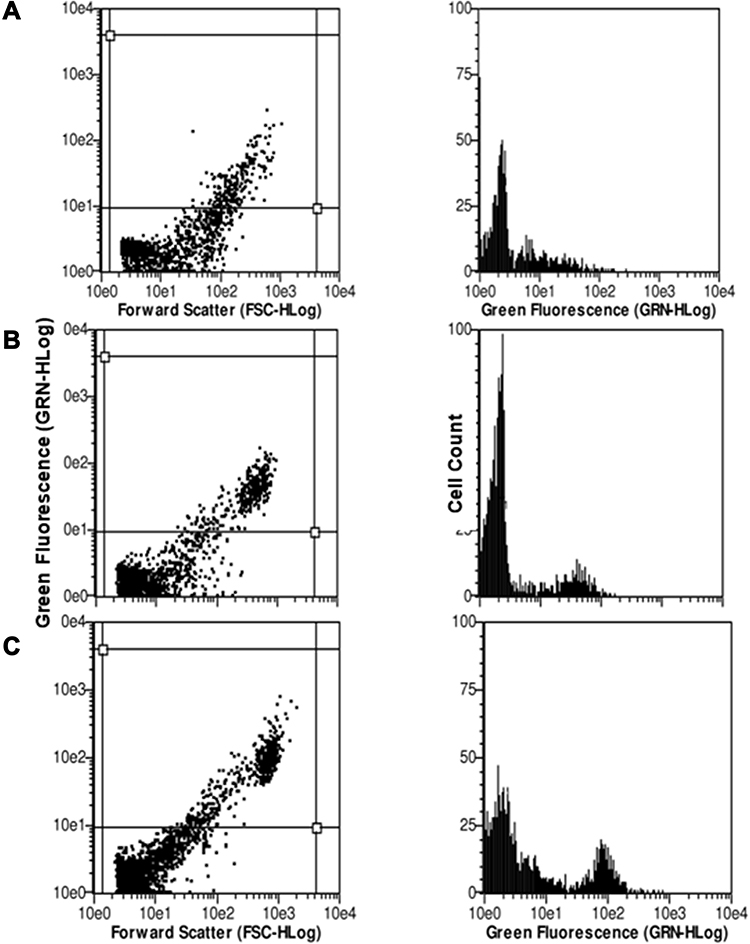 |
Figure 10 Flow cytometric analysis of A375 melanoma cells when incubated with coumarin-loaded nanoparticles treated with 1.0 mg/mL concentration of nanoparticles suspension at 3 different time points; (A) 2 h (B) 6 h, and (C) 24 h. |
 |
Figure 11 Cellular uptake mean fluorescence intensity (MFI) of coumarin-6 nanoparticles (C6-PLGA NPs) by A375 cell line at (A) different concentrations of nanoparticles and (B) three different times of incubation. |
The study confirmed that the size and surface charge of the nanoparticles had contributed significantly to cellular uptake. The positive surface charge of the NPs interacted with the negatively charged cell membrane of the A375 cells facilitating the internalization of the C6-PLGA NPs. This finding is supported by the reported effect of PLGA-nanoparticles that quickly escapes the endo-lysosomes and were efficiently internalized within the cell cytoplasm after 10 min incubation time.48 This was attributed to the interaction between the nanoparticles and the vesicular membranes leading to transiently localized destabilization of the cell membrane resulting in the escape of nanoparticles into the cytosol.
The highest intracellular uptake was at 1.0 mg/mL concentration. Higher concentrations had considerably decreased the cellular uptake probably because of NPs aggregation in the complete growth medium as confirmed by the physical stability assay shown in Figure 6. In addition, the changes in the PDI of the nanoparticles were more obvious at the higher NP concentrations. The demonstrated NPs aggregation was more evident at high concentration (10 mg/mL); whereby the measured particle size in the complete growth medium was 291 nm compared to 189 nm at 1 mg/mL concentration. This explains how smaller particles are taken up at higher extent in biological cells compared to larger particles as evidenced by reports.49
At 1 mg/mL concentration, the time-dependent cell uptake demonstrated a proportional increase with time up to 24 h. This is consistent with other studies that reported the positive correlation between cell uptake and time until it reached a plateau or saturation.50,51 This may highlight the importance of the extending the nanoparticles availability in the blood circulation or in the cancer tissue to enhance the internalization within cancer cells.
The internalization of C6-PLGA nanoparticles into A375 cells was also visualized using fluorescence microscopy using 1.0 mg/mL concentration of C6-PLGA NPs for 2 h (Figure 12). Coumarin-6 is considered suitable for cell uptake studies since it does not cause acute toxicity and is found stable post encapsulation with no instant release into the cellular media once internalized.52 As shown, the C6-PLGA NPs were seen inside the A375 cells and well distributed into the cytosol while some were allocated around the nucleus. The images also confirmed the average size of the NPs though there are some aggregated NPs that could be seen.
 |
Figure 12 Cellular uptake of coumarin-6 nanoparticles (C6-PLGA NPs) by A375 cell line as seen under fluorescence microscope after immunofluorescent staining of the actin cytoskeleton and the nucleus of the cells using TRITC-conjugated phalloidin (red) and DAPI (blue) respectively; (A) 40X, (B) 100X magnifications. |
In vitro Anticancer Activity of TQ and TQ-PLGA NPs
One of the properties of cancer tissues is that it tends to have a highly permeable vasculature allowing nanoparticles with a size of about 100–200 nm to pass easily and accumulate in the cancer tissue as described earlier. This allows the nanoparticle administered through the intravenous route to be passively delivered to the targeted cells.30,31 TQ-PLGA NP formulation had a size of 147.2 nm, that was evaluated for its cytotoxic properties in A375 melanoma cancer cells in comparison with the TQ solution.
The cytotoxicity assessment of TQ solution in A375 cancer cells was determined at two-time intervals (24 h and 48 h) using different concentrations as shown in Figure 13. The figure demonstrates a dose-dependent cytotoxic property of TQ solution that reached a significant level at concentration of 50µg/mL, where the proliferation of melanoma cancer cells was inhibited by approximately 50%. As shown, the cytotoxic effects were significantly lower after 48 h treatment probably due to the low stability and degradation of TQ in the culture media. As such, a higher trend of TQ cytotoxicity was elicited among the cancer cells within the first 24 h of incubation. Low concentrations of TQ had not shown any inhibitory effect where the cells displayed nearly a 100% viability after 24 h treatment. This may be attributed to rapid proliferation of A375 cells with reported doubling time of 6–12 h in the first 24 h that is consistent with other reports.53
 |
Figure 13 Cell viability of A375 cells treated with different concentrations of TQ solution for 24 h and 48 h. |
As demonstrated after 50µg/mL concentration of TQ, the dose-dependent response reached a plateau at approximately 50% cell viability. The IC50 concentration of TQ-solution in A375 cells was between 50 µg/mL and 100 µg/mL with 48.0% and 51.1% at 24 h, and 35.6% and 55.1% at 48 h, respectively. The reported IC50 concentration of TQ was significantly higher than other studies conducted on melanoma cells lines and this difference may be attributed to difference of cell line virulence and proliferation.54
In the developed formulation of TQ (TQ-PLGA NP), the A375 cells showed a concentration-dependent cytotoxic effect as shown in Figure 14. As shown, the cytotoxic effects of TQ-PLGA NPs reached its maximum rate at the concentration of 7.5 mg/mL with 34.2% cell viability within 24 h of treatment.
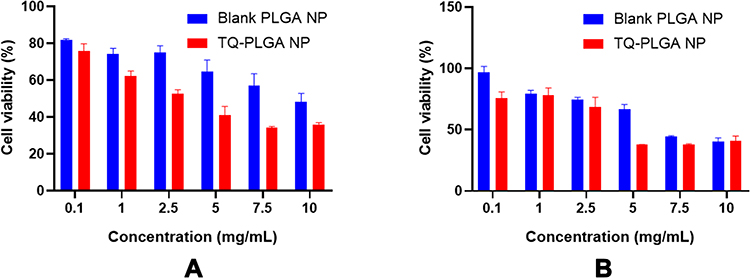 |
Figure 14 Cytotoxicity study (MTT assay) of blank nanoparticles and TQ-PLGA NPs in A375 human melanoma cancer cells. (A) 24 h and (B) 48 h. |
The blank nanoparticle suspension had also demonstrated cytotoxic effects in cancer cells as the viability decrease to 40.3% at the highest concentration of the nanoparticles after 48 h of incubation. Based on other observations, PLGA nanoparticles of 200 nm size are unlikely to exhibit cytotoxic effects at concentration range of 10 µg/mL to 300 µg/mL.55,56
The observed effect of blank nanoparticles may be attributed to particles aggregation at higher concentrations imposing more toxicity among the cells.57 The positively charged NPs tend to aggregate more due to the bridging flocculation between negatively charged proteins and positively charged NPs.40
Based on the release profile of the optimized nanoparticle formulation, 56.7% of the encapsulated TQ was released from the nanoparticles within the first 24 h. therefore less cytotoxic effects were observed after 24 h due to the slower release of TQ from the drug carrier. TQ-PLGA NPs had considerably higher cytotoxicity than blank nanoparticles in the first 24 h incubation. However, the difference was not significant after 48 h which can be attributed to the rapid release (~56.7%) of TQ in the first 24 h and the degradation of TQ in the culture media (77.0% after 48 h).
The IC50 concentration of TQ-PLGA NPs in A375 cells was between 2.5 mg/mL and 5 mg/mL with 41.0% and 52.6% cell viability at 24 h and 37.5–68.3% cell viability at 48 h, respectively. The highest cytotoxic effects of the developed NPs in the A375 cells were achieved at 7.5 mg/mL concentration at 48 h.
As shown in the figure, higher concentrations of TQ were required to produce the same cytotoxic effects when encapsulated in PLGA NPs. The privileges of using this formulation despite the higher concentration include the added advantages of nanocarriers in vivo settings when compared with free TQ solution. The nanocarriers will contribute in increasing the bioavailability of TQ by enhancing aqueous solubility, increasing the half-life in the circulation, and enhance the targeted accumulation of nanoparticles within cancer tissue.30,58
Conclusion
In this study the TQ-loaded PLGA nanoparticles (TQ-PLGA NPs) were successfully prepared with a particle size of 147.2 nm with a positive zeta potential and high encapsulation efficiency. The TQ-PLGA NPs were taken up effectively by the cancer cells in a time-dependent manner up to 24 h. The optimum cell uptake and cytotoxicity of the TQ-PLGA NPs in cancer cells were challenged by the stability of TQ, aggregation and the rate of release. TQ stability in the cell culture media was rarely considered in previous studies and our study highlights the significance of TQ stability in the treatment medium. The challenges of TQ stability in aqueous solutions and the demonstrated cytotoxic effects in cancer cells demand further investigation with extrapolation to more in vitro and in vivo experiments considering its application as a cancer chemotherapeutic agent.
Funding
This study was supported by the Ministry of Higher Education (MOHE) Malaysia Fundamental Research Grant Scheme (FRGS17-005-0571). The publication of this article was funded by the Qatar National Library.
Disclosure
The authors declare no conflict of interest.
References
1. Prado G, Svoboda RM, Rigel DS. What’s new in melanoma. Dermatol Clin. 2019;37(2):159–168. doi:10.1016/j.det.2018.12.005
2. Kumar V, Abbas AK, Fausto N, Aster JC. Robbins and Cotran Pathologic Basis of Disease, Professional Edition e-Book. elsevier health sciences; 2014.
3. Matthews NH, Li W-Q, Qureshi AA, Weinstock MA, Cho E. Epidemiology of Melanoma. Cutaneous Melanoma: Etiology and Therapy [Internet]. Codon Publications; 2017.
4. Tavakkoli A, Mahdian V, Razavi BM, Hosseinzadeh H. Review on clinical trials of black seed (Nigella sativa) and its active constituent, thymoquinone. J Pharmacopuncture. 2017;20(3):179. doi:10.3831/KPI.2017.20.021
5. Gholamnezhad Z, Havakhah S, Boskabady MH. Preclinical and clinical effects of Nigella sativa and its constituent, thymoquinone: a review. J Ethnopharmacol. 2016;190:372–386. doi:10.1016/j.jep.2016.06.061
6. Majdalawieh AF, Fayyad MW, Nasrallah GK. Anti-cancer properties and mechanisms of action of thymoquinone, the major active ingredient of Nigella sativa. Crit Rev Food Sci Nutr. 2017;57(18):3911–3928. doi:10.1080/10408398.2016.1277971
7. Imran M, Rauf A, Khan IA, et al. Thymoquinone: a novel strategy to combat cancer: a review. Biomed Pharmacother. 2018;106:390–402. doi:10.1016/j.biopha.2018.06.159
8. Mostofa A, Hossain MK, Basak D, Sayeed B, Shahdaat M. Thymoquinone as a potential adjuvant therapy for cancer treatment: evidence from preclinical studies. Front Pharmacol. 2017;8:295. doi:10.3389/fphar.2017.00295
9. Kabil N, Bayraktar R, Kahraman N, et al. Thymoquinone inhibits cell proliferation, migration, and invasion by regulating the elongation factor 2 kinase (eEF-2K) signaling axis in triple-negative breast cancer. Breast Cancer Res Treat. 2018;171(3):593–605.
10. Woo CC, Loo SY, Gee V, et al. Anticancer activity of thymoquinone in breast cancer cells: possible involvement of PPAR-γ pathway. Biochem Pharmacol. 2011;82(5):464–475. doi:10.1016/j.bcp.2011.05.030
11. Zhang L, Bai Y, Yang Y. Thymoquinone chemosensitizes colon cancer cells through inhibition of NF‑κB. Oncol Lett. 2016;12(4):2840–2845. doi:10.3892/ol.2016.4971
12. Samarghandian S, Azimi‐Nezhad M, Farkhondeh T. Thymoquinone‐induced antitumor and apoptosis in human lung adenocarcinoma cells. J Cell Physiol. 2019;234(7):10421–10431. doi:10.1002/jcp.27710
13. Ng WK, Saiful Yazan L, Yap LH, et al. Thymoquinone-loaded nanostructured lipid carrier exhibited cytotoxicity towards breast cancer cell lines (MDA-MB-231 and MCF-7) and cervical cancer cell lines (HeLa and SiHa). Biomed Res Int. 2015;2015:1–10. doi:10.1155/2015/263131
14. Taha M, Sheikh B, Salim L, et al. Thymoquinone induces apoptosis and increase ROS in ovarian cancer cell line. Cell Mol Biol. 2016;62(6):97–101.
15. Kou B, Liu W, Zhao W, et al. Thymoquinone inhibits epithelial-mesenchymal transition in prostate cancer cells by negatively regulating the GF-β/Smad2/3 signaling pathway. Oncol Rep. 2017;38(6):3592–3598.
16. Sarman H, Bayram R, Benek S. Anticancer drugs with chemotherapeutic interactions with thymoquinone in osteosarcoma cells. Eur Rev Med Pharmacol Sci. 2016;20(7):1263–1270.
17. Alobaedi OH, Talib WH, Basheti IA. Antitumor effect of thymoquinone combined with resveratrol on mice transplanted with breast cancer. Asian Pac J Trop Med. 2017;10(4):400–408. doi:10.1016/j.apjtm.2017.03.026
18. Odeh LH, Talib WH, Basheti IA. Synergistic effect of thymoquinone and melatonin against breast cancer implanted in mice. J Cancer Res Ther. 2018;14(9):324. doi:10.4103/0973-1482.235349
19. Khan A, Aldebasi YH, Alsuhaibani SA, Khan MA. Thymoquinone augments cyclophosphamide-mediated inhibition of cell proliferation in breast cancer cells. Asian Pac J Cancer Prev. 2019;20(4):1153. doi:10.31557/APJCP.2019.20.4.1153
20. Aumeeruddy MZ, Mahomoodally MF. Combating breast cancer using combination therapy with 3 phytochemicals: piperine, sulforaphane, and thymoquinone. Cancer. 2019;125(10):1600–1611. doi:10.1002/cncr.32022
21. Darakhshan S, Pour AB, Colagar AH, Sisakhtnezhad S. Thymoquinone and its therapeutic potentials. Pharmacol Res. 2015;95:138–158. doi:10.1016/j.phrs.2015.03.011
22. Shanmugam MK, Arfuso F, Kumar AP, et al. Modulation of diverse oncogenic transcription factors by thymoquinone, an essential oil compound isolated from the seeds of Nigella sativa Linn. Pharmacol Res. 2018;129:357–364. doi:10.1016/j.phrs.2017.11.023
23. Shanmugam MK, Ahn KS, Hsu A, et al. Thymoquinone inhibits bone metastasis of breast cancer cells through abrogation of the CXCR4 signaling axis. Front Pharmacol. 2018;9:1294.
24. Khan MA, Tania M, Fu J. Epigenetic role of thymoquinone: impact on cellular mechanism and cancer therapeutics. Drug Discov Today. 2019;24(12):2315–2322. doi:10.1016/j.drudis.2019.09.007
25. Feng L-M, Wang X-F, Huang Q-X. Thymoquinone induces cytotoxicity and reprogramming of EMT in gastric cancer cells by targeting PI3K/Akt/mTOR pathway. J Biosci. 2017;42(4):547–554. doi:10.1007/s12038-017-9708-3
26. Elmowafy EM, Tiboni M, Soliman ME. Biocompatibility, biodegradation and biomedical applications of poly (lactic acid)/poly (lactic-co-glycolic acid) micro and nanoparticles. Int J Pharm Investig. 2019;1–34.
27. Ramazani F, Chen W, van Nostrum CF, et al. Strategies for encapsulation of small hydrophilic and amphiphilic drugs in PLGA microspheres: state-of-the-art and challenges. Int J Pharm. 2016;499(1–2):358–367. doi:10.1016/j.ijpharm.2016.01.020
28. Allahyari M, Mohit E. Peptide/protein vaccine delivery system based on PLGA particles. Hum Vaccin Immunother. 2016;12(3):806–828. doi:10.1080/21645515.2015.1102804
29. Zhu S, Xing H, Gordiichuk P, Park J, Mirkin CA. PLGA spherical nucleic acids. Adv Mater. 2018;30(22):1707113. doi:10.1002/adma.201707113
30. Kalyane D, Raval N, Maheshwari R, Tambe V, Kalia K, Tekade RK. Employment of enhanced permeability and retention effect (EPR): nanoparticle-based precision tools for targeting of therapeutic and diagnostic agent in cancer. Mater Sci Eng. 2019;98:1252–1276. doi:10.1016/j.msec.2019.01.066
31. Liu Y, Sun D, Fan Q, et al. The enhanced permeability and retention effect based nanomedicine at the site of injury. Nano Res. 2020;1–6.
32. Acharya S, Sahoo SK. PLGA nanoparticles containing various anticancer agents and tumour delivery by EPR effect. Adv Drug Deliv Rev. 2011;63(3):170–183. doi:10.1016/j.addr.2010.10.008
33. Danhier F, Vroman B, Lecouturier N, et al. Targeting of tumor endothelium by RGD-grafted PLGA-nanoparticles loaded with paclitaxel. J Control Release. 2009;140(2):166–173. doi:10.1016/j.jconrel.2009.08.011
34. Doolaanea A, Harun AF, Mohamed F. Quantification of Nigella sativa oil (NSO) from biodegradable PLGA nanoparticles using FTIR spectroscopy. Int J Pharm Pharm Sci. 2014;6(10):228–232.
35. Azad AK, Al-Mahmood SMA, Chatterjee B, Wan Sulaiman WMA, Elsayed TM, Doolaanea AA. Encapsulation of black seed oil in alginate beads as a ph-sensitive carrier for intestine-targeted drug delivery: in vitro, in vivo and ex vivo study. Pharmaceutics. 2020;12(3):219. doi:10.3390/pharmaceutics12030219
36. Doolaanea AA, Mansor NI, Nor NHM, Shafri MABM, Mohamed F. Comparative assessment of plasmid DNA delivery by encapsulation within or adsorbed on poly (D, L-lactide-coglycolide) nanoparticles. Trop J Pharm Res. 2018;17(1):1–10. doi:10.4314/tjpr.v17i1.1
37. Salmani JM, Asghar S, Lv H, Zhou J. Aqueous solubility and degradation kinetics of the phytochemical anticancer thymoquinone; probing the effects of solvents, pH and light. Molecules. 2014;19(5):5925–5939. doi:10.3390/molecules19055925
38. Choi M, Briancon S, Andrieu J, Min S, Fessi H. Effect of freeze-drying process conditions on the stability of nanoparticles. Dry Technol. 2004;22(1–2):335–346. doi:10.1081/DRT-120028238
39. Albanese A, Chan WC. Effect of gold nanoparticle aggregation on cell uptake and toxicity. ACS Nano. 2011;5(7):5478–5489. doi:10.1021/nn2007496
40. Moore TL, Rodriguez-Lorenzo L, Hirsch V, et al. Nanoparticle colloidal stability in cell culture media and impact on cellular interactions. Chem Soc Rev. 2015;44(17):6287–6305. doi:10.1039/C4CS00487F
41. Park K. Prevention of nanoparticle aggregation during freeze-drying. J Control Release. 2017;248:153. doi:10.1016/j.jconrel.2017.01.038
42. Allison SD, Molina MC, Anchordoquy TJ. Stabilization of lipid/DNA complexes during the freezing step of the lyophilization process: the particle isolation hypothesis. Biochim Biophys Acta. 2000;1468(1–2):127–138. doi:10.1016/S0005-2736(00)00251-0
43. Krishnamoorthy L, Moorthy R, Umapathy D, Kannan M, Ganesan N, Arockiam A. Encapsulation of doxorubicin in PLGA nanoparticles enhances cancer therapy. Clin Oncol. 2017;2:1325.
44. Xiao XY, Zhu YX, Bu JY, Li GW, Zhou JH, Zhou SP. Evaluation of neuroprotective effect of thymoquinone nanoformulation in the rodent cerebral ischemia-reperfusion model. Biomed Res Int. 2016;2016:2571060. doi:10.1155/2016/2571060
45. Sharma N, Madan P, Lin S. Effect of process and formulation variables on the preparation of parenteral paclitaxel-loaded biodegradable polymeric nanoparticles: a co-surfactant study. Asian J Pharm Sci. 2016;11(3):404–416. doi:10.1016/j.ajps.2015.09.004
46. Gamucci O, Bertero A, Malvindi MA, et al. Detection of fluorescent nanoparticle interactions with primary immune cell subpopulations by flow cytometry. J Vis Exp. 2014;85.
47. Salvati A, Nelissen I, Haase A, et al. Quantitative measurement of nanoparticle uptake by flow cytometry illustrated by an interlaboratory comparison of the uptake of labelled polystyrene nanoparticles. NanoImpact. 2018;9:42–50. doi:10.1016/j.impact.2017.10.004
48. Danhier F, Ansorena E, Silva JM, Coco R, Le Breton A, Préat V. PLGA-based nanoparticles: an overview of biomedical applications. J Control Release. 2012;161(2):505–522. doi:10.1016/j.jconrel.2012.01.043
49. Liu H, Liu T, Li L, et al. Size dependent cellular uptake, in vivo fate and light–heat conversion efficiency of gold nanoshells on silica nanorattles. Nanoscale. 2012;4(11):3523–3529. doi:10.1039/c2nr30396e
50. Ohta S, Inasawa S, Yamaguchi Y. Real time observation and kinetic modeling of the cellular uptake and removal of silicon quantum dots. Biomaterials. 2012;33(18):4639–4645. doi:10.1016/j.biomaterials.2012.03.029
51. Rothen-Rutishauser B, Kuhn DA, Ali Z, et al. Quantification of gold nanoparticle cell uptake under controlled biological conditions and adequate resolution. Nanomedicine (Lond). 2014;9(5):607–621. doi:10.2217/nnm.13.24
52. Tahara K, Yamamoto H, Kawashima Y. Cellular uptake mechanisms and intracellular distributions of polysorbate 80-modified poly (D,L-lactide-co-glycolide) nanospheres for gene delivery. Eur J Pharm Biopharm. 2010;75(2):218–224. doi:10.1016/j.ejpb.2010.03.013
53. Benga G. Basic studies on gene therapy of human malignant melanoma by use of the human interferon beta gene entrapped in cationic multilamellar liposomes. 1. Morphology and growth rate of six melanoma cell lines used in transfection experiments with the human interferon beta gene. J Cell Mol Med. 2001;5(4):402–408.
54. Hatiboglu MA, Kocyigit A, Guler EM, et al. Thymoquinone induces apoptosis in B16-F10 melanoma cell through inhibition of p-STAT3 and inhibits tumor growth in a murine intracerebral melanoma model. World Neurosurg. 2018;114:e182–e90. doi:10.1016/j.wneu.2018.02.136
55. Xiong S, George S, Yu H, Damoiseaux R, France B, Ng KW. Size influences the cytotoxicity of poly (lactic-co-glycolic acid) (PLGA) and titanium dioxide (TiO(2)) nanoparticles. Arch Toxicol. 2013;87(6):1075–1086. doi:10.1007/s00204-012-0938-8
56. Chen H, Xie LQ, Qin J, et al. Surface modification of PLGA nanoparticles with biotinylated chitosan for the sustained in vitro release and the enhanced cytotoxicity of epirubicin. Colloids Surf B Biointerfaces. 2016;138:1–9. doi:10.1016/j.colsurfb.2015.11.033
57. Nafee N, Schneider M, Schaefer UF, Lehr C-M. Relevance of the colloidal stability of chitosan/PLGA nanoparticles on their cytotoxicity profile. Int J Pharm. 2009;381(2):130–139. doi:10.1016/j.ijpharm.2009.04.049
58. Welch MJ, Hawker CJ, Wooley KL. The advantages of nanoparticles for PET. J Nucl Med. 2009;50(11):1743–1746. doi:10.2967/jnumed.109.061846
 © 2020 The Author(s). This work is published by Dove Medical Press Limited, and licensed under a
Creative Commons Attribution License.
The full terms of the License are available at http://creativecommons.org/licenses/by/4.0/.
The license permits unrestricted use, distribution, and reproduction in any medium, provided the
original author and source are credited.
© 2020 The Author(s). This work is published by Dove Medical Press Limited, and licensed under a
Creative Commons Attribution License.
The full terms of the License are available at http://creativecommons.org/licenses/by/4.0/.
The license permits unrestricted use, distribution, and reproduction in any medium, provided the
original author and source are credited.