Back to Journals » HIV/AIDS - Research and Palliative Care » Volume 14
Flow-Cytometry Intracellular Detection and Quantification of HIV1 p24 Antigen and Immunocheckpoint Molecules in T Cells among HIV/AIDS Patients
Authors Tessema B ![]() , Boldt A, König B, Maier M, Sack U
, Boldt A, König B, Maier M, Sack U
Received 12 May 2022
Accepted for publication 22 July 2022
Published 4 August 2022 Volume 2022:14 Pages 365—379
DOI https://doi.org/10.2147/HIV.S374369
Checked for plagiarism Yes
Review by Single anonymous peer review
Peer reviewer comments 2
Editor who approved publication: Prof. Dr. Olubunmi Akindele Ogunrin
Belay Tessema,1– 3 Andreas Boldt,2 Brigitte König,3 Melanie Maier,4 Ulrich Sack2
1Department of Medical Microbiology, College of Medicine and Health Sciences, University of Gondar, Gondar, Ethiopia; 2Institute of Clinical Immunology, Faculty of Medicine, University of Leipzig, Leipzig, Germany; 3Institute of Medical Microbiology and Virology, Faculty of Medicine, University of Leipzig, Leipzig, Germany; 4Department of Virology, Institute of Medical Microbiology and Virology, Faculty of Medicine, University of Leipzig, Leipzig, Germany
Correspondence: Belay Tessema, Department of Medical Microbiology, College of Medicine and Health Sciences, University of Gondar, 196, Gondar, Ethiopia, Tel +251-91-930-6918, Email [email protected]
Introduction: HIV p24 antigen-positive T cells measured by flow cytometry (FCM) correlate directly with HIV viral load, inversely with CD4+ T cells, and decrease with antiretroviral therapy (ART). However, the sensitivity of FCM assays depends on the protocol of intracellular staining. Therefore, this study aimed to evaluate the diagnostic performance of our FCM protocol for detection of HIV p24-positive T cells and measure the level of immunocheckpoint molecules (PD1 and TIM3) in T cells.
Methods: The study was conducted at the University of Leipzig hospital between January 2020 and November 2020. Viremic and ART-suppressed HIV-positive patients and negative controls were included in this study. HIV1 p24 KC57-, p24 28B7-, PD1-, and TIM3-positive CD4 and CD3 T cells were analyzed from whole blood using a BD FACS Canto II flow cytometer equipped with FACSDiva software. HIV1 p24 antigen FCM results were compared with HIV1 RNA viral load results measured by Alinity M assays on the fully automated random-access platform. We analyzed the data using SPSS 20.
Results: The absolute CD4+ and CD4+:CD8+ T-cells ratio showed a significant inverse correlation with HIV1 viral load. Moreover, the absolute CD4+ T-cells count showed a significant inverse correlation with p24 KC57-positive CD4 T cells. The percentage of p24 KC57, p24 28B7, and double-positive CD4 T cells showed significant correlation with HIV1 viral load. PD1 expressing CD4 T cells were higher in ART-viremic cases than controls, while TIM3-expressing CD4 T cells were lower in ART-viremic cases than controls. Sensitivity, specificity, PPV, and NPV of p24 KC57-positive CD4 T cells were 64%, 82%, 78%, and 69%, respectively, for the diagnosis of HIV infection and 55%, 73%, 40%, and 83%, respectively, for treatment monitoring.
Conclusion: Our protocol showed moderate performance for the diagnosis of HIV infection and treatment monitoring. Therefore, the p24 KC57 but not the p24 28B7 clone could be considered as a simple alternative method for rapid diagnosis of HIV infections and treatment monitoring, particularly in low- and middle-income countries.
Keywords: human immunodeficiency virus, flow cytometry, HIV p24 KC57, HIV p24 28B7, PD1, TIM3, diagnosis, treatment monitoring
Introduction
According to a World Health Organization (WHO) report, an estimated 1.5 million people newly infected with HIV in 2020.1 There has been significant progress globally toward the Fast-Track 90–90–90 targets of the HIV-testing, -treatment, and -suppression cascade. Based on the report, 84% of people living with HIV knew their HIV status at the end of 2020. Of the 37.7 million people living with HIV (PLWH), 73% were receiving antiretroviral therapy (ART). Around 66% globally had suppressed viral loads. Nevertheless, progress has been uneven, and coverage among key populations is low. Children are not being adequately reached either, and the world has failed to diagnose and start treatment for almost half the children living with HIV. Only 54% of children (0–14 years old) were receiving ART.1
HIV infection may remain asymptomatic for many years or may progress rapidly to AIDS. The median interval from initial infection with HIV to development of AIDS may exceed 10 years or longer.2 In general, the “window period”, the time from the initial HIV infection until HIV-antibody detection in plasma ranges from a few weeks to several months.3–5 During this period, plasma viremia and antigenemia occur,6–8 and the number of HIV-infected cells may be as high as those found in patients with AIDS.8
A previous cohort study on HIV-exposed health-care workers (HCWs) showed that a majority of infected HCWs seroconvert within 2 months of exposure; however, 5% of infected HCWs were estimated to seroconvert after 6 months of exposure. In contrast, the period of viremia (detectable by p24 antigen or RNA assays) preceding antibody seroconversion is consistently 1–3 weeks.9 Therefore, rapid antibody testing as a diagnostic option may require several months before the HIV antibodies can be detected; however, HIV p24-antigen tests provide an advantage for early HIV-antigen detection.
Improved testing methods, including early detection of infection, better test accuracy, increased self-testing, and robust linkage to care, have all been highlighted as key areas for improvement.10–12 Early detection has been proven to allow for better patient outcomes and lower rates of transmission.13,14 The use of dry blood spots to transfer blood samples to distant high-throughput laboratories and the urgent need for simple, more accessible, and inexpensive pathogen-based point of care (PoC) tests for early diagnosis of HIV and treatment monitoring, especially in resource-limited settings, remains challenging.15–17
Previous reports have shown that plasma HIV1 RNA measured by PCR increases with advanced disease stage and declines during ART. The HIV1 RNA level is also inversely related with absolute CD4 T-cell counts.18,19 PCR is much more sensitive than plasma p24-antigen detection and end-point dilution culture, but it is laborious, time-consuming and expensive, especially for low- and middle-income countries. Methods that detect and quantify virus-infected T cells from whole blood or peripheral blood mononuclear cells may provide a more practical and rapid way to diagnose HIV infection, better predict disease progression, and monitor therapy. p24 antigen–positive T cells in HIV+ patients by flow-cytometry assays20 have confirmed the PCR results by demonstrating the direct correlation of intracellular p24 antigen with disease stage, inversely with CD4+ T-cell counts, and its reduction during ART treatment.21 However, the sensitivity of intracellular detection of p24 antigen in T cells is highly dependent on the intracellular staining protocol, including the method of fixation and permeabilisation.22 Therefore, this study aimed to validate and evaluate the diagnostic performance of our own flow-cytometry assay protocol for intracellular detection and quantification of HIV-specific protein (gag p 24)–positive T cells.
In HIV infection, immunocheckpoint molecules (ICM) expression in CD4 T cells has been linked to HIV-reservoir measurements23 and time to viral rebound following ART interruption.24 In the presence of abundant data related to ICM expression in T cells, which are essential for reducing immune-cell activation, the expression patterns and distribution of ICM are critical to understanding adaptive cellular immunoresponses in PLWH. Studies have been conducted to define the interactions between HIV and ICMs. The ICMs PD1 and TIM3 among others have been involved in chronic viral persistence and are usually used as a marker to define exhausted T cells during HIV infection.23–29 A recently published work showed that PDL1 expression on monocytes was significantly higher in tuberculosis, HIV, and tuberculosis–HIV coinfected patients than healthy controls.30
T-cell exhaustion markers, such as PD1, TIM3, and LAG3, measured prior to ART have been proposed to strongly predict time of viremia rebound.24 However, reports on the relationship between HIV viral load and PD1 and TIM3 expression on the surface of T cells are conflicting. Therefore, this study was conducted to measure the relationship between HIV viral load and ICM (PD1 and TIM3) expression on the surface of T cells by flow-cytometry assays using an objective gating strategy in ART-viremic and ART-suppressed HIV-positive patients compared with HIV-uninfected controls.
Methods
Study Design, Setting, and Period
This laboratory-based evaluation study was conducted at the Institute of Clinical Immunology and Institute of Virology, University of Leipzig Hospital, Leipzig, Germany between January 2020 and November 2020. PLWH who had laboratory investigations at the institute’s laboratory for viral load determination and laboratory for immunostatus evaluation during the study period were included. PLWH on ART and prior to ART initiation were included. PLWH were grouped into two categories based on the HIV viral load results as ART-viremic (HIV viral load >50 copies/mL) and ART-suppressed (HIV viral load ≤50 copies/mL). HIV-negative individuals screened for HIV during the study period were included as a negative control.
Ethics
The leftover blood samples after HIV viral load determination were anonymously used for this study in accordance with the ethics approval obtained from the Medical Faculty of the University of Leipzig ethics committee (351/17-ek). Consent was obtained from the Institute of Virology to use the leftover blood samples and viral load results, and from the Institute of Clinical Immunology to use absolute CD3, CD4, and CD8 T cells and CD:CD8 ratio data of study participants.
Blood-Sample Collection
Venous blood samples collected in 5 mL vacutainer tubes with EDTA and sent to the laboratory for viral load determination were used for HIV p24 detection and ICM-expression measurement after plasma had been separated for viral load determination. The leftover concentrated blood samples were resuspended by adding PBS to compensate for the plasma removed from the whole blood. Then, the samples were processed according to our optimized intracellular staining protocol for detection and quantification of HIV p24-positive CD3+ and CD4+ T cells and for the measurement of ICM expression in CD3+ and CD4+ T cells.
Antibodies
In this study, we used three fluorochrome-labeled surface-marker antibodies: CD3 V500 (1,032,587) for CD3+ T cells, CD4 V450 (10,556,120) for CD4+ T cells, and CD8 PerCP (1,035,212) for CD8+ T cells from BD Bioscience. We also used two clones of HIV1 p24 monoclonal antibodies: p24 FITC (clone KC57) from Beckman Coulter (6,604,665) and p24 APC (clone 28B7) from MediMabs (MM-0289-APC). We also used antibodies of the two ICMs: PD1 PE (clone eBioJ105 (J105) from Invitrogen (2–2799-42), and TIM3 PE-cy7 (clone F38-2E2) from Thermo Fisher Scientific, eBioscience (15,518,536).
Intracellular Staining
Our intracellular staining protocol comprised treating, permeabilizing, and staining the cells followed by flow-cytometry analysis. In brief, thewhole blood (200 μL) was used to lyse erythrocytes and fix leukocytes using prewarmed Lyse/Fix buffer (BD Bioscience,0356756) in a 37°C water bath. The cells were washed with PBS through centrifugation at 600 g for 6 minutes. Fixed cells were permeabilized by adding 1 mL cold Perm Buffer III (BD Bioscience, 1,029,766) on ice for 30 minutes. Cells washed with stain buffer (500 mL PBS + 2.5 mL FBS + 5 mL NaN3) via centrifugation at 600 g for 6 minutes. Permeabilized cell suspensions (100 μL) were transferred into 12×75 mm tubes and stained using monoclonal antibodies for 1 hour at room temperature protected from light. The following amounts of antibodies were used for the staining of the cells: anti–surface marker — 2.5 µL CD3 V500 and 2.5 µL CD4 V450; anti-HIV p24 — 5 µL p24 FITC (clone KC57) and 5 µL p24 APC (clone 28B7, 1:800 diluted working solution); and anti-ICM — 5 µL PD1-PE (clone eBioJ105 [J105]) and 5 µL TIM3-PE-cy7 (clone F38-2E2). Stained cells were washed with stain buffer via centrifugation at 600 g for 6 minutes and measured by flow cytometry immediately.
Flow-Cytometry Assays
Stained cells were measured using a BD FACS Canto II flow cytometer equipped with FACSDiva 8.0 (BD Biosciences) until 30,000 CD3+ T cells were acquired. Stepwise gating and analysis of HIV p24 KC57- and p24 28B7-positive CD4 and CD3 T cells were done as shown in Figure 1.Gating and analysis of ICM (PD1 and TIM3)–positive CD3 and CD4 T-cell populations were performed using the objective gating strategy.31 In brief, highly positive ICM CD4+ or CD3+ T cells were gated as follows. First, to remove the outliers that might skew the-positioning of the gate, the top 0.1% and the bottom 0.1% of positively stained cells in terms of fluorochrome brightness were excluded, leaving 99.8% of the total (the “trimmed” cell population; Figure 2: P7, P9, P11 and P13). Next, the brightest and dimmest remaining cells were individually gated and median fluorescence intensity (MFI) obtained for each. The dimmest MFI was subtracted from the brightest MFI to obtain the trimmed fluorescence range. Then, 90% of this fluorescence range was identified by multiplying it by 0.9, as shown in Figure 2: P8, P10, P12 and P14.
 |
Figure 1 Demonstration of the stepwise gating strategy for sorting and identification of HIV p24-positive CD4+ T cells using an HIV-positive (HIV viremic) patient’s blood (A–E) and HIV-negative control blood sample (F–J). (A and F) (P1) = total lymphocytes; (B and G) (CD3+)= CD3+ T cells; C and H (Q1) = CD3+ CD4- T cells; C and H (CD4+) = CD4+ T cells; D (Q1-2) and I (Q1-3) = gates for HIV p24 (clone 28B7) positive CD4+ T cells; D (Q4-2) and I (Q4-3) = gates for HIV p24 (clone KC57) positive CD4+ T cells; D (Q2-2) and I (Q2-3) = gates for both HIV p24 28B7 and HIV p24 KC57 positive (double-stained) CD4+ T cells; F = analysis output of HIV-positive patient’s blood that shows the percentage of HIV p24-positive CD3+CD4– T cells (Q1-1 = p24 28B7, Q4-1 = p24 KC57, Q 2–1 = double-stained cells) and CD4+ T cells (Q1-2 = p24 28B7, Q4-2 = p24 KC57, Q 2–2 = double-stained cells); J = analysis output of HIV-negative person’s blood that shows the percentage of HIV p24-positive CD3+CD4– T cells (Q1-1 = p24 28B7, Q4-1 = p24 KC57, Q2-1 = double-stained cells) and CD4+ T cells (Q1-3 = p24 28B7, Q4-3 = p24 KC57, Q2-3 = double-stained cells). |
 |
Figure 2 Demonstration of the objective-based gating strategy for sorting and quantification of immunocheckpoint molecules (ICMs) (PD1 and TIM3)-positive CD3+ and CD4+ T cells from an HIV-positive ART-suppressed patient’s whole blood. The objective gating and quantification of ICM-positive cells were done based on the fluorescence intensity of PD1 or TIM3-positive CD3+ and CD4+ T cells in a stepwise approach. P1 = total lymphocytes; CD3+ = CD3+ T cells; Q1 = CD3+ CD4– T cells; Q2 = CD4+ T cells; P3 = PD1+ CD3+ T cells; P7= the top 99.8% of PD1+CD3+ T cells after outliers removed (trimmed cells); P8 = the top 90% of the fluorescence range of PD1+CD3+ T cells of the trimmed cells. P4 = TIM3+ CD3+ T cells; P9 = the top 99.8% of TIM3+CD3+ T cells after outliers removed; P10 = the top 90% of the fluorescence range of PD1+CD3+ T cells of the trimmed cells. P5 = PD1+ CD4+ T cells; P11 = the top 99.8% of PD1+CD4+ T cells after outliers removed; P12 = the top 90% of the fluorescence range of PD1+CD4+ T cells of the trimmed cells. P6 = TIM3+ CD3+ T cells; P13 = the top 99.8% of TIM3+CD3+ T cells after outliers removed; P14 = the top 90% of the fluorescence range of TIM3+CD3+ T cells of the trimmed cells. |
HIV Viral Load Determination
HIV viral load results of study participants were retrieved from the virology laboratory. HIV1 RNA extraction and viral quantification was done using HIV1 assays on the fully automated random-access platform Alinity M (Abbott Molecular, Des Plaines, IL, USA). The assays utilized dual-target and dual-probe design against highly conserved regions of the integrase and LTR gene with sensitivity of 14 copies/mL. Viral load assessment was done according to the European AIDS clinical society guidelines.32 ART success is defined as the ability to achieve and maintain a viral load <50 copies/mL. A viral load ≥50 copies/mL confirmed at two consecutive time points after complete suppression is considered a rebound and indicative of virological failure if therapy adherence is confirmed and therapy interactions excluded. In this study, patients with viral load <50 copies/mL were grouped as ART-suppressed, while patients with viral load ≥50 copies/mL were grouped as ART-viremic.
Absolute CD3, CD4, and CD8 counts and CD4:CD8 T-Cell Ratio Determination
Absolute CD3, CD4, and CD8 T-cell counts and CD4:CD8 T-cell ratios of study participants were retrieved from the immunology laboratory. For determination of absolute T-cell counts, the relative flow-cytometry T-cell counts following surface-marker staining using the CD3 V500 (2.5 µL) for CD3+ T cells, CD4 V450 (2.5 µL) for CD4+ T cells, and CD8 PerC (5 µL) for CD8+ T cells analyzed with a BD FACS Canto II flow cytometer equipped with FACSDiva software were set in relation to absolute lymphocyte counts measured using a Sysmex XP-300 automated hematology analyzer (Sysmex, Bornbarch, Germany) following standard procedures.
Statistical Analysis
Data were analyzed using SPSS 20. The normal distribution of the data was checked with the Shapiro–Wilk test, kurtosis Z-values and skewness, and visual outputs, including box plots, histograms, and normal Q–Q plots. For abnormally distributed data, nonparametric tests were used, and medians and IQRs are presented. Correlations were determined using nonparametric Spearman’s test. Receiver-operating characteristic (ROC) curves were generated to compute the area under the curve (AUC) and coordinates of the curve. Optimal cutoffs for HIV p24 KC57 and HIV p24 28B7 were determined based on the results of sensitivity and 1 – specificity of the coordinates of the ROC curve. Cross-tabulation was used to calculate sensitivity, specificity, positive predictive value (PPV), and negative predictive value (NPV) for HIV p24 KC57 and HIV p24 28B7 tests. P<0.05 was considered statistically significant.
Results
Characteristics of Study Participants
A total of 55 study participants were included in this study. Eleven were ART-viremic, 33 ART-suppressed, and 11 age- and sex-matched negative controls. A majority (49, 89%) were male. The median (IQR) age was 51 (34–61) years for ART-viremic cases, 48.5 (35.3–57.8), for ART-suppressed cases, and 50 (34.5–77.5) for controls. The median (IQR) HIV1 viral load among ART-viremic patients was 4,615 copies/mL (333.0–1,221,500.0 copies/mL). The median (IQR) HIV1 viral load among ART-suppressed cases was 0 copies/mL (0–10 copies/mL). The absolute CD4+ T-cell count and CD4:CD8 T-cell ratio showed statistically significant inverse correlations with HIV1 viral load (P=0.039 and 0.044, respectively). Absolute CD4+ T-cell counts showed significant inverse correlations with p24 KC57-positive CD4 T cells (P=0.004, Table 1).
 |
Table 1 Characteristicsof study participants by HIV status and correlations with viral load and p24 KC57-positive CD4 T cells (n=55) |
Percentage of HIV1 p24 Antigen-Positive CD4+ and CD3+ T cells
The median (IQR) percentage of p24 KC57-positive CD4+ T cells was 0.3 (0.1–0.8) among ART-viremic cases and 0.1 (0.1–0.3) among ART-suppressed patients. The median (IQR) percentage of p24 28B7 and double-stained (p24 KC57- and p24 28B7-positive) CD4+ T cells were low in both ART-viremic and ART-suppressed cases. The percentage of p24 KC57, p24 28B7, and double-stained CD4+ T cells showed significant correlations with HIV1 viral load (P=003, 0.014, and <0.001, respectively). The median (IQR) percentage of p24 KC57 antigen-positive CD3+ T cells was lower than that of CD4+ T cells in both ART-viremic and ART-suppressed cases (Table 2).
 |
Table 2 Percentage of HIV1 p24-antigen-positive CD4+ and CD3+ T cells by HIV status and their correlation with HIV viral load (n=55) |
Relationship Between Immunocheckpoint Molecules and HIV Viral Load
PD1 ICM–expressing CD4+ T cells were higher in ART-viremic cases (median 29) than controls (median 28). Similarly, PD1-expressing CD3+ T cells were higher in ART-viremic cases (median 52) than controls (median 51). However, the correlations between HIV1 viral load and PD1-expressing CD4+, and CD3+ T cells were not statistically significant (P=0.702 and 0.123, respectively). On the contrary, TIM3-expressing CD4+ T cells were lower in ART-viremic cases (median 50) than controls (median 65). TIM3-expressing CD3+ cells were also lower in ART-viremic cases (median 44) than controls (median 59). TIM3-expressing CD4+ and CD3+ T cells were not significantly correlated with HIV1 viral load (P=0.933 and 0.604, respectively, Table 3).
 |
Table 3 Percentage of immunocheckpoint molecule–positive CD4+ and CD3+ T cells by HIV status (n=55) |
ROC Curves of p24 KC57- and p24 28B7-Positive CD4+ T cells
ROC curves of p24 KC57- and p24 28B7-positive CD4+ T cells for HIV-positive cases and controls are shown in Figure 3. The AUC of p24 KC57-positive CD4+ T cells among ART-viremic cases versus controls was 0.84 (95% CI 0.67–1.00). This indicates the accuracy of p24 KC57-positive CD4+ T cells to correctly discriminate ART-viremic cases from controls was good. The AUC of p24 KC57-positive CD4+ T cells among ART-suppressed cases versus controls was fair — 0.75 (0.58–0.92) — while that among ART-viremic versus ART suppresessed was poor: 0.63 (0.44–0.83).
 |
Figure 3 Receiver-operating characteristic (ROC) curves for HIV1 p24 KC57- and p24 28B7-positive CD4+ T cells drawn from sensitivity versus 1 – specificity using HIV-positive cases and controls showing the performance of a test at all classification thresholds. AUC = area under the ROC curve. The AUC provides an aggregate measure of performance of a test across all possible classification thresholds, and here indicates the accuracy of HIV1 p24 KC57 and p24 28B7 antigens to correctly classify ART-viremic and ART-suppressed HIV-positive cases from controls as well as ART-viremic from ART-suppressed HIV-positive cases. An AUC of 1 represents a perfect test; 0.9–1 = excellent; 0.8–0.9 = good; 0.7–0.8 = fair; 0.6–0.7 = poor; 0.5–0.6= fail, and 0.5 represents a worthless test. Abbreviation: CI, confidence interval. |
The AUC of p24 28B7-positive CD4+ T cells was 0.62 (95% CI 0.38–86) among ART-viremic cases vs controls and 0.66 (0.45–87) among ART-viremic vs ART-suppressed cases. These indicate the accuracy of p24 28B7 CD4 T cells to correctly discriminate ART-viremic cases from controls as well as ART-suppressed cases being poor. The AUCs of double-stained (p24 KC57 and p24 28B7) CD4+ T cells and PD1- and TIM3-expressing CD4+ T cells were <0.6, indicating failure of the tests to be used for diagnosis and treatment monitoring. Similarly, the AUC of p24 28B7-positive CD4+ T cells was 0.48 among ART-suppressed cases versus controls, indicating this test is worthless to use for detection of HIV among ART-suppressed patients (data not shown).
Optimal Cutoffs and Diagnostic Performance of HIV p24 KC57- and p24 28B7-Positive CD4+ T cells
Optimal cutoffs, sensitivity, specificity, PPV, and NPV of p24 KC57- and p24 28B7-positive CD4+ T cells of ART-viremic versus controls, ART-suppressed versus controls, and ART-viremic versus ART-suppressed are presented in Table 4. Optimal cutoffs of p24 KC57 and p24 28B7 antigen–positive CD4+ T cells were identified based on the results of sensitivity and 1 – specificity of the coordinates of the ROC curve. The optimal cutoff of p24 KC57-positive CD4+ T cells among ART-viremic cases versus controls and ART-suppressed cases versus controls was 0.2%, that among ART-viremic versus ART-suppressed 0.3%, and that for p24 28B7-positive CD4+ T cells among ART-viremic versus controls and ART-viremic versus ART-suppressed cases was 0.1%.
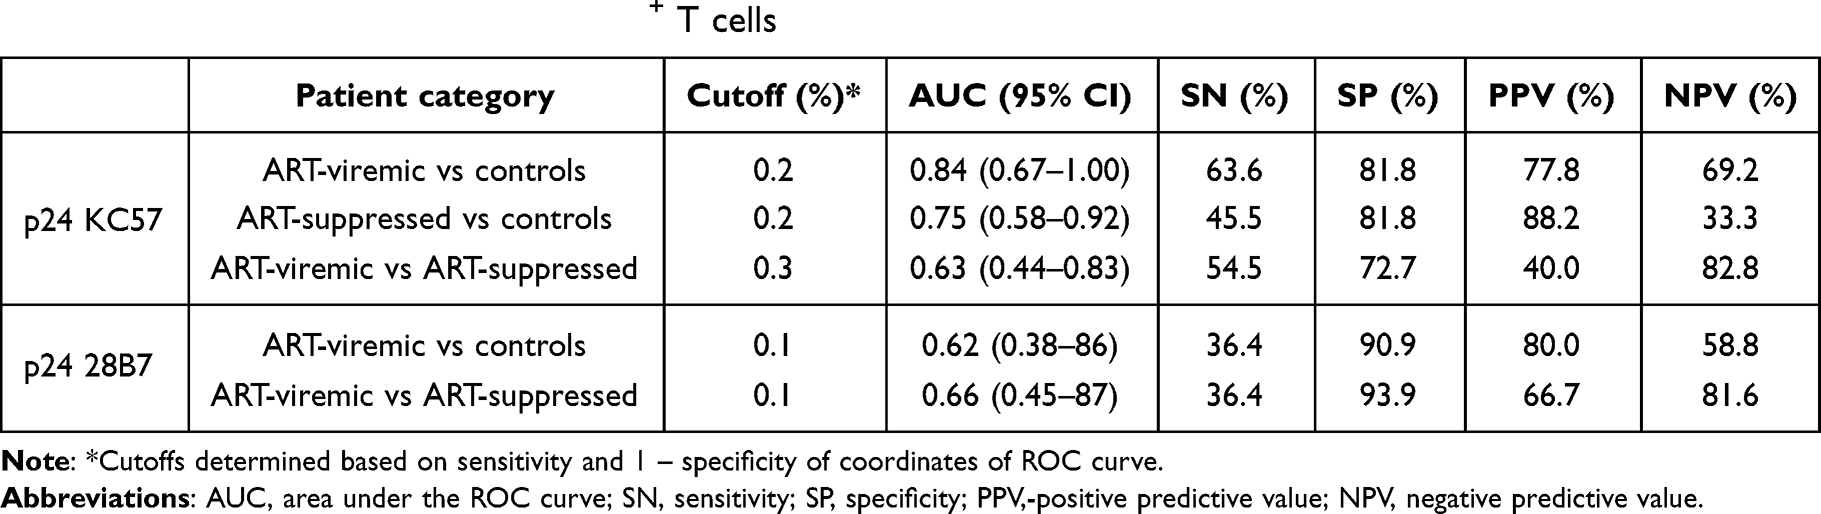 |
Table 4 Optimum cutoff, sensitivity, specificity,-positive predictive value, and negative predictive value of HIV1 p24 KC57 and p24 28B7 antigen-positive CD4+ T cells |
The sensitivity, specificity, PPV, and NPV of p24 KC57-positive CD4+ T cells for the diagnosis of HIV infection in ART-viremic cases versus controls were 64%, 82%, 78%, and 69%, respectively. Similarly, the sensitivity, specificity, PPV, and NPV of p24 KC57-positive CD4+ T cells for the diagnosis of HIV The sensitivity, specificity, PPV, and NPV of p24 KC57-positive CD4+ T cells for monitoring of treatment response of HIV/AIDS patients in ART-viremic versus ART-suppressed cases were 55%, 73%, 40%, and 83%, respectively. p24 28B7-positive CD4+ T cells showed low sensitivity (36%) and high specificity (>90%) for the diagnosis of HIV infection and monitoring of treatment response of HIV/AIDS patients.
Discussion
This study was conducted to validate and evaluate the performance of a simple and rapid flow-cytometry assay protocol for detection and quantification of intracellular HIV1 p24 antigen and ICMs in T cells from whole-blood samples of PLWH. We wanted to assess the capability of our protocol to improve the diagnosis of PLWH and monitor therapy response. Unlike previous flow-cytometry assays that examined peripheral blood mononuclear cells33 or leukocytes separated from whole blood by dextran sedimentation,34 we directly stained leukocytes in whole blood with monoclonal antibodies after lysing erythrocytes and fixing leukocytes and permeabilized the leukocytes. The use of directly conjugated antibodies and whole-blood samples in this study simplified the procedure and shortened assay turnaround.
The results of this study demonstrated that absolute CD4-T cell count and CD4:CD8 T-cell ratio had statistically significant inverse correlations with HIV viral load and p24 KC57-positive CD4 T cells. These findings indicate that absolute CD4+ T-cell numbers and CD4:CD8 T-cell ratio are important markers of disease progression and treatment response. Similarly, previous studies using cell sorting and PCR have demonstrated a strong inverse correlation between the number of CD4+ T cells and viral load in peripheral blood.18,35 Other studies have also shown low numbers of CD4+ lymphocytes in the peripheral blood at later stages of the disease after dissemination of HIV+ CD4+ T cells from the lymphoid organs.36–38
The percentage of p24 KC57, p24 28B7, and double-stained CD4+ T cells showed significant direct correlation with HIV1 viral load. The median percentage of p24 KC57 antigen when gated on CD4+ T cells was higher than the percentage when gated on CD3+ T cells in both ART-viremic and ART-suppressed cases. Previous studies using flow-cytometry assay have reported similar correlation of p24 antigen with HIV viral load and advanced stages of HIV/AIDS.33,39 Disease progression in AIDS is characterized by decrease in antibodies to the p24 antigen and CD4-positive T cells, and increase in serum neopterin levels and p24 antigenemia.40 It is thought by some that an increase in p24 antigenemia may precede the decline in antibodies to the p24 antigen.41 However, accurate detection of p24 antigenemia in serum or plasma has always been hindered by the presence of immunocomplexes consisting of antibodies to p24 and p24 antigen.42,43 It has been demonstrated that these immunocomplexes form shortly after antibodies to HIV are made, usually 4–12 weeks after infection.44 Therefore, over most of the course of the disease, the presence of antigenemia in plasma is masked by the presence of immunocomplexes, and the current modes of detection — antigen-capture ELISAs and PoC lateral flow tests — may underestimate the amount of antigen present in peripheral blood. In our Intracellular staining flow-cytometry assay protocol, the problem of immunocomplexes is avoided by removing antibodies, soluble antigens, and immunocomplexes through rigorous washing steps and focusing on the antigens present in the infected cells.
We measured the levels of PD1 and TIM3 expression on CD3 and CD4 T cells in ART-viremic and ART-suppressed HIV-infected cases compared with HIV-uninfected controls. ICMs contribute to the regulators of T-cell immunoresponses in response to invading pathogens by regulating the balance between costimulatory and inhibitory signals.45,46 During chronic viral infections, where the immune system is consistently stimulated by antigens, ICMs can serve as a blockade to effective immunoresponses. In response to acute viral infection or recognition of antigens, ICMs are upregulated and expressed on the cell surface as a mechanism to shut down T-cell activation, thereby preventing unwanted results of chronic activation. Their expression on T cells has been implicated in dysfunctional immunoresponses against chronic diseases, such as HIV infection. Long-term suppression of HIV with ART leads to normalization of ICM expression on T cells.28,47–50
PD1-expressing CD4+ T cells were higher in ART-viremic and ART-suppressed cases than HIV uninfected controls. Similarly, PD1-expressing CD3+ T cells were higher in HIV-positive cases (ART-viremic and ART-suppressed) than controls. However, the correlations between HIV1 viral load and PD1-expressing CD4+ and CD3+ T cells were not statistically significant. In previous studies, PD1 showed significantly higher expression in CD4 and CD8 T cells of HIV-positive individuals compared to healthy controls.51 PD1 expression has been associated with disease progression when expressed on HIV-specific T cells, as measured by CD4+ T-cell count and viral load, and might thus be used as a disease-severity marker.52,53 Sustained HIV viremia and high antigen load might be responsible for the high levels of PD1 expression.54 Both repeated antigen exposure and the accessory HIV protein Nef can elevate PD1 expression in vitro.55
On the contrary, TIM3-expressing CD4+ and CD3+ T cells were lower in ART-viremic cases than HIV-uninfected controls in our study. Nevertheless, TIM3-expressing CD4+ and CD3+ T cells were not significantly correlated with HIV1 viral load. Contradictory results have been reported for TIM3 expression on HIV-specific T cells. High TIM3 amounts were detected on HIV-specific CD4+ T cells,27 whereas on HIV-specific CD8+ T cells, negligible expression was found.48 However, Jones et al reported increased amounts of TIM3 on HIV-specific CD8+ T cells in progressive HIV infection, and those cells showed a lack of proliferation markers and cytokine production in response to HIV-specific antigens ex vivo. Addition of an antibody blocking TIM3 signaling restored the functionality of CD8+ T cells and improved their expansion.56 Jones et al also reported a decline in TIM3 levels in PLWH on ART. Another study also reported that HIV had no effect on TIM3 expression in CD4 and CD8 T cells.51
The controversial reports on the level of TIM3 expression on T cells compared with HIV viral load might be due to differences in the intracellular staining protocols and gating strategies employed in the studies. The observed lower level of TIM3 expression in ART-viremic patients compared with controls in our study might be due to high expression of the HIV1 Vpu molecule, which downregulates the expression of TIM3 on the surface of HIV-infected CD4+ T cells. The molecular determinants of HIV1 that modulate cell-surface TIM3 levels have been reported by Prévost et al.57 Their study showed that HIV1 Vpu downregulates TIM3 from infected primary CD4+ T-cell surfaces, thus reducing HIV1-induced upregulation of TIM3. The study also delivered evidence that Vpu is in close proximity to TIM3 and changes its subcellular localization by directing it to Rab5-positive vesicles and targeting it for sequestration inside the trans-Golgi network.
We demonstrated that the accuracy of p24 KC57-positive CD4+ T cells to correctly discriminate ART-viremic cases from controls was good. Sensitivity, specificity, PPV, and NPV for the diagnosis of HIV infection were 64%, 82%, 78%, and 69%, respectively. The accuracy of p24 KC57-positive CD4+ T cells to discriminate ART-viremic from ART-suppressed was poor. Sensitivity, specificity, PPV, and NPV for monitoring of treatment response of HIV/AIDS patients were 55%, 73%, 40%, and 83%, respectively. The p24 28B7-positive CD4+ T cells showed poor accuracy to discriminate ART-viremic cases from controls and ART-suppressed cases. The p24 28B7-positive CD4+ T cells showed low sensitivity (36.4%) and high specificity (>90%) for diagnosis of HIV infection and monitoring of treatment response of PLWH. Similarly, a study by Pardons et al demonstrated that in untreated individuals, the frequency of p24-producing cells detected by flow-cytometry assays was strongly correlated with plasma viral load. In ART-suppressed individuals, p24-producing cells were only detected upon stimulation. They also showed that by combining two p24-antibody clones (p24 KC57 and p24 28B7) targeting the HIV capsid in a standard intracellular staining protocol, p24-producing cells can be detected with high specificity and sensitivity in the blood from PLWH.58
While laboratory-based nucleic acid–amplification tests and rapid antibody PoC tests for HIV dominate the diagnostics market, the viral capsid protein p24 is recognized as an alternative early virological biomarker of infection. Although there are a number of laboratory-based automated systems for detection of p24 antigen on the market, only one PoC assay in rapid diagnostic test (RDT) format (Alere Determine HIV1/2 Ag/Ab) exists for detection of the p24 antigen. Most of the current automated laboratory-based assays for detection of p24 show sensitivity and specificity approaching 100%. However, the automated laboratory tests are complex and automated equipment–intensive ELISA-type assays.
The Alere Determine HIV1/2 Ag/Ab has shown much more variable performance depending on the population groups tested. Previous studies have reported poor HIV1 p24 antigen sensitivity for the RDT, ranging from 10% to 65%.59–61 Specificity is insufficient for this test to be useful as a screening test, with too many false positives generated, particularly in low-prevalence settings.62–64 The Alere Determine HIV1/2 Ag/Ab until recently was the sole “fourth generation” lateral flow PoC assay and has now been replaced by the Alere Determine HIV1/2 Ag/Ab Combo. Several studies have recently investigated the performance of the new RDT to detect infection in p24 antigen-positive serum samples and showed low sensitivity (<30%),65,66 while other groups demonstrated higher sensitivity rates of >85%.67–69
In general, our flow-cytometry assay protocol showed moderate diagnostic performance that was lower than automated assays, but higher than the Alere Determine HIV1/2 Ag/Ab lateral flow PoC assays. Flow-cytometry assays allow detection and quantification of large numbers of HIV-infected T cells, making them a desirable tool for diagnosis of HIV infection and treatment-response monitoring. In our assay protocol, only 0.4 mL whole blood was required for the analysis, and the test result can be available in <3 hours. Therefore, we believe that our flow-cytometry protocol is a practically feasible, simple, and rapid test for diagnosis of HIV infections and treatment monitoring in newborn babies who have been delivered by mothers who are HIV-seropositive and in children and adults, especially in low- and middle-income countries, where laboratory-based automated assay systems are not accessible.
Limitations
We acknowledge several limitations of this study. First, the initial installation and maintenance of flow cytometry is costly. However, this technology is already employed in resource-limited settings for the purpose of CD4 T-cell counts for monitoring HIV-treatment response and to decide treatment initiation for PLWH. Moreover, some of the buffers, like the permeabilization buffer, can be made in-house to reduce the costs. Second, the small sample of HIV-positive individuals enrolled in this study my limit our conclusions. Third, we did not measure the changes in the number of p24 antigen-positive CD4+ T cells in ART-naïve and ART-viremic PLWH at different time interval after ART had started to evaluate its role in treatment-response monitoring.
Conclusion
This study demonstrated that absolute CD4+ T cell counts and CD4:CD8 T cell ratio are important markers of disease progression and treatment response. The percentage of p24 KC57, p24 28B7, and double antibody–stained T cells showed significant correlation with HIV1 viral load. PD1-expressing CD4+ and CD3+ T cells were higher in ART-viremic cases than HIV-uninfected controls. On the contrary, TIM3 expressing CD4+ and CD3+ T cells were lower in ART-viremic cases than controls. Nevertheless, both PD1- and TIM3-expressing CD4+ and CD3+ T cells were not significantly correlated with HIV1 viral load. Our flow-cytometry assay protocol showed higher diagnostic performance than the Alere Determine HIV1/2 Ag/Ab lateral flow PoC assays, but lower than automated assays. Our flow-cytometry intracellular staining protocol may be considered as a useful alternative, practically feasible, simple, and rapid test for diagnosis of HIV infection and monitoring therapy response in newborn babies, children, and adults, especially in low- and middle-income countries. We recommend future studies to determine whether various HIV clade–infected T cells can be recognized by these antibodies to detect HIV p24 antigen.
Acknowledgments
The authors would like to thank Katrin Bauer and Bettina Glatte for their contributions to the measurement of absolute CD4, CD8, and CD3 T-cell counts and for their assistance during flow-cytometry analysis in the Institute of Clinical Immunology laboratory. We also thank the staff members of the Institute of Virology laboratory for their contributions to performing HIV viral load measurements and for delivering the leftover blood samples to the Institute of Clinical Immunology laboratory. The authors are grateful to Uwe Gerd Liebert from the Institute of Virology for helpful discussions and guidance in the beginning of the project.
Funding
Financial support has been provided by the Institute of Clinical Immunology and Alexander von Humboldt Foundation to purchase the reagents, chemicals, antibodies, and supplies used for this study.
Disclosure
The authors declare no conflicts of interest in this work.
References
1. World Health Organisation. Global progress report on HIV, viral hepatitis and sexually transmitted infections, 2021; 2021. Available from: https://www.who.int/publications/i/item/9789240027077.
2. Rosenberg ZF, Fauci AS. Immunopathogenesis of HIV infection. FASEB J. 1991;5(10):2382–2390. doi:10.1096/fasebj.5.10.1676689
3. Bukrinsky MI, Stanwick TL, Dempsey MP, Stevenson M. Quiescent T lymphocytes as an inducible virus reservoir in HIV-1 infection. Science. 1991;254(5030):423–427. doi:10.1126/science.1925601
4. Cumming PD, Wallace EL, Schorr JB, Dodd RY. Exposure of patients to human immunodeficiency virus through the transfusion of blood components that test antibody-negative. N Engl J Med. 1989;321(14):941–946. doi:10.1056/NEJM198910053211405
5. Stramer SL, Heller JS, Coombs RW, Parry JV, Ho DD, Allain JP. Markers of HIV infection prior to IgG antibody seropositivity. JAMA. 1989;262(1):64–69. doi:10.1001/jama.1989.03430010076034
6. Busch MP, Taylor PE, Lenes BA, et al. Screening of selected male blood donors for p24 antigen of human immunodeficiency virus type 1. N Engl J Med. 1990;323(19):1308–1312. doi:10.1056/NEJM199011083231904
7. Clark SJ, Saag MS, Decker WD, et al. High titers of cytopathic virus in plasma of patients with symptomatic primary HIV-1 infection. N Engl J Med. 1991;324(14):954–960. doi:10.1056/NEJM199104043241404
8. Daar ES, Moudgil T, Meyer RD, Ho DD. Transient high levels of viremia in patients with primary human immunodeficiency virus type 1 infection. N Engl J Med. 1991;324(14):961–964. doi:10.1056/NEJM199104043241405
9. Busch MP, Satten GA. Time course of viremia and antibody seroconversion following human immunodeficiency virus exposure. Am J Med. 1997;102(5):117–124. doi:10.1016/S0002-9343(97)00077-6
10. World Health Organization. Consolidated Guidelines on HIV Testing Services. World Health Organization; 2015.
11. Levi J, Raymond A, Pozniak A, Vernazza P, Kohler P, Hill A. Can the UNAIDS 90- 90-90 target be achieved? A systematic analysis of national HIV treatment cascades. BMJ Glob Heal. 2016;1(2):e000010. doi:10.1136/bmjgh-2015-000010
12. Shah M, Risher K, Berry SA, Dowdy DW. The epidemiologic and economic impact of improving HIV testing, linkage, and retention in care in the United States. Clin Infect Dis. 2016;62(2):220–229. doi:10.1093/cid/civ801
13. Mehta SR, Murrell B, Anderson CM, et al. Using HIV sequence and epidemiologic data to assess the effect of self-referral testing for acute HIV infection on incident diagnoses in San Diego, California. Clin Infect Dis. 2016;63(1):101–107. doi:10.1093/cid/ciw161
14. O’Brien M, Markowitz M. Should we treat acute HIV infection? Curr HIV AIDS Rep. 2012;9(2):101–110. doi:10.1007/s11904-012-0113-0
15. Jean-Philippe P, Spiegel H, Gnanashanmugam D, et al. HIV birth testing and linkage to care for HIV-infected infants. AIDS. 2017;31(13):1797–1807. doi:10.1097/QAD.0000000000001561
16. Technau KG, Kuhn L, Coovadia A, Murnane PM, Sherman G. Xpert HIV-1 point-of-care test for neonatal diagnosis of HIV in the birth testing programme of a maternity hospital: a field evaluation study. Lancet HIV. 2017;4(10):e442–e448. doi:10.1016/S2352-3018(17)30097-8
17. Majors CE, Smith CA, Natoli ME, Kundrod KA, Richards-Kortum R. Point-of-care diagnostics to improve maternal and neonatal health in low-resource settings. Lab Chip. 2017;17(20):3351–3387. doi:10.1039/C7LC00374A
18. Gadol N, Crutcher GJ, Busch MP. Detection of intracellular HIV in lymphocytes by flow cytometry. Cytometry. 1994;15(4):359–370. doi:10.1002/cyto.990150412
19. Korenromp EL, Williams BG, Schmid GP, Dye C. Clinical prognostic value of RNA viral load and CD4 cell counts during untreated HIV-1 infection—A quantitative review. PLoS One. 2009;4(6):e5950. doi:10.1371/journal.pone.0005950
20. Costigliola P, Tumietto F, Ricchi E, Chiodo F. Detection of circulating p24 antigen-positive CD4+ cells during HIV infection by flow cytometry. AIDS. 1992;6(10):1121–1126. doi:10.1097/00002030-199210000-00009
21. Clark AG, Holodniy M, Schwartz DH, Katzenstein DA, Merigan TC. Decrease in HIV provirus in peripheral blood mononuclear cells during zidovudine and human rIL-2 administration. J Acquir Immune Defic Syndr. 1992;5(1):52–59.
22. Yang H, Yorke E, Hancock G, et al. Improved quantification of HIV-1-infected CD4+ T cells using an optimised method of intracellular HIV-1 gag p24 antigen detection. J Immunol Methods. 2013;391(1–2):174–178. doi:10.1016/j.jim.2013.03.001
23. Fromentin R, Bakeman W, Lawani MB, et al. CD4+ T cells expressing PD-1, TIGIT and LAG-3 contribute to HIV persistence during ART. PLOS Pathog. 2016;12(7):e1005761. doi:10.1371/journal.ppat.1005761
24. Hurst J, Hoffmann M, Pace M, et al. Immunological biomarkers predict HIV-1 viral rebound after treatment interruption. Nat Commun. 2015;6(1):8495. doi:10.1038/ncomms9495
25. Blackburn SD, Shin H, Haining WN, et al. Coregulation of CD8+ T cell exhaustion by multiple inhibitory receptors during chronic viral infection. Nat Immunol. 2009;10(1):29–37. doi:10.1038/ni.1679
26. Kaufmann DE, Walker BD. PD-1 and CTLA-4 inhibitory co signaling pathways in HIV infection and the potential for therapeutic intervention. J Immunol. 2009;182(10):5891–5897. doi:10.4049/jimmunol.0803771
27. Kassu A, Marcus RA, D’Souza MB, et al. Regulation of virus-specific CD4 + T cell function by multiple costimulatory receptors during chronic HIV infection. J Immunol. 2010;185(5):3007–3018. doi:10.4049/jimmunol.1000156
28. Chew GM, Fujita T, Webb GM, et al. TIGIT marks exhausted T cells, correlates with disease progression, and serves as a target for immune restoration in HIV and SIV infection. PLOS Pathog. 2016;12(1):e1005349. doi:10.1371/journal.ppat.1005349
29. Hoffmann M, Pantazis N, Martin GE, et al. Exhaustion of activated CD8 T cells predicts disease progression in primary HIV-1 infection. PLOS Pathog. 2016;12(7):e1005661. doi:10.1371/journal.ppat.1005661
30. Tamene W, Abebe M, Wassie L, et al. PDL1 expression on monocytes is associated with plasma cytokines in Tuberculosis and HIV. PLoS One. 2021;16(10):e0258122. doi:10.1371/journal.pone.0258122
31. Clutton G, Mollan K, Hudgens M, Goonetilleke N. A reproducible, objective method using mitotracker® fluorescent dyes to assess mitochondrial mass in T cells by flow cytometry. Cytom Part A. 2019;95(4):450–456. doi:10.1002/cyto.a.23705
32. European AIDS Clinical Society. EACS guidelines, version 10.1; 2021. Available from: https://www.eacsociety.org/files/2021_guidelines-10.1_final.pdf.
33. McSharry JJ, Costantino R, Robbiano E, Echols R, Stevens R, Lehman JM. Detection and quantitation of human immunodeficiency virus-infected peripheral blood mononuclear cells by flow cytometry. J Clin Microbiol. 1990;28(4):724–733. doi:10.1128/jcm.28.4.724-733.1990
34. Ohlsson-Wilhelm BM, Cory JM, Kessler HA, Eyster ME, Rapp F, Landay A. Circulating Human Immunodeficiency Virus (HIV) p24 antigen-positive lymphocytes: a flow cytometric measure of HIV infection. J Infect Dis. 1990;162(5):1018–1024. doi:10.1093/infdis/162.5.1018
35. Schnittman SM, Psallidopoulos MC, Lane HC, et al. The reservoir for HIV-1 in human peripheral blood is a T cell that maintains expression of CD4. Science. 1989;245(4915):305–308. doi:10.1126/science.2665081
36. Embretson J, Zupancic M, Ribas JL, et al. Massive covert infection of helper T lymphocytes and macrophages by HIV during the incubation period of AIDS. Nature. 1993;362(6418):359–362. doi:10.1038/362359a0
37. Pantaleo G, Graziosi C, Demarest JF, et al. HIV infection is active and progressive in lymphoid tissue during the clinically latent stage of disease. Nature. 1993;362(6418):355–358. doi:10.1038/362355a0
38. Piatak M, Saag MS, Yang LC, et al. High levels of HIV-1 in plasma during all stages of infection determined by competitive PCR. Science. 1993;259(5102):1749–1754. doi:10.1126/science.8096089
39. Holzer TJ, Heynen CA, Novak RM, Pitrak DL, Dawson GJ. Frequency of cells positive for HIV-1 p24 antigen assessed by flow cytometry. AIDS. 1993;7:S3–6. doi:10.1097/00002030-199311002-00002
40. Moss AR. Predicting who will progress to AIDS. BMJ. 1988;297(6656):1067–1068. doi:10.1136/bmj.297.6656.1067
41. Lange J, Goudsmit J. Decline of antibody reactivity to HIV core protein secondary to increased production of HIV antigen. Lancet. 1987;329(8530):448. doi:10.1016/S0140-6736(87)90148-6
42. Coombs RW, Collier AC, Allain JP, et al. Plasma viremia in Human Immunodeficiency Virus infection. N Engl J Med. 1989;321(24):1626–1631. doi:10.1056/NEJM198912143212402
43. Lelie PN, Reesink HW, Bakker E, Huisman JGTJ. Clinical importance of HIV antigen and anti-HIV core markers in persons infected with HIV. N Engl J Med. 1988;318(18):1204–1205. doi:10.1056/NEJM198805053181814
44. Morrow WJW, Wharton M, Stricker RB, Levy JA. Circulating immune complexes in patients with acquired immune deficiency syndrome contain the AIDS-associated retrovirus. Clin Immunol Immunopathol. 1986;40(3):515–524. doi:10.1016/0090-1229(86)90196-0
45. Pardoll DM. The blockade of immune checkpoints in cancer immunotherapy. Nat Rev Cancer. 2012;12(4):252–264. doi:10.1038/nrc3239
46. Bardhan K, Anagnostou T, Boussiotis VA. The PD1: PD-L1/2Pathway from discovery to clinical implementation. Front Immunol. 2016;7. doi:10.3389/fimmu.2016.00550.
47. Cockerham LR, Jain V, Sinclair E, et al. Programmed death-1 expression on CD4+ and CD8+ T cells in treated and untreated HIV disease. AIDS. 2014;28(12):1749–1758. doi:10.1097/QAD.0000000000000314
48. Yamamoto T, Price DA, Casazza JP, et al. Surface expression patterns of negative regulatory molecules identify determinants of virus-specific CD8+ T-cell exhaustion in HIV infection. Blood. 2011;117(18):4805–4815. doi:10.1182/blood-2010-11-317297
49. Rallón N, García M, García-Samaniego J, et al. Expression of PD-1 and Tim-3 markers of T-cell exhaustion is associated with CD4 dynamics during the course of untreated and treated HIV infection. PLoS One. 2018;13(3):e0193829. doi:10.1371/journal.pone.0193829
50. Vivar N, Ruffin N, Sammicheli S, Hejdeman B, Rethi B, Chiodi F. Survival and proliferation of CD28- T cells during HIV-1 infection relate to the amplitude of viral replication. J Infect Dis. 2011;203(11):1658–1667. doi:10.1093/infdis/jir156
51. de Armas LR, Pallikkuth S, Rinaldi S, Pahwa R, Pahwa S. Implications of immune checkpoint expression during aging in HIV-infected people on antiretroviral therapy. AIDS Res Hum Retroviruses. 2019;35(11–12):1112–1122. doi:10.1089/aid.2019.0135
52. Trautmann L, Janbazian L, Chomont N, et al. Upregulation of PD-1 expression on HIV-specific CD8+ T cells leads to reversible immune dysfunction. Nat Med. 2006;12(10):1198–1202. doi:10.1038/nm1482
53. Day CL, Kaufmann DE, Kiepiela P, et al. PD-1 expression on HIV-specific T cells is associated with T-cell exhaustion and disease progression. Nature. 2006;443(7109):350–354. doi:10.1038/nature05115
54. Velu V, Shetty RD, Larsson M, Shankar EM. Role of PD-1 co-inhibitory pathway in HIV infection and potential therapeutic options. Retrovirology. 2015;12(1):14. doi:10.1186/s12977-015-0144-x
55. Muthumani K, Choo AY, Shedlock DJ, et al. Human immunodeficiency virus type 1 nef induces programmed death 1 expression through a p38 Mitogen-activated protein kinase-dependent mechanism. J Virol. 2008;82(23):11536–11544. doi:10.1128/JVI.00485-08
56. Jones RB, Ndhlovu LC, Barbour JD, et al. Tim-3 expression defines a novel population of dysfunctional T cells with highly elevated frequencies in progressive HIV-1 infection. J Exp Med. 2008;205(12):2763–2779. doi:10.1084/jem.20081398
57. Prévost J, Edgar CR, Richard J, et al. HIV-1 Vpu downregulates tim-3 from the surface of infected CD4 + T cells. J Virol. 2020;94(7). doi:10.1128/JVI.01999-19
58. Pardons M, Baxter AE, Massanella M, et al. Single-cell characterization and quantification of translation-competent viral reservoirs in treated and untreated HIV infection. PLoS Pathog. 2019;15(2):1–28. doi:10.1371/journal.ppat.1007619
59. Spielberg F, Ryder R, Harris J, et al. Field testing and comparative evaluation of rapid, visually read screening assays for antibody to human immunodeficiency virus. Lancet. 1989;333(8638):580–584. doi:10.1016/S0140-6736(89)91610-3
60. Aubert V, Erb P, Perrin LH, Grob PJ, Frei PC. Evaluation of commercial rapid tests for serological determination of HIV infection. Lab Med. 1991;22(12):869–872. doi:10.1093/labmed/22.12.869
61. Gray ER, Bain R, Varsaneux O, Peeling RW, Stevens MM, McKendry RA. p24 revisited. AIDS. 2018;32(15):2089–2102. doi:10.1097/QAD.0000000000001982
62. Fox J, Dunn H, O’Shea S. Low rates of p24 antigen detection using a fourth-generation point of care HIV test. Sex Transm Infect. 2011;87(2):178–179. doi:10.1136/sti.2010.042564
63. Taegtmeyer M, MacPherson P, Jones K, et al. Programmatic evaluation of a combined antigen and antibody test for rapid HIV diagnosis in a community and sexual health clinic screening programme. PLoS One. 2011;6(11):e28019. doi:10.1371/journal.pone.0028019
64. Conway DP, Holt M, McNulty A, et al. Multi-centre evaluation of the determine HIV combo assay when used for point of care testing in a high risk clinic-based population. PLoS One. 2014;9(4):e94062. doi:10.1371/journal.pone.0094062
65. Masciotra S, Luo W, Youngpairoj AS, et al. Performance of the Alere <sup>Determine™ HIV-1/2 Ag/Ab Combo Rapid Test with specimens from HIV-1 seroconverters from the US and HIV-2 infected individuals from Ivory Coast. J Clin Virol. 2013;58:e54–e58. doi:10.1016/j.jcv.2013.07.002
66. Livant E, Heaps A, Kelly C, et al. The fourth generation Alere TM HIV Combo rapid test improves detection of acute infection in MTN-003 (VOICE) samples. J Clin Virol. 2017;94:15–21. doi:10.1016/j.jcv.2017.06.006
67. Stafylis C, Klausner JD. Evaluation of two 4th generation point-of-care assays for the detection of Human Immunodeficiency Virus infection. PLoS One. 2017;12(8):e0183944. doi:10.1371/journal.pone.0183944
68. Ottiger C, Huber R. Comparison of the new alere HIV combo with alere determine HIV-1/2 Ag/Ab combo in acute primo and established HIV infections. Ann Clin Lab Res. 2015;3(3). doi:10.21767/2386-5180.100022
69. Fitzgerald N, Cross M, O’Shea S, Fox J. Diagnosing acute HIV infection at point of care: a retrospective analysis of the sensitivity and specificity of a fourth-generation point-of-care test for detection of HIV core protein p24. Sex Transm Infect. 2017;93(2):100–101. doi:10.1136/sextrans-2015-052491
 © 2022 The Author(s). This work is published and licensed by Dove Medical Press Limited. The
full terms of this license are available at https://www.dovepress.com/terms
and incorporate the Creative Commons Attribution
- Non Commercial (unported, 3.0) License.
By accessing the work you hereby accept the Terms. Non-commercial uses of the work are permitted
without any further permission from Dove Medical Press Limited, provided the work is properly
attributed. For permission for commercial use of this work, please see paragraphs 4.2 and 5 of our Terms.
© 2022 The Author(s). This work is published and licensed by Dove Medical Press Limited. The
full terms of this license are available at https://www.dovepress.com/terms
and incorporate the Creative Commons Attribution
- Non Commercial (unported, 3.0) License.
By accessing the work you hereby accept the Terms. Non-commercial uses of the work are permitted
without any further permission from Dove Medical Press Limited, provided the work is properly
attributed. For permission for commercial use of this work, please see paragraphs 4.2 and 5 of our Terms.