Back to Journals » Clinical and Experimental Gastroenterology » Volume 13
Faecal Calprotectin and 7-α Cholestenone Levels in Microscopic Colitis: Experience from Edinburgh
Authors Davie M, Trimble R, Robertson AR ![]() , Koulaouzidis A
, Koulaouzidis A ![]()
Received 14 January 2020
Accepted for publication 13 April 2020
Published 4 May 2020 Volume 2020:13 Pages 115—121
DOI https://doi.org/10.2147/CEG.S246004
Checked for plagiarism Yes
Review by Single anonymous peer review
Peer reviewer comments 2
Editor who approved publication: Professor Andreas M. Kaiser
Matt Davie,1 Rebecca Trimble,1 Alexander R Robertson,2 Anastasios Koulaouzidis2
1The University of Edinburgh, NHS Lothian, Edinburgh EH16 4SA, UK; 2Department of Gastroenterology, Royal Infirmary of Edinburgh, Edinburgh EH16 4SA, UK
Correspondence: Anastasios Koulaouzidis
Department of Gastroenterology, Royal Infirmary of Edinburgh, Edinburgh EH16 4SA, UK
Tel + 44131 536 1000
Email [email protected]
Introduction: Microscopic colitis (MC) is an important cause of chronic, watery diarrhoea. Currently, there is no specific biomarker available to guide diagnosis. The use of faecal calprotectin (FCP) as a potential marker has been addressed in only a few studies. Further, bile acid malabsorption (BAM) often accompanies MC. Current practice recommends the selenium-labelled homocholic acid-taurine (SeHCAT) test, but at our centre, 7 alpha-hydroxy-4-cholesten-3-one (7αC) is used as a simpler and less expensive alternative to SeHCAT, with values over 22ng/mL indicating BAM. This study aims to evaluate the use of FCP as a biomarker in the diagnosis of MC and the role of 7αC in detecting concomitant BAM with MC.
Methods: Pathology records were retrospectively reviewed for patients diagnosed with collagenous colitis (CC) between 2000 and 2018 and lymphocytic colitis (LC) between 1995 and 2011. FCP and 7αc results, if measured within 6 months of pathological diagnosis, were extracted for analysis.
Results: Between 2000 and 2018, 646 CC cases were confirmed on histology. Of 646 patients, 147 had FCP measured; in 111 (75.5%) FCP was elevated with mean levels 238.1μg/g (SD± 273.0); 140/646 had 7αC measured; 16 (11.4%) indicated BAM. Mean levels were 10.2ng/mL (SD± 9.4). During a 21-year period (1995– 2011), 204 LC diagnoses were made: 14/204 had FCP measured; 8 (57.1%) were elevated. Mean levels were 128.4μg/g (SD± 107.7). Of 204 LC patients, 20 had 7αC measured, 5 (25%) indicating BAM. Mean levels were 13.95ng/mL (SD± 9.4).
Discussion: Both CC and LC were associated with raised FCP during the diagnostic phase, supporting the potential role of its use in clinical practice. Furthermore, we present results of using 7αC in identifying BAM amongst patients with MC. In our cohort, low levels of 7αC suggest relatively low concordance of BAM with MC.
Keywords: microscopic colitis, bile salt malabsorption, biomarkers, 7-α cholestenone, faecal calprotectin
Introduction
Microscopic colitis (MC) comprises the clinical disorders collagenous colitis (CC) and lymphocytic colitis (LC).1 Over the last decade the prevalence of MC has risen, with numbers now comparable to that of Inflammatory Bowel Disease (IBD).2,3 A significant contributor to this increase in diagnosis has been raised awareness and recognition of the disease.4 Despite this MC is often misdiagnosed as clinical symptoms may mimic a large number of other conditions,5 some examples are included in Table 1. Typically, patients with MC present with chronic, painless, non-bloody and watery diarrhoea.6 An issue remains that there is no specific biomarker available to guide towards a diagnosis of MC.7 Therefore, multiple colonic biopsies, taken from an often macroscopically normal colon, are required for diagnosis.8 With ever increasing pressures on healthcare delivery, patients may not undergo a colonoscopy for many months or years from the onset of symptoms.9 Therefore, the use of biomarkers for screening and diagnosis in the setting of MC is desirable.
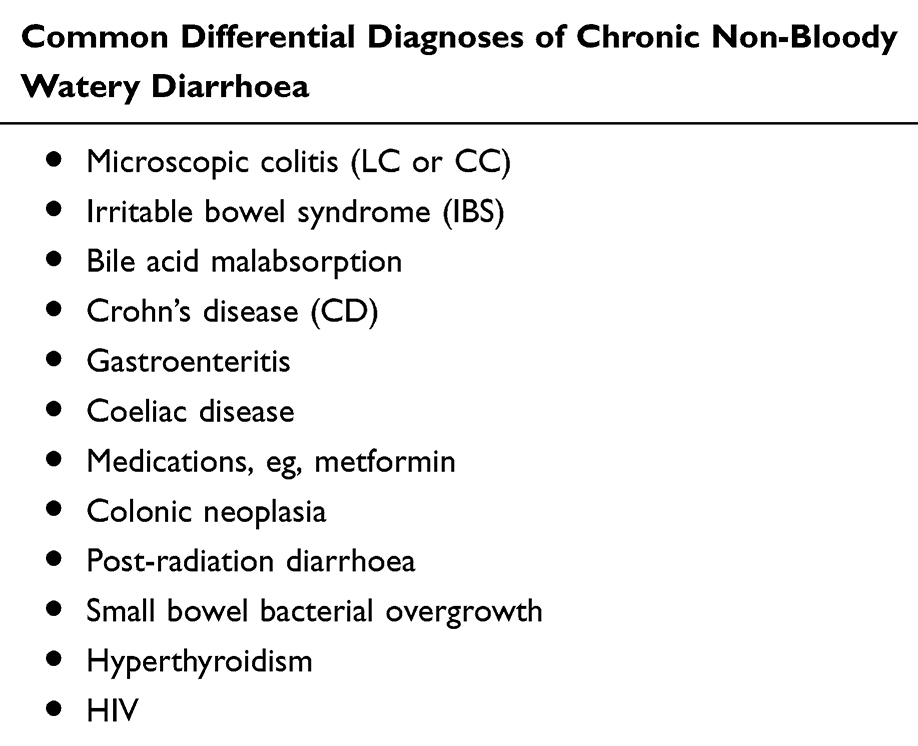 |
Table 1 List of Differential Diagnoses of Microscopic Colitis |
This study presents data from a large patient cohort evaluating two possible biomarkers, faecal calprotectin (FCP) and 7-alpha-hydroxy-4-cholesten-3-one (7αC) amongst patients with histologically confirmed MC. FCP is already well established as a biomarker for detecting inflammation, most typically in IBD.10 Its role in detecting MC, however, is limited and conflicting and requires further evaluation. The European Microscopic Colitis Group (EMCG) advise that bile acid malabsorption (BAM) should be considered and investigated.11 This association is poorly understood, yet treating BAM early in MC can aid with symptomatic control. Currently, the reference standard for investigating BAM is the selenium-labelled homocholic acid-taurine (SeHCAT) scan.12 This is a complex and expensive procedure which also exposes patients to small volumes of radiation.13
In this retrospective study, we investigate the use of 7αC, a bile acid precursor, as a simpler alternative for detecting BAM amongst patients with MC. Furthermore, we evaluate the role of FCP in identifying new cases of MC.
Methods
Study Design
Data were collected from patients diagnosed with MC within the Lothian health board. Pathology records were retrospectively reviewed for all patients with a histologically confirmed diagnosis of CC or LC based on results of colonic biopsies. Records for confirmed CC diagnoses were available over an 18-year period between 2000 and 2018 and reviewed. Relevant LC data were available over a 16-year period extending from 1995 to 2011. Within this period, all patients who were diagnosed with MC had their biochemical and clinical records reviewed. Data values for FCP and 7αC were extracted through the electronic patient record system (TrakCare, ©Intersystems, Cambridge, MA), and then exported into Microsoft Excel (©Microsoft, Redmond, WA) for further analysis.
Diagnostic Protocol
Most patients undergoing investigations for MC followed a similar pathway to diagnosis, with the majority presenting with non-bloody watery diarrhoea as the major component of their initial complaint. If other gastrointestinal conditions, aside MC, were also diagnosed during the diagnostic workup, these patients were excluded for concerns over interference with the biomarker values.
Biomarker Testing and Interpretation
FCP is a commonly used marker in determining intestinal inflammation.10 This is particularly relevant in active IBD, where large volumes can be found in stool samples. Values recorded >50μg/g were noted as elevated above the normal range, with those <50μg/g within the reference range and documented as non-elevated/normal. Laboratory values for FCP reported as <20μg/mL were counted as 20μg/mL for the purpose of analysis, as very low values locally are grouped and reported as “<20μg/mL”. 7αC is used in our centre in determining whether patients with MC have contemporaneous BAM. This biochemical is an intermediate within the pathway of bile acid synthesis, and elevated serum levels indicate an impairment concerning the absorption of bile acids.12,24 Values measured >22ng/mL indicate concomitant BAM, and those <22ng/mL are within the normal reference range. Importantly only values for FCP and 7αC measured within the 6 months prior to or following the diagnosis of MC were included. Where a patient had repeat measurements for either biomarker within this timescale a mean value was calculated, and this was used as the single value for analysis.
Results
Collagenous Colitis
Between the years of 2000–2018, a total of 646 patients had pathology records confirming a diagnosis of CC. Of these patients 147 (22.8%) had FCP values recorded and 140 (21.7%) were investigated for BAM using 7αC. 111/147 (75.5%) patients who had FCP measured had elevated levels >50μg/g. Furthermore, 92/147 (62.6%) of these were recorded >100μg/g, and 53/147 (36.1%) were >200μg/g. The total range of FCP values was between 20–1375μg/g, and the mean value recorded was 238.1μg/g (SD ± 273.0), Figure 1. Of the 140 patients who had 7αC measured, 16 (11.4%) had values elevated above the normal reference value of 22ng/mL, indicating clinically evident BAM. The mean value of the 7αC measurements was 10.2ng/mL (SD ± 9.4), Figure 2. Specifically, there were 73/646 (11.3%) patients who had both FCP and 7αC values measured during their diagnostic work-up. Amongst this group, 60 had a raised FCP, with just 5 of these patients also having a coexisting elevated 7αC. The 13 patients with normal FCP levels also had normal 7αC levels.
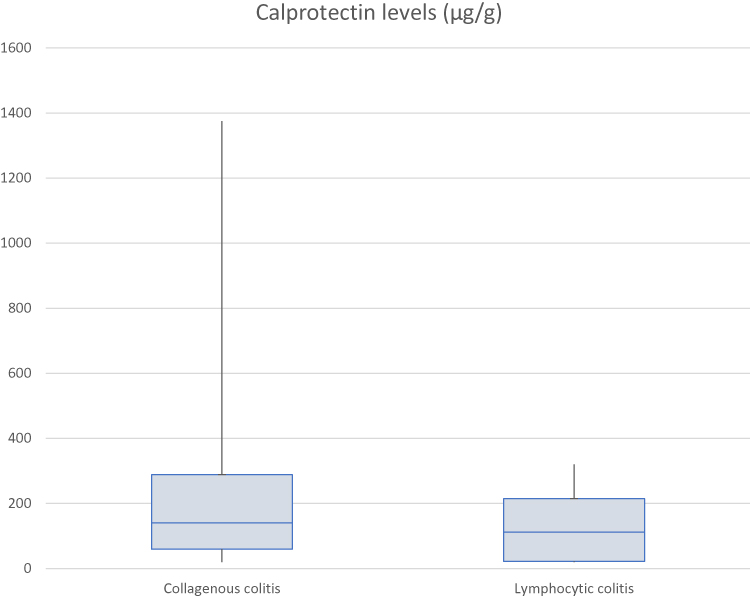 |
Figure 1 Calprotectin levels measured in collagenous and lymphocytic colitis. |
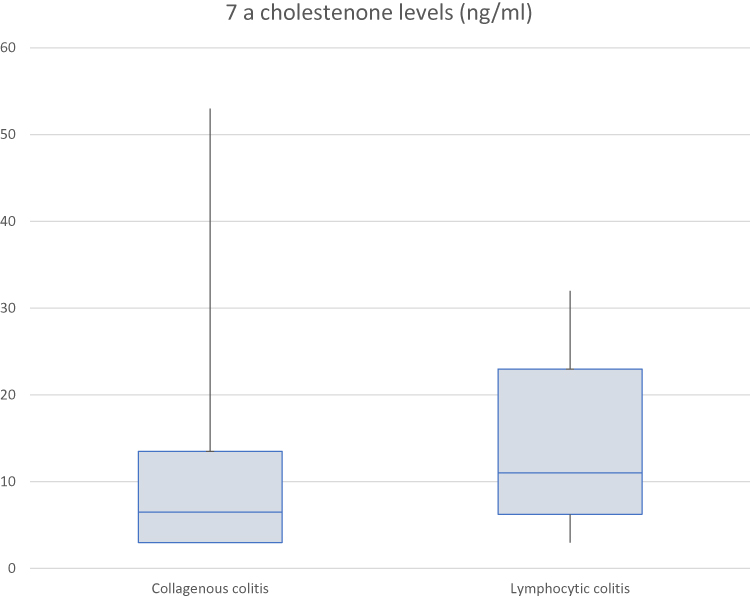 |
Figure 2 7-α Cholestenone levels measured in collagenous and lymphocytic colitis. |
Lymphocytic Colitis
204 patients were diagnosed with LC in the time period of 1995–2011. 14 (6.9%) patients had FCP recorded and 20 (9.8%) patients had 7αC investigated. 8/14 (57.1%) patients who had FCP measured had elevated levels >50μg/g. Additionally, all 8 values were >100μg/g with 4 being >200μg/g, Figure 1. The mean FCP value was 128.4μg/g (SD ± 107.7). Separately 20 (9.8%) patients had 7αC investigated, with 5/20 (25.0%) of the values being elevated above the normal threshold of 22ng/mL. The mean value was 13.95ng/mL (SD ± 9.4), Figure 2. As with the CC cohort, we also identified the population of LC patients who had both FCP and 7αC measurements undertaken. 9/204 (4.4%) fulfilled this criterion, 6 of these patients had an elevated FCP, with just 2 of this group having a concomitantly elevated 7αC.
Discussion
Over recent years the prevalence of MC has increased.2 Despite raised awareness of the condition, there is a paucity of available literature relating to the use of biomarkers in the diagnostic workup of MC. Previous research evaluating the use of FCP to detect active MC provide generally conflicting results with examples given in Table 2. Additionally, there is no literature specifically evaluating the use of 7αC in investigating BAM in MC, see Table 3.
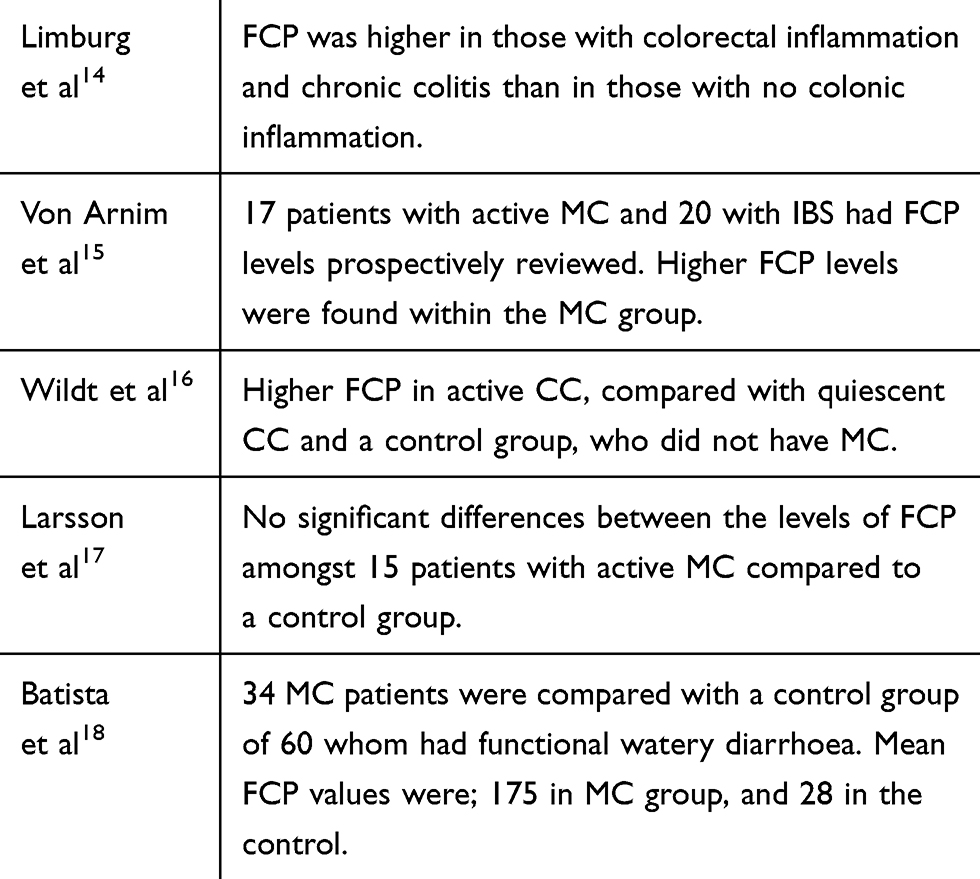 |
Table 2 Summary of Research Evaluating the Clinical Effectiveness of Faecal Calprotectin in MC |
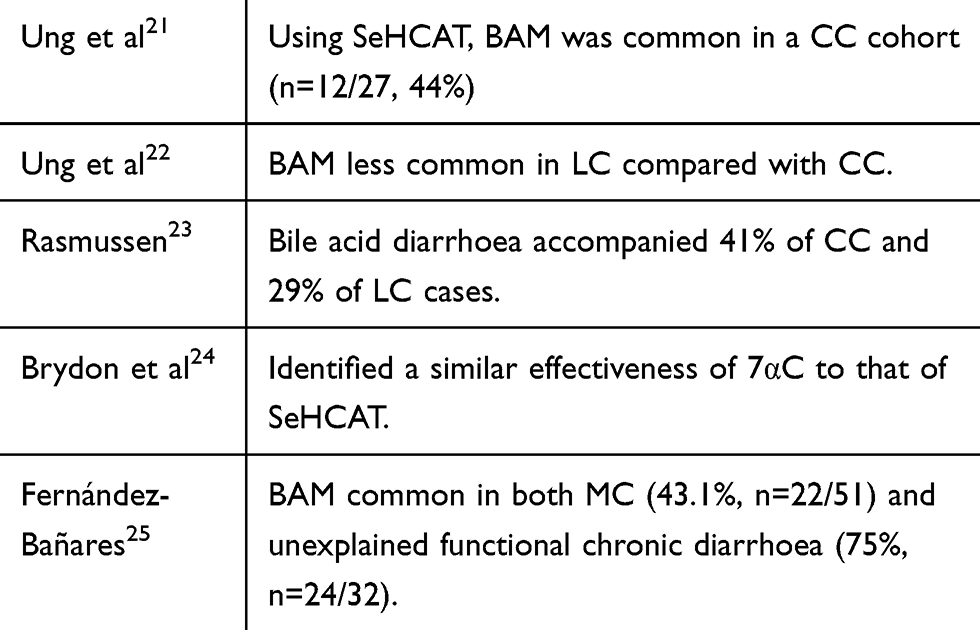 |
Table 3 Sample of Previous Research Evaluating the Association of BAM in MC and/Or the Role of 7-α Cholestenone in Detecting BAM |
Clinical research looking into FCP in patients with MC has suggested that MC is associated with elevated FCP. Limburg et al showed that patients with chronic colonic inflammation had higher average FCP compared with a control group.14 Von Arnim et al concluded that FCP levels were greater in a MC cohort compared with an IBS population,15 while Wildt et al also documented higher FCP in active MC patients, compared with quiescent CC and a control group.16 However, in another study no differences in FCP values were seen between MC patients and a control group.17 Nevertheless, all of these studies presented small patient cohorts. Perhaps the best data available are from Batista et al.18 The authors retrospectively compared 34 patients with MC and 60 patients with functional diarrhoea, identifying mean FCP levels in MC and functional groups of 175μg/g and 28μg/g, respectively.
Our results suggest that MC is commonly associated with elevated FCP values, with 75.5% (n=111/147) of CC patients, and 57.1% (n=8/14) of LC patients having abnormal FCP values (>50μg/g), and often markedly higher, Table 4. However, as 24.5% (n=36/147) of those with CC and 42.9% (n=6/14) of LC had a FCP within the normal range, the use of FCP cannot exclude the diagnosis of active MC. It is an entirely non-specific biomarker, rising in many causes of diarrhoea, but despite its low specificity and sensitivity for MC, the use of FCP does have value as a supplementary investigation in the diagnostic work-up of both CC and LC.
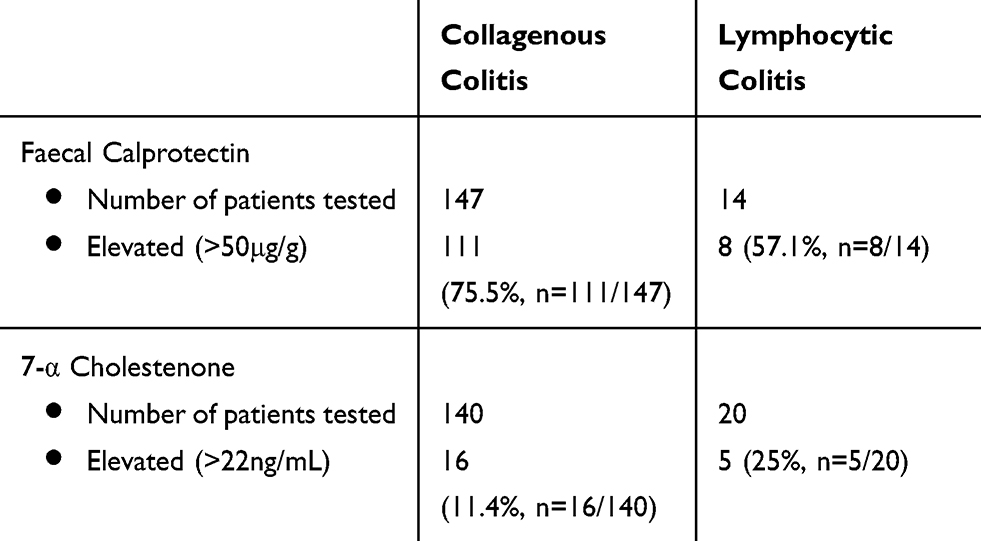 |
Table 4 Summary Comparing the Findings Between Collagenous and Lymphocytic Colitis |
Bile acid malabsorption (BAM), which also causes non-bloody diarrhoea, mimics many conditions including IBS and MC.19 Past literature has frequently reported patients to have both BAM and MC, but the true association is poorly understood.11 One theory is that chronic BAM may be a risk factor for developing MC.20 Current practice is to investigate for BAM using the SeHCAT test. Previous research, looking at 27 patients with CC, suggested that the SeHCAT test identified 44% with coexistent BAM.21 The association of BAM has been reported as slightly more common with CC than LC.22,23
Our study is the first of its kind evaluating the use of 7αC, a bile acid precursor, as an alternative to SeHCAT for detecting BAM within MC patients. The main benefit of 7αC in practice is that it is considered a cheaper and simpler alternative, with a similar rate of detection to that of SeHCAT.24 In our cohort, a relatively low levels of BAM were identified in MC patients (11.4% of CC, 25% of LC) when compared to the results of past research. An optimal design for this study would have included both 7αC and SeHCAT results being included for analysis. LC was more strongly associated with BAM than CC, conflicting with previously published findings. There were relatively few patients in the LC category included as few had had the tests performed, possibly due to being a slightly earlier cohort, which could introduce bias. Based on the low levels of BAM reported, it is therefore possible that the association of BAM and MC is weaker than previously recorded. Whilst it is useful in detecting BAM, this study would suggest it has a limited role in the detection of MC prior to diagnostic colonoscopy. Fernández-Bañares et al identified that whilst BAM was common amongst patients with MC, there were also higher rates in the cohort who had functional diarrhoea.25 7αC, therefore, may arguably be more useful following a histopathological confirmation of MC, as on its own it has limited value in differentiating MC from other conditions. Importantly, it remains of worth for investigating patients with functional diarrhoea, as it can rule out BAM as an alternative cause of their presentation.
Our study also identified little association between FCP and 7αc in patients who had both parameters measured.
As with any study, there are important limitations to reflect upon. The retrospective design involved the reliance upon previously documented clinical information.
This study presents real-world experience and data. This unfortunately means the collection of biomarkers in those ultimately diagnosed with MC was sporadic and inconsistent. We used a period of 6 months as the inclusion criteria for the measurement of the biomarkers of interest, chosen to represent truer levels in active MC. The study design including FCP and 7αC results returning after the diagnosis of MC being made risks including those who have commenced therapy, which could again introduce unaccounted for biases. Many of the initial referrals, as altered bowel habit or new diarrhoea, came with the clinical concern of malignancy. This resulted in many patients undergoing early colonoscopy and so biomarkers went unchecked, excluding them from our study. Despite initial large numbers included in the MC cohort, this resulted in small numbers for final analysis and so the results are hard to generalise. There is also a risk of selection bias as those with a high FCP recorded are more likely to proceed to invasive colonoscopy, leading to their MC diagnosis, than those with a low FCP reading who may not undergo further investigation.
Serial biomarker values would ideally have been used to illustrate response to treatment and changing levels with the degree of MC activity but unfortunately, these data were not available as once the diagnosis was reached further biomarkers were rarely checked.
Conclusion
In summary, both CC and LC were associated with raised FCP. We suggest FCP should be used more frequently as a biomarker in clinical practice to help raise suspicion of MC, as a raised FCP can lower the threshold for colonoscopy referral, leading to fewer misdiagnoses. Importantly though, FCP is not specific to MC and although it was raised in many cases, not all with MC have a positively elevated level. Therefore, it should not be considered as an alternative to the current approach of a thorough clinical assessment followed by histological confirmation during colonoscopy, but instead considered as a supplementary test to focus investigations.
Our study indicated low levels of coexisting BAM in MC. 7αC, nevertheless, has a potential role in identifying this particular subgroup of patients. This bile acid precursor is a quick, and cost-effective alternative to SeHCAT. We recommend that further research is carried out investigating its role as an alternative to SeHCAT in clinical practice. Future research should continue to focus upon the development of biomarkers which may have a higher specificity for MC.
Ethics
This study was performed as a service evaluation using routinely collected anonymised data, and as such no ethics committee review was requested. Throughout, the methodology acted in compliance with the Declaration of Helsinki to ensure that all data were protected in order to appropriately safeguard the patients included.
Disclosure
Dr Anastasios Koulaouzidis reportsspeaker/advisory board honoraria and travel support from Dr FalkPharma UK. The authors report no other conflicts of interest in this work.
References
1. Park T, Cave D, Marshall C. Microscopic colitis: a review of etiology, treatment and refractory disease. World J Gastroenterol. 2015;21(29):8804–8810.
2. Pisani LF, Tontini GE, Marinoni B, et al. Biomarkers and microscopic colitis: an unmet need in clinical practice. Front Med (Lausanne). 2017;4:54. doi:10.3389/fmed.2017.00054
3. Gentile N, Yen EF. Prevalence, pathogenesis, diagnosis, and management of microscopic colitis. Gut Liver. 2018;12(3):227–235. doi:10.5009/gnl17061
4. Storr MA. Microscopic colitis: epidemiology, pathophysiology, diagnosis and current management-an update 2013. ISRN Gastroenterol. 2013;352718.
5. Fernández-Bañares F, Casanova MJ, Arguedas Y, et al. Current concepts on microscopic colitis: evidence-based statements and recommendations of the Spanish Microscopic Colitis Group. Ailment Pharmacol Ther. 2016;43(3):400–426. doi:10.1111/apt.13477
6. Pardi DS. Diagnosis and management of microscopic colitis. Am J Gastroenterol. 2017;112(1):78–85. doi:10.1038/ajg.2016.477
7. Pihl Lesnovska K, Munch A, Hjortswang H. Microscopic colitis: struggling with an invisible, disabling disease . J Clin Nurs. 2019;28(19–20):3408–3415.
8. Pascua MF, Kedia P, Weiner MG, Holmes J, Ellenberg J, Lewis JD. Microscopic colitis and medication use. Clin Med Insights Gastroenterol. 2010;2010(3):11–19. doi:10.4137/cgast.s4469
9. Stoicescu A, Becheanu G, Dumbrava M, Gheorghe C, Diculescu M. Microscopic colitis – A missed diagnosis in diarrhea-predominant irritable bowel syndrome. Maedica (Buchar). 2012;7(1):3–9.
10. D’Angelo F, Felley C, Frossard JL. Calprotectin in daily practice: where do we stand in 2017? Digestion. 2017;95(4):293–301. doi:10.1159/000476062
11. Münch A, Aust D, Bohr J, et al. Microscopic colitis: current status, present and future challenges: statements of the European Microscopic Colitis Group. J Crohns Colitis. 2012;6(9):932–945. doi:10.1016/j.crohns.2012.05.014
12. Arasaradnam RP, Brown S, Forbes A, et al. Guidelines for the investigation of chronic diarrhoea in adults: British society of gastroenterology, 3rd edition. Gut. 2018;67:1380–1399. doi:10.1136/gutjnl-2017-315909
13. Fani B, Bertani L, Paglianiti I, et al. Pros and cons of the SeHCAT test in bile acid diarrhea: a more appropriate use of an old nuclear medicine technique. Gastroenterol Res Pract. 2018;2018:2097359. doi:10.1155/2018/2097359
14. Limburg PJ, Ahlquist DA, Sandborn WJ, et al. Fecal calprotectin levels predict colorectal inflammation among patients with chronic diarrhea referred for colonoscopy. Am J Gastroenterol. 2000;95(10):2831–2837. doi:10.1111/j.1572-0241.2000.03194.x
15. von Arnim WT, Ganzert C, Schulz C, Malfertheiner, P. Fecal calprotectin: a marker for clinical differentiation of microscopic colitis and irritable bowel syndrome. Clin Exp Gastroenterol. 2016;9:97–103. doi:10.2147/CEG.S97701
16. Wildt S, Nordgaard-Lassen I, Bendtsen F, Rumessen JJ. Metabolic and inflammatory faecal markers in collagenous colitis. Eur J Gastroenterol Hepatol. 2007;19(7):567–574. doi:10.1097/MEG.0b013e328058ed76
17. Larsson JK, Sjoberg K, Vigren L, Benoni C, Toth E, Olesen M. Chronic non-bloody diarrhoea: a prospective study in Malmo, Sweden, with focus on microscopic colitis. BMC Res Notes. 2014;7:236. doi:10.1186/1756-0500-7-236
18. Batista L, Ruiz L, Ferrer C, Zabana Y, Aceituno M, Arau B. Usefulness of fecal calprotectin as a biomarker of microscopic colitis in a cohort of patients with chronic watery diarrhoea of functional characteristics. Dig Liver Dis. 2019;
19. Bannaga A, Kelman L, O’Connor M, Pitchford C, Walters JRF, Arasaradnam RP. How bad is bile acid diarrhoea: an online survey of patient-reported symptoms and outcomes. BMJ Open Gastroenterol. 2017;4(1):e000116. doi:10.1136/bmjgast-2016-000116
20. Vijayvargiya P, Camilleri M. Update on bile acid malabsorption: finally ready for prime time? Curr Gastroenterol Rep. 2018;20(3):10. doi:10.1007/s11894-018-0615-z
21. Ung KA, Gilberg R, Kilander A, Abrahamsson H. Role of bile acids and bile acid binding agents in patients with collagenous colitis. Gut. 2000;46(2):170–175. doi:10.1136/gut.46.2.170
22. Ung KA, Kilander A, Willen R, Abrahamsson H. Role of bile acids in lymphocytic colitis. Hepatogastroenterology. 2002;49(44):432–437.
23. Rasmussen MA, Munck LK. Systematic review: are lymphocytic colitis and collagenous colitis two subtypes of the same disease – microscopic colitis? Ailment Pharmacol Ther. 2012;36(2):79–90. doi:10.1111/j.1365-2036.2012.05166.x
24. Brydon WG, Culbert P, Kingstone K, et al. An evaluation of the use of serum 7-alpha-hydroxycholestenone as a diagnostic test of bile acid malabsorption causing watery diarrhea. Can J Gastroenterol. 2011;25(6):319–323. doi:10.1155/2011/701287
25. Fernández-Bañares F, Esteve M, Salas A, et al. Bile acid malabsorption in microscopic colitis and in previously unexplained functional chronic diarrhea. Dig Dis Sci. 2001;46(10):2231–2238. doi:10.1023/A:1011927302076
 © 2020 The Author(s). This work is published and licensed by Dove Medical Press Limited. The
full terms of this license are available at https://www.dovepress.com/terms
and incorporate the Creative Commons Attribution
- Non Commercial (unported, 3.0) License.
By accessing the work you hereby accept the Terms. Non-commercial uses of the work are permitted
without any further permission from Dove Medical Press Limited, provided the work is properly
attributed. For permission for commercial use of this work, please see paragraphs 4.2 and 5 of our Terms.
© 2020 The Author(s). This work is published and licensed by Dove Medical Press Limited. The
full terms of this license are available at https://www.dovepress.com/terms
and incorporate the Creative Commons Attribution
- Non Commercial (unported, 3.0) License.
By accessing the work you hereby accept the Terms. Non-commercial uses of the work are permitted
without any further permission from Dove Medical Press Limited, provided the work is properly
attributed. For permission for commercial use of this work, please see paragraphs 4.2 and 5 of our Terms.